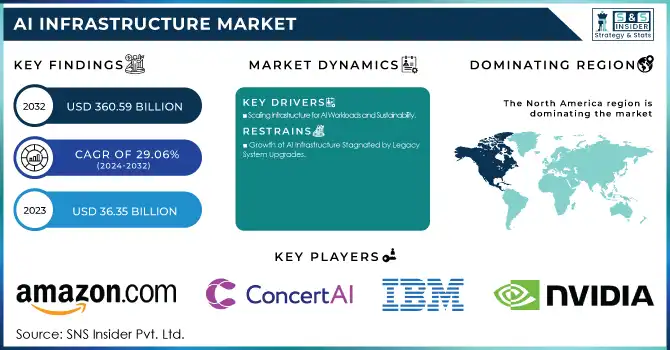
The AI Infrastructure Market Size was valued at USD 36.35 billion in 2023 and is expected to reach USD 360.59 billion by 2032 and grow at a CAGR of 29.06% over the forecast period 2024-2032.
The demand for high-performance computing to manage complex AI workloads and the rise in generative AI (GenAI) applications, including large language models, is driving this growth. These models require immense computational power for both training and inference. Cloud service providers are increasingly adopting AI infrastructure to offer scalable and cost-effective solutions, further fueling market expansion. Factors such as regional adoption rates, energy consumption and efficiency metrics, regulatory compliance, and ongoing innovation in R&D also contribute to the market's momentum.
Get more information on AI Infrastructure Market - Request Sample Report
Drivers:
Scaling Infrastructure for AI Workloads and Sustainability
The increasing adoption of generative AI is sensitive to the AI infrastructure market; around 65% of organizations have adopted AI models independently or with help from external experts. Because of this increased demand, 40% of operators who run data centers plan to increase capacity with infrastructure upgrades and construction. 41% of operators are bringing renewable energy directly onto their organizations and balancing immediate demands with their sustainability goals, while 38% are using energy management platforms for optimal energy operations. These factors together propel the market growth and increase the scalability & efficiency of AI infrastructure.
Restraints
Growth of AI Infrastructure Stagnated by Legacy System Upgrades
One key holding back the growth of the AI infrastructure market is the difficulty of migrating from legacy systems that are embedded in mission-critical operations. Legacy infrastructure are expensive and complex to upgrade for AI optimised platforms due to their basic compute, storage and flexibility restrictions. It affects the continuity of the business and it in turn slows the adoption of AI. In addition, our appetite for AI is stressing data centers, which are projected to use 9% of the nation electricity by 2030. Big investments are in store from companies such as Microsoft to address these increasing energy and infrastructure demands.
Opportunities:
Expanding Market for Scalable and Sustainable AI Infrastructure
The AI infrastructure market has enormous potential due to the increasing demand for AI-powered solutions. For instance, Nvidia has made strides in memory solutions and scalable AI networks, while Micron has amassed big investments, and DDN has benefits from this growth. The growth in AI workloads, expansion of data centers, and the integration of renewable energy, are becoming the bread and butter for AI infrastructure, evolving this market into one of the most exciting places for innovation in the space. This has led to strategic partnerships such as that of Hammerspace and MinIO, which allows players in the market to take advantage of increased functionality and revenue in AI driven ecosystems.
Challenges
Scalability Challenges in AI Infrastructure Amid Growing Demand for High-Performance Solutions
Implementing scalable AI infrastructure AI infrastructure scalability refers to the capability of an AI infrastructure to accommodate the fastest growing AI workloads and data. Microsoft, amongst others, are pouring their money towards this, towards a USD 30 billion infrastructure fund to cement vertical integration of AI in place. The increasing need for computational capacity in AI is stretching data centers, and the growing requirement for purpose-built hardware to scale AI workloads. Systems must be able to scale denser as the number of AI workloads doubles and reallocate resources and data more dynamically in order to address the growing demand for computational power and data management.
By Offering
Hardware became 62% of the AI infrastructure market, in 2023, driven by the demand for higher-performing systems for AI workloads. The USA is catching a hold of scaling the AI hardware position to area quick getting the high ground of the AI framework, the area additionally has the godsend of AI research, Cloud Computing, and so on.
The software segment to grow fastest over 2024 – 2032. Topping all global rankings for cloud computing and software development, North America has been outspent by China and Japan on investments to advance machine learning and AI technologies.
By Deployment
The cloud segment dominated of around 46% revenue share in AI infrastructure market in 2023, due to the increase in needs for scalable and flexible AI solutions that have been deployed on cloud based AI infrastructure. Essentially, how much cloud infrastructure the U.S. and Europe are building is going to help the AI Innovation.
The hybrid segment was the fastest-growing and is expected to continue growing between 2024 and 2032 benefiting from its balance of cloud versatility and on premise protection. A balance between data private and innovation, hybrid cloud benefits both, and the top 4 nations are - U.S., Germany, India and, China.
By Technology
In 2023, the machine-learning segment dominated the AI infrastructure market, comprising about 75% of the share, largely because machine learning gaining traction, especially in healthcare, finance, e-commerce, and retail industries. As automation and predictive analytics surge, the demand for resilient AI infrastructure has increased with investments
The deep learning segment to grow rapidly from 2024 to 2032, including healthcare, automotive, and finance, with North America and Asia-Pacific’s investments in the technology.
By End Use
In 2023, cloud service providers held around 50% of the AI infrastructure market, driven by the growing demand for scalable, flexible solutions. The U.S., China, and India are investing in expanding their cloud infrastructures to enhance AI capabilities.
The Enterprise Segment is the fastest growing in Ai Infrastructure Market through 2024 to 2032 where the growing adoption of AI based solutions across enterprises for automation, data processing and decision-making will augment the growth.
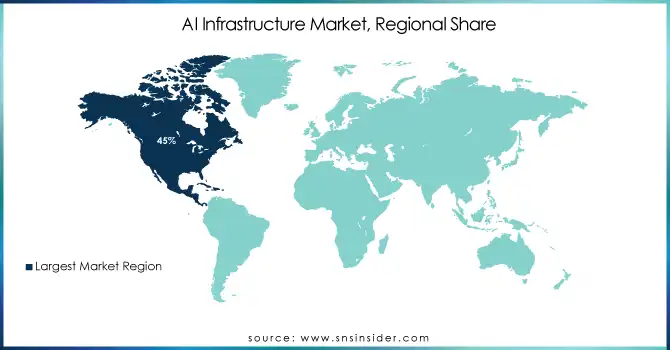
North America dominated the AI infrastructure industry, holding approximately 45% of global revenue due to substantial investments from leading technology firms. The United States particularly stands out, with giants such as Google, Microsoft, and Amazon pouring vast resources into AI infrastructure development. Alongside robust research capabilities and widespread cloud adoption, these heavy investments have allowed the region to cement its position as the foremost leader in AI worldwide.
Asia Pacific has emerged as the most rapidly expanding region for AI infrastructure. Across countries like China, Japan, and India, substantial public and private investments are powering intense growth in AI research and development. In China, state initiatives focus on constructing advanced computing infrastructure and cloud platforms to elevate AI capabilities. Simultaneously, India looks increasingly to AI technologies to modernize core industries like manufacturing and finance. Japan meanwhile directs attention towards robotics and automotive applications. Spurred by explosive technological adoption, burgeoning demand for scalable solutions, and government support, Asia Pacific has risen to become a pivotal hub within the global AI infrastructure industry.
Get Customized Report as per your Business Requirement - Request For Customized Report
Some of the Major Player in AI Infrastructure Market Along With Their Products
Nvidia Corporation (U.S.) - (AI Hardware, GPUs)
AIBrain (U.S.) - (AI-based software solutions)
IBM Corporation (U.S.) - (AI software, Watson AI)
ConcertAI (U.S.) - (AI for healthcare, data analytics)
Oracle Corporation (U.S.) - (AI and cloud solutions)
Salesforce, Inc. (U.S.) - (AI-powered CRM solutions)
Amazon.com, Inc. (U.S.) - (AWS AI, cloud services)
Google LLC (Alphabet Inc.) (U.S.) - (Google AI, TensorFlow)
Super Micro Computers, Inc. (U.S.) - (AI hardware, servers)
Intel Corporation (U.S.) - (AI chips, processors)
Microsoft (U.S.) - (Azure AI, cloud AI solutions)
Baidu (China) - (AI software, cloud services)
Huawei Technologies (China) - (AI hardware, cloud solutions)
Samsung Electronics (South Korea) - (AI chips, devices)
List of companies that provide raw materials and components for the AI infrastructure market:
TSMC (Taiwan)
AMD (U.S.)
Micron Technology (U.S.)
Broadcom (U.S.)
Samsung Electronics (South Korea)
Intel Corporation (U.S.)
Nvidia Corporation (U.S.)
Qualcomm (U.S.)
SK Hynix (South Korea)
Texas Instruments (U.S.)
4 February 2025, Nvidia as the pioneering graphics company reshaped its focus toward artificial intelligence applications and services. In a strategic drive to stimulate widespread innovation across industries, Nvidia forged lucrative partnerships with Amazon Web Services and Microsoft Azure.
August 29, 2024: Intel announced a collaborative endeavor with IBM that would deploy Intel's cutting-edge Gaudi 3 AI accelerators on the IBM Cloud platform starting in early 2025. This alliance aimed to provide enterprises with more cost-effective scaling of their AI workloads through enhanced performance delivered by Gaudi 3's seamless integration with Xeon CPUs. The solution sought to simultaneously optimize efficiency for deploying AI in the cloud and data centers while reducing total costs of ownership for businesses.
| Report Attributes | Details |
| Market Size in 2023 | USD 36.35 Billion |
| Market Size by 2032 | USD 360.59 Billion |
| CAGR | CAGR of 29.06% From 2024 to 2032 |
| Base Year | 2023 |
| Forecast Period | 2024-2032 |
| Historical Data | 2020-2022 |
| Report Scope & Coverage | Market Size, Segments Analysis, Competitive Landscape, Regional Analysis, DROC & SWOT Analysis, Forecast Outlook |
| Key Segments | • by Offering (Hardware [Processor, Storage, Memory], Software) • By Deployment (On-Premises, Cloud, Hybrid) • By Technology (Machine Learning, Deep Learning) • By End Use (Enterprise, Government Organization, Cloud Services Providers) |
| Regional Analysis/Coverage | North America (US, Canada, Mexico), Europe (Eastern Europe [Poland, Romania, Hungary, Turkey, Rest of Eastern Europe] Western Europe] Germany, France, UK, Italy, Spain, Netherlands, Switzerland, Austria, Rest of Western Europe]), Asia Pacific (China, India, Japan, South Korea, Vietnam, Singapore, Australia, Rest of Asia Pacific), Middle East & Africa (Middle East [UAE, Egypt, Saudi Arabia, Qatar, Rest of Middle East], Africa [Nigeria, South Africa, Rest of Africa], Latin America (Brazil, Argentina, Colombia, Rest of Latin America) |
| Company Profiles | Nvidia Corporation (U.S.), AIBrain (U.S.), IBM Corporation (U.S.), ConcertAI (U.S.), Oracle Corporation (U.S.), Salesforce, Inc. (U.S.), Amazon.com, Inc. (U.S.), Google LLC (U.S.), Super Micro Computers, Inc. (U.S.), Intel Corporation (U.S.), Microsoft (U.S.), Baidu (China), Huawei Technologies (China), and Samsung Electronics (South Korea) are key players in the AI infrastructure market, offering a range of AI solutions spanning hardware, software, cloud, and analytics. |
Ans: The AI Infrastructure Market size was valued at USD 36.35 billion in 2023.
Ans: The AI infrastructure market is driven by the increasing demand for scalable AI solutions across industries like healthcare, finance, and manufacturing, fueling the need for advanced computing hardware, cloud platforms, and AI software.
Ans: North America region is to dominate the AI Infrastructure Market.
Ans: Hardware segment is dominating in AI Infrastructure Market
Ans: The AI Infrastructure Market is growing at a CAGR of 29.06% over the forecast period 2024-2032.
Table of Content
1. Introduction
1.1 Market Definition
1.2 Scope (Inclusion and Exclusions)
1.3 Research Assumptions
2. Executive Summary
2.1 Market Overview
2.2 Regional Synopsis
2.3 Competitive Summary
3. Research Methodology
3.1 Top-Down Approach
3.2 Bottom-up Approach
3.3. Data Validation
3.4 Primary Interviews
4. Market Dynamics Impact Analysis
4.1 Market Driving Factors Analysis
4.1.1 Drivers
4.1.2 Restraints
4.1.3 Opportunities
4.1.4 Challenges
4.2 PESTLE Analysis
4.3 Porter’s Five Forces Model
5. Statistical Insights and Trends Reporting
5.1 Adoption Rates by Region
5.2 Energy Consumption & Efficiency Metrics
5.3 Regulatory and Compliance Data
5.4 Innovation and R&D
6. Competitive Landscape
6.1 List of Major Companies, By Region
6.2 Market Share Analysis, By Region
6.3 Product Benchmarking
6.3.1 Product specifications and features
6.3.2 Pricing
6.4 Strategic Initiatives
6.4.1 Marketing and promotional activities
6.4.2 Distribution and supply chain strategies
6.4.3 Expansion plans and new product launches
6.4.4 Strategic partnerships and collaborations
6.5 Technological Advancements
6.6 Market Positioning and Branding
7. AI Infrastructure Market Segmentation, by Type
7.1 Chapter Overview
7.2 Hardware
7.2.1 Hardware Market Trends Analysis (2020-2032)
7.2.2 Hardware Market Size Estimates and Forecasts to 2032 (USD Billion)
7.2.3 Processor
7.2.3.1 Processor Market Trends Analysis (2020-2032)
7.2.3.2 Processor Market Size Estimates and Forecasts to 2032 (USD Billion)
7.2.4 Storage
7.2.4.1 Storage Market Trends Analysis (2020-2032)
7.2.4.2 Storage Market Size Estimates and Forecasts to 2032 (USD Billion)
7.2.5 Memory
7.2.5.1 Memory Market Trends Analysis (2020-2032)
7.2.5.2 Memory Market Size Estimates and Forecasts to 2032 (USD Billion)
7.3 Software
7.3.1 Software Market Trends Analysis (2020-2032)
7.3.2 Software Market Size Estimates and Forecasts to 2032 (USD Billion)
8. AI Infrastructure Market Segmentation, by Deployment
8.1 Chapter Overview
8.2 On-Premises
8.2.1 On-Premises Market Trends Analysis (2020-2032)
8.2.2 On-Premises Market Size Estimates and Forecasts to 2032 (USD Billion)
8.3 Cloud
8.3.1 Cloud Market Trends Analysis (2020-2032)
8.3.2 Cloud Market Size Estimates and Forecasts to 2032 (USD Billion)
8.4 Hybrid
8.4.1 Hybrid Market Trends Analysis (2020-2032)
8.4.2 Hybrid Market Size Estimates and Forecasts to 2032 (USD Billion)
9. AI Infrastructure Market Segmentation, by Technology
9.1 Chapter Overview
9.2 Machine Learning
9.2.1 Machine Learning Market Trends Analysis (2020-2032)
9.2.2 Machine Learning Market Size Estimates and Forecasts to 2032 (USD Billion)
9.3 Deep Learning
9.3.1 Deep Learning Market Trends Analysis (2020-2032)
9.3.2 Deep Learning Market Size Estimates and Forecasts to 2032 (USD Billion)
10. AI Infrastructure Market Segmentation, by End Use
10.1 Chapter Overview
10.2 Enterprise
10.2.1 Enterprise Market Trends Analysis (2020-2032)
10.2.2 Enterprise Market Size Estimates and Forecasts to 2032 (USD Billion)
10.3 Government Organization
10.3.1 Government Organization Market Trends Analysis (2020-2032)
10.3.2 Government Organization Market Size Estimates and Forecasts to 2032 (USD Billion)
10.4 Cloud Services Provider
10.4.1 Cloud Services Provider Market Trends Analysis (2020-2032)
10.4.2 Cloud Services Provider Market Size Estimates and Forecasts to 2032 (USD Billion)
11. Regional Analysis
11.1 Chapter Overview
11.2 North America
11.2.1 Trends Analysis
11.2.2 North America AI Infrastructure Market Estimates and Forecasts, by Country (2020-2032) (USD Billion)
11.2.3 North America AI Infrastructure Market Estimates and Forecasts, by Type (2020-2032) (USD Billion)
11.2.4 North America AI Infrastructure Market Estimates and Forecasts, by Deployment (2020-2032) (USD Billion)
11.2.5 North America AI Infrastructure Market Estimates and Forecasts, by Technology (2020-2032) (USD Billion)
11.2.6 North America AI Infrastructure Market Estimates and Forecasts, by End Use (2020-2032) (USD Billion)
11.2.7 USA
11.2.7.1 USA AI Infrastructure Market Estimates and Forecasts, by Type (2020-2032) (USD Billion)
11.2.7.2 USA AI Infrastructure Market Estimates and Forecasts, by Deployment (2020-2032) (USD Billion)
11.2.7.3 USA AI Infrastructure Market Estimates and Forecasts, by Technology (2020-2032) (USD Billion)
11.2.7.4 USA AI Infrastructure Market Estimates and Forecasts, by End Use (2020-2032) (USD Billion)
11.2.8 Canada
11.2.8.1 Canada AI Infrastructure Market Estimates and Forecasts, by Type (2020-2032) (USD Billion)
11.2.8.2 Canada AI Infrastructure Market Estimates and Forecasts, by Deployment (2020-2032) (USD Billion)
11.2.8.3 Canada AI Infrastructure Market Estimates and Forecasts, by Technology (2020-2032) (USD Billion)
11.2.8.4 Canada AI Infrastructure Market Estimates and Forecasts, by End Use (2020-2032) (USD Billion)
11.2.9 Mexico
11.2.9.1 Mexico AI Infrastructure Market Estimates and Forecasts, by Type (2020-2032) (USD Billion)
11.2.9.2 Mexico AI Infrastructure Market Estimates and Forecasts, by Deployment (2020-2032) (USD Billion)
11.2.9.3 Mexico AI Infrastructure Market Estimates and Forecasts, by Technology (2020-2032) (USD Billion)
11.2.9.4 Mexico AI Infrastructure Market Estimates and Forecasts, by End Use (2020-2032) (USD Billion)
11.3 Europe
11.3.1 Eastern Europe
11.3.1.1 Trends Analysis
11.3.1.2 Eastern Europe AI Infrastructure Market Estimates and Forecasts, by Country (2020-2032) (USD Billion)
11.3.1.3 Eastern Europe AI Infrastructure Market Estimates and Forecasts, by Type (2020-2032) (USD Billion)
11.3.1.4 Eastern Europe AI Infrastructure Market Estimates and Forecasts, by Deployment (2020-2032) (USD Billion)
11.3.1.5 Eastern Europe AI Infrastructure Market Estimates and Forecasts, by Technology (2020-2032) (USD Billion)
11.3.1.6 Eastern Europe AI Infrastructure Market Estimates and Forecasts, by End Use (2020-2032) (USD Billion)
11.3.1.7 Poland
11.3.1.7.1 Poland AI Infrastructure Market Estimates and Forecasts, by Type (2020-2032) (USD Billion)
11.3.1.7.2 Poland AI Infrastructure Market Estimates and Forecasts, by Deployment (2020-2032) (USD Billion)
11.3.1.7.3 Poland AI Infrastructure Market Estimates and Forecasts, by Technology (2020-2032) (USD Billion)
11.3.1.7.4 Poland AI Infrastructure Market Estimates and Forecasts, by End Use (2020-2032) (USD Billion)
11.3.1.8 Romania
11.3.1.8.1 Romania AI Infrastructure Market Estimates and Forecasts, by Type (2020-2032) (USD Billion)
11.3.1.8.2 Romania AI Infrastructure Market Estimates and Forecasts, by Deployment (2020-2032) (USD Billion)
11.3.1.8.3 Romania AI Infrastructure Market Estimates and Forecasts, by Technology (2020-2032) (USD Billion)
11.3.1.8.4 Romania AI Infrastructure Market Estimates and Forecasts, by End Use (2020-2032) (USD Billion)
11.3.1.9 Hungary
11.3.1.9.1 Hungary AI Infrastructure Market Estimates and Forecasts, by Type (2020-2032) (USD Billion)
11.3.1.9.2 Hungary AI Infrastructure Market Estimates and Forecasts, by Deployment (2020-2032) (USD Billion)
11.3.1.9.3 Hungary AI Infrastructure Market Estimates and Forecasts, by Technology (2020-2032) (USD Billion)
11.3.1.9.4 Hungary AI Infrastructure Market Estimates and Forecasts, by End Use (2020-2032) (USD Billion)
11.3.1.10 Turkey
11.3.1.10.1 Turkey AI Infrastructure Market Estimates and Forecasts, by Type (2020-2032) (USD Billion)
11.3.1.10.2 Turkey AI Infrastructure Market Estimates and Forecasts, by Deployment (2020-2032) (USD Billion)
11.3.1.10.3 Turkey AI Infrastructure Market Estimates and Forecasts, by Technology (2020-2032) (USD Billion)
11.3.1.10.4 Turkey AI Infrastructure Market Estimates and Forecasts, by End Use (2020-2032) (USD Billion)
11.3.1.11 Rest of Eastern Europe
11.3.1.11.1 Rest of Eastern Europe AI Infrastructure Market Estimates and Forecasts, by Type (2020-2032) (USD Billion)
11.3.1.11.2 Rest of Eastern Europe AI Infrastructure Market Estimates and Forecasts, by Deployment (2020-2032) (USD Billion)
11.3.1.11.3 Rest of Eastern Europe AI Infrastructure Market Estimates and Forecasts, by Technology (2020-2032) (USD Billion)
11.3.1.11.4 Rest of Eastern Europe AI Infrastructure Market Estimates and Forecasts, by End Use (2020-2032) (USD Billion)
11.3.2 Western Europe
11.3.2.1 Trends Analysis
11.3.2.2 Western Europe AI Infrastructure Market Estimates and Forecasts, by Country (2020-2032) (USD Billion)
11.3.2.3 Western Europe AI Infrastructure Market Estimates and Forecasts, by Type (2020-2032) (USD Billion)
11.3.2.4 Western Europe AI Infrastructure Market Estimates and Forecasts, by Deployment (2020-2032) (USD Billion)
11.3.2.5 Western Europe AI Infrastructure Market Estimates and Forecasts, by Technology (2020-2032) (USD Billion)
11.3.2.6 Western Europe AI Infrastructure Market Estimates and Forecasts, by End Use (2020-2032) (USD Billion)
11.3.2.7 Germany
11.3.2.7.1 Germany AI Infrastructure Market Estimates and Forecasts, by Type (2020-2032) (USD Billion)
11.3.2.7.2 Germany AI Infrastructure Market Estimates and Forecasts, by Deployment (2020-2032) (USD Billion)
11.3.2.7.3 Germany AI Infrastructure Market Estimates and Forecasts, by Technology (2020-2032) (USD Billion)
11.3.2.7.4 Germany AI Infrastructure Market Estimates and Forecasts, by End Use (2020-2032) (USD Billion)
11.3.2.8 France
11.3.2.8.1 France AI Infrastructure Market Estimates and Forecasts, by Type (2020-2032) (USD Billion)
11.3.2.8.2 France AI Infrastructure Market Estimates and Forecasts, by Deployment (2020-2032) (USD Billion)
11.3.2.8.3 France AI Infrastructure Market Estimates and Forecasts, by Technology (2020-2032) (USD Billion)
11.3.2.8.4 France AI Infrastructure Market Estimates and Forecasts, by End Use (2020-2032) (USD Billion)
11.3.2.9 UK
11.3.2.9.1 UK AI Infrastructure Market Estimates and Forecasts, by Type (2020-2032) (USD Billion)
11.3.2.9.2 UK AI Infrastructure Market Estimates and Forecasts, by Deployment (2020-2032) (USD Billion)
11.3.2.9.3 UK AI Infrastructure Market Estimates and Forecasts, by Technology (2020-2032) (USD Billion)
11.3.2.9.4 UK AI Infrastructure Market Estimates and Forecasts, by End Use (2020-2032) (USD Billion)
11.3.2.10 Italy
11.3.2.10.1 Italy AI Infrastructure Market Estimates and Forecasts, by Type (2020-2032) (USD Billion)
11.3.2.10.2 Italy AI Infrastructure Market Estimates and Forecasts, by Deployment (2020-2032) (USD Billion)
11.3.2.10.3 Italy AI Infrastructure Market Estimates and Forecasts, by Technology (2020-2032) (USD Billion)
11.3.2.10.4 Italy AI Infrastructure Market Estimates and Forecasts, by End Use (2020-2032) (USD Billion)
11.3.2.11 Spain
11.3.2.11.1 Spain AI Infrastructure Market Estimates and Forecasts, by Type (2020-2032) (USD Billion)
11.3.2.11.2 Spain AI Infrastructure Market Estimates and Forecasts, by Deployment (2020-2032) (USD Billion)
11.3.2.11.3 Spain AI Infrastructure Market Estimates and Forecasts, by Technology (2020-2032) (USD Billion)
11.3.2.11.4 Spain AI Infrastructure Market Estimates and Forecasts, by End Use (2020-2032) (USD Billion)
11.3.2.12 Netherlands
11.3.2.12.1 Netherlands AI Infrastructure Market Estimates and Forecasts, by Type (2020-2032) (USD Billion)
11.3.2.12.2 Netherlands AI Infrastructure Market Estimates and Forecasts, by Deployment (2020-2032) (USD Billion)
11.3.2.12.3 Netherlands AI Infrastructure Market Estimates and Forecasts, by Technology (2020-2032) (USD Billion)
11.3.2.12.4 Netherlands AI Infrastructure Market Estimates and Forecasts, by End Use (2020-2032) (USD Billion)
11.3.2.13 Switzerland
11.3.2.13.1 Switzerland AI Infrastructure Market Estimates and Forecasts, by Type (2020-2032) (USD Billion)
11.3.2.13.2 Switzerland AI Infrastructure Market Estimates and Forecasts, by Deployment (2020-2032) (USD Billion)
11.3.2.13.3 Switzerland AI Infrastructure Market Estimates and Forecasts, by Technology (2020-2032) (USD Billion)
11.3.2.13.4 Switzerland AI Infrastructure Market Estimates and Forecasts, by End Use (2020-2032) (USD Billion)
11.3.2.14 Austria
11.3.2.14.1 Austria AI Infrastructure Market Estimates and Forecasts, by Type (2020-2032) (USD Billion)
11.3.2.14.2 Austria AI Infrastructure Market Estimates and Forecasts, by Deployment (2020-2032) (USD Billion)
11.3.2.14.3 Austria AI Infrastructure Market Estimates and Forecasts, by Technology (2020-2032) (USD Billion)
11.3.2.14.4 Austria AI Infrastructure Market Estimates and Forecasts, by End Use (2020-2032) (USD Billion)
11.3.2.15 Rest of Western Europe
11.3.2.15.1 Rest of Western Europe AI Infrastructure Market Estimates and Forecasts, by Type (2020-2032) (USD Billion)
11.3.2.15.2 Rest of Western Europe AI Infrastructure Market Estimates and Forecasts, by Deployment (2020-2032) (USD Billion)
11.3.2.15.3 Rest of Western Europe AI Infrastructure Market Estimates and Forecasts, by Technology (2020-2032) (USD Billion)
11.3.2.15.4 Rest of Western Europe AI Infrastructure Market Estimates and Forecasts, by End Use (2020-2032) (USD Billion)
11.4 Asia Pacific
11.4.1 Trends Analysis
11.4.2 Asia Pacific AI Infrastructure Market Estimates and Forecasts, by Country (2020-2032) (USD Billion)
11.4.3 Asia Pacific AI Infrastructure Market Estimates and Forecasts, by Type (2020-2032) (USD Billion)
11.4.4 Asia Pacific AI Infrastructure Market Estimates and Forecasts, by Deployment (2020-2032) (USD Billion)
11.4.5 Asia Pacific AI Infrastructure Market Estimates and Forecasts, by Technology (2020-2032) (USD Billion)
11.4.6 Asia Pacific AI Infrastructure Market Estimates and Forecasts, by End Use (2020-2032) (USD Billion)
11.4.7 China
11.4.7.1 China AI Infrastructure Market Estimates and Forecasts, by Type (2020-2032) (USD Billion)
11.4.7.2 China AI Infrastructure Market Estimates and Forecasts, by Deployment (2020-2032) (USD Billion)
11.4.7.3 China AI Infrastructure Market Estimates and Forecasts, by Technology (2020-2032) (USD Billion)
11.4.7.4 China AI Infrastructure Market Estimates and Forecasts, by End Use (2020-2032) (USD Billion)
11.4.8 India
11.4.8.1 India AI Infrastructure Market Estimates and Forecasts, by Type (2020-2032) (USD Billion)
11.4.8.2 India AI Infrastructure Market Estimates and Forecasts, by Deployment (2020-2032) (USD Billion)
11.4.8.3 India AI Infrastructure Market Estimates and Forecasts, by Technology (2020-2032) (USD Billion)
11.4.8.4 India AI Infrastructure Market Estimates and Forecasts, by End Use (2020-2032) (USD Billion)
11.4.9 Japan
11.4.9.1 Japan AI Infrastructure Market Estimates and Forecasts, by Type (2020-2032) (USD Billion)
11.4.9.2 Japan AI Infrastructure Market Estimates and Forecasts, by Deployment (2020-2032) (USD Billion)
11.4.9.3 Japan AI Infrastructure Market Estimates and Forecasts, by Technology (2020-2032) (USD Billion)
11.4.9.4 Japan AI Infrastructure Market Estimates and Forecasts, by End Use (2020-2032) (USD Billion)
11.4.10 South Korea
11.4.10.1 South Korea AI Infrastructure Market Estimates and Forecasts, by Type (2020-2032) (USD Billion)
11.4.10.2 South Korea AI Infrastructure Market Estimates and Forecasts, by Deployment (2020-2032) (USD Billion)
11.4.10.3 South Korea AI Infrastructure Market Estimates and Forecasts, by Technology (2020-2032) (USD Billion)
11.4.10.4 South Korea AI Infrastructure Market Estimates and Forecasts, by End Use (2020-2032) (USD Billion)
11.4.11 Vietnam
11.4.11.1 Vietnam AI Infrastructure Market Estimates and Forecasts, by Type (2020-2032) (USD Billion)
11.4.11.2 Vietnam AI Infrastructure Market Estimates and Forecasts, by Deployment (2020-2032) (USD Billion)
11.4.11.3 Vietnam AI Infrastructure Market Estimates and Forecasts, by Technology (2020-2032) (USD Billion)
11.4.11.4 Vietnam AI Infrastructure Market Estimates and Forecasts, by End Use (2020-2032) (USD Billion)
11.4.12 Singapore
11.4.12.1 Singapore AI Infrastructure Market Estimates and Forecasts, by Type (2020-2032) (USD Billion)
11.4.12.2 Singapore AI Infrastructure Market Estimates and Forecasts, by Deployment (2020-2032) (USD Billion)
11.4.12.3 Singapore AI Infrastructure Market Estimates and Forecasts, by Technology (2020-2032) (USD Billion)
11.4.12.4 Singapore AI Infrastructure Market Estimates and Forecasts, by End Use (2020-2032) (USD Billion)
11.4.13 Australia
11.4.13.1 Australia AI Infrastructure Market Estimates and Forecasts, by Type (2020-2032) (USD Billion)
11.4.13.2 Australia AI Infrastructure Market Estimates and Forecasts, by Deployment (2020-2032) (USD Billion)
11.4.13.3 Australia AI Infrastructure Market Estimates and Forecasts, by Technology (2020-2032) (USD Billion)
11.4.13.4 Australia AI Infrastructure Market Estimates and Forecasts, by End Use (2020-2032) (USD Billion)
11.4.14 Rest of Asia Pacific
11.4.14.1 Rest of Asia Pacific AI Infrastructure Market Estimates and Forecasts, by Type (2020-2032) (USD Billion)
11.4.14.2 Rest of Asia Pacific AI Infrastructure Market Estimates and Forecasts, by Deployment (2020-2032) (USD Billion)
11.4.14.3 Rest of Asia Pacific AI Infrastructure Market Estimates and Forecasts, by Technology (2020-2032) (USD Billion)
11.4.14.4 Rest of Asia Pacific AI Infrastructure Market Estimates and Forecasts, by End Use (2020-2032) (USD Billion)
11.5 Middle East and Africa
11.5.1 Middle East
11.5.1.1 Trends Analysis
11.5.1.2 Middle East AI Infrastructure Market Estimates and Forecasts, by Country (2020-2032) (USD Billion)
11.5.1.3 Middle East AI Infrastructure Market Estimates and Forecasts, by Type (2020-2032) (USD Billion)
11.5.1.4 Middle East AI Infrastructure Market Estimates and Forecasts, by Deployment (2020-2032) (USD Billion)
11.5.1.5 Middle East AI Infrastructure Market Estimates and Forecasts, by Technology (2020-2032) (USD Billion)
11.5.1.6 Middle East AI Infrastructure Market Estimates and Forecasts, by End Use (2020-2032) (USD Billion)
11.5.1.7 UAE
11.5.1.7.1 UAE AI Infrastructure Market Estimates and Forecasts, by Type (2020-2032) (USD Billion)
11.5.1.7.2 UAE AI Infrastructure Market Estimates and Forecasts, by Deployment (2020-2032) (USD Billion)
11.5.1.7.3 UAE AI Infrastructure Market Estimates and Forecasts, by Technology (2020-2032) (USD Billion)
11.5.1.7.4 UAE AI Infrastructure Market Estimates and Forecasts, by End Use (2020-2032) (USD Billion)
11.5.1.8 Egypt
11.5.1.8.1 Egypt AI Infrastructure Market Estimates and Forecasts, by Type (2020-2032) (USD Billion)
11.5.1.8.2 Egypt AI Infrastructure Market Estimates and Forecasts, by Deployment (2020-2032) (USD Billion)
11.5.1.8.3 Egypt AI Infrastructure Market Estimates and Forecasts, by Technology (2020-2032) (USD Billion)
11.5.1.8.4 Egypt AI Infrastructure Market Estimates and Forecasts, by End Use (2020-2032) (USD Billion)
11.5.1.9 Saudi Arabia
11.5.1.9.1 Saudi Arabia AI Infrastructure Market Estimates and Forecasts, by Type (2020-2032) (USD Billion)
11.5.1.9.2 Saudi Arabia AI Infrastructure Market Estimates and Forecasts, by Deployment (2020-2032) (USD Billion)
11.5.1.9.3 Saudi Arabia AI Infrastructure Market Estimates and Forecasts, by Technology (2020-2032) (USD Billion)
11.5.1.9.4 Saudi Arabia AI Infrastructure Market Estimates and Forecasts, by End Use (2020-2032) (USD Billion)
11.5.1.10 Qatar
11.5.1.10.1 Qatar AI Infrastructure Market Estimates and Forecasts, by Type (2020-2032) (USD Billion)
11.5.1.10.2 Qatar AI Infrastructure Market Estimates and Forecasts, by Deployment (2020-2032) (USD Billion)
11.5.1.10.3 Qatar AI Infrastructure Market Estimates and Forecasts, by Technology (2020-2032) (USD Billion)
11.5.1.10.4 Qatar AI Infrastructure Market Estimates and Forecasts, by End Use (2020-2032) (USD Billion)
11.5.1.11 Rest of Middle East
11.5.1.11.1 Rest of Middle East AI Infrastructure Market Estimates and Forecasts, by Type (2020-2032) (USD Billion)
11.5.1.11.2 Rest of Middle East AI Infrastructure Market Estimates and Forecasts, by Deployment (2020-2032) (USD Billion)
11.5.1.11.3 Rest of Middle East AI Infrastructure Market Estimates and Forecasts, by Technology (2020-2032) (USD Billion)
11.5.1.11.4 Rest of Middle East AI Infrastructure Market Estimates and Forecasts, by End Use (2020-2032) (USD Billion)
11.5.2 Africa
11.5.2.1 Trends Analysis
11.5.2.2 Africa AI Infrastructure Market Estimates and Forecasts, by Country (2020-2032) (USD Billion)
11.5.2.3 Africa AI Infrastructure Market Estimates and Forecasts, by Type (2020-2032) (USD Billion)
11.5.2.4 Africa AI Infrastructure Market Estimates and Forecasts, by Deployment (2020-2032) (USD Billion)
11.5.2.5 Africa AI Infrastructure Market Estimates and Forecasts, by Technology (2020-2032) (USD Billion)
11.5.2.6 Africa AI Infrastructure Market Estimates and Forecasts, by End Use (2020-2032) (USD Billion)
11.5.2.7 South Africa
11.5.2.7.1 South Africa AI Infrastructure Market Estimates and Forecasts, by Type (2020-2032) (USD Billion)
11.5.2.7.2 South Africa AI Infrastructure Market Estimates and Forecasts, by Deployment (2020-2032) (USD Billion)
11.5.2.7.3 South Africa AI Infrastructure Market Estimates and Forecasts, by Technology (2020-2032) (USD Billion)
11.5.2.7.4 South Africa AI Infrastructure Market Estimates and Forecasts, by End Use (2020-2032) (USD Billion)
11.5.2.8 Nigeria
11.5.2.8.1 Nigeria AI Infrastructure Market Estimates and Forecasts, by Type (2020-2032) (USD Billion)
11.5.2.8.2 Nigeria AI Infrastructure Market Estimates and Forecasts, by Deployment (2020-2032) (USD Billion)
11.5.2.8.3 Nigeria AI Infrastructure Market Estimates and Forecasts, by Technology (2020-2032) (USD Billion)
11.5.2.8.4 Nigeria AI Infrastructure Market Estimates and Forecasts, by End Use (2020-2032) (USD Billion)
11.5.2.9 Rest of Africa
11.5.2.9.1 Rest of Africa AI Infrastructure Market Estimates and Forecasts, by Type (2020-2032) (USD Billion)
11.5.2.9.2 Rest of Africa AI Infrastructure Market Estimates and Forecasts, by Deployment (2020-2032) (USD Billion)
11.5.2.9.3 Rest of Africa AI Infrastructure Market Estimates and Forecasts, by Technology (2020-2032) (USD Billion)
11.5.2.9.4 Rest of Africa AI Infrastructure Market Estimates and Forecasts, by End Use (2020-2032) (USD Billion)
11.6 Latin America
11.6.1 Trends Analysis
11.6.2 Latin America AI Infrastructure Market Estimates and Forecasts, by Country (2020-2032) (USD Billion)
11.6.3 Latin America AI Infrastructure Market Estimates and Forecasts, by Type (2020-2032) (USD Billion)
11.6.4 Latin America AI Infrastructure Market Estimates and Forecasts, by Deployment (2020-2032) (USD Billion)
11.6.5 Latin America AI Infrastructure Market Estimates and Forecasts, by Technology (2020-2032) (USD Billion)
11.6.6 Latin America AI Infrastructure Market Estimates and Forecasts, by End Use (2020-2032) (USD Billion)
11.6.7 Brazil
11.6.7.1 Brazil AI Infrastructure Market Estimates and Forecasts, by Type (2020-2032) (USD Billion)
11.6.7.2 Brazil AI Infrastructure Market Estimates and Forecasts, by Deployment (2020-2032) (USD Billion)
11.6.7.3 Brazil AI Infrastructure Market Estimates and Forecasts, by Technology (2020-2032) (USD Billion)
11.6.7.4 Brazil AI Infrastructure Market Estimates and Forecasts, by End Use (2020-2032) (USD Billion)
11.6.8 Argentina
11.6.8.1 Argentina AI Infrastructure Market Estimates and Forecasts, by Type (2020-2032) (USD Billion)
11.6.8.2 Argentina AI Infrastructure Market Estimates and Forecasts, by Deployment (2020-2032) (USD Billion)
11.6.8.3 Argentina AI Infrastructure Market Estimates and Forecasts, by Technology (2020-2032) (USD Billion)
11.6.8.4 Argentina AI Infrastructure Market Estimates and Forecasts, by End Use (2020-2032) (USD Billion)
11.6.9 Colombia
11.6.9.1 Colombia AI Infrastructure Market Estimates and Forecasts, by Type (2020-2032) (USD Billion)
11.6.9.2 Colombia AI Infrastructure Market Estimates and Forecasts, by Deployment (2020-2032) (USD Billion)
11.6.9.3 Colombia AI Infrastructure Market Estimates and Forecasts, by Technology (2020-2032) (USD Billion)
11.6.9.4 Colombia AI Infrastructure Market Estimates and Forecasts, by End Use (2020-2032) (USD Billion)
11.6.10 Rest of Latin America
11.6.10.1 Rest of Latin America AI Infrastructure Market Estimates and Forecasts, by Type (2020-2032) (USD Billion)
11.6.10.2 Rest of Latin America AI Infrastructure Market Estimates and Forecasts, by Deployment (2020-2032) (USD Billion)
11.6.10.3 Rest of Latin America AI Infrastructure Market Estimates and Forecasts, by Technology (2020-2032) (USD Billion)
11.6.10.4 Rest of Latin America AI Infrastructure Market Estimates and Forecasts, by End Use (2020-2032) (USD Billion)
12. Company Profiles
12.1 Nvidia Corporation
12.1.1 Company Overview
12.1.2 Financial
12.1.3 Products/ Services Offered
12.1.4 SWOT Analysis
12.2 , AIBrain
12.2.1 Company Overview
12.2.2 Financial
12.2.3 Products/ Services Offered
12.2.4 SWOT Analysis
12.3 IBM Corporation
12.3.1 Company Overview
12.3.2 Financial
12.3.3 Products/ Services Offered
12.3.4 SWOT Analysis
12.4 ConcertAI
12.4.1 Company Overview
12.4.2 Financial
12.4.3 Products/ Services Offered
12.4.4 SWOT Analysis
12.5 Oracle Corporation
12.5.1 Company Overview
12.5.2 Financial
12.5.3 Products/ Services Offered
12.5.4 SWOT Analysis
12.6 Salesforce, Inc.
12.6.1 Company Overview
12.6.2 Financial
12.6.3 Products/ Services Offered
12.6.4 SWOT Analysis
12.7 Amazon.com, Inc.
12.7.1 Company Overview
12.7.2 Financial
12.7.3 Products/ Services Offered
12.7.4 SWOT Analysis
12.8 Google LLC
12.8.1 Company Overview
12.8.2 Financial
12.8.3 Products/ Services Offered
12.8.4 SWOT Analysis
12.9 Super Micro Computers, Inc.
12.9.1 Company Overview
12.9.2 Financial
12.9.3 Products/ Services Offered
12.9.4 SWOT Analysis
12.10 Intel Corporation
12.10.1 Company Overview
12.10.2 Financial
12.10.3 Products/ Services Offered
12.10.4 SWOT Analysis
13. Use Cases and Best Practices
14. Conclusion
An accurate research report requires proper strategizing as well as implementation. There are multiple factors involved in the completion of good and accurate research report and selecting the best methodology to compete the research is the toughest part. Since the research reports we provide play a crucial role in any company’s decision-making process, therefore we at SNS Insider always believe that we should choose the best method which gives us results closer to reality. This allows us to reach at a stage wherein we can provide our clients best and accurate investment to output ratio.
Each report that we prepare takes a timeframe of 350-400 business hours for production. Starting from the selection of titles through a couple of in-depth brain storming session to the final QC process before uploading our titles on our website we dedicate around 350 working hours. The titles are selected based on their current market cap and the foreseen CAGR and growth.
The 5 steps process:
Step 1: Secondary Research:
Secondary Research or Desk Research is as the name suggests is a research process wherein, we collect data through the readily available information. In this process we use various paid and unpaid databases which our team has access to and gather data through the same. This includes examining of listed companies’ annual reports, Journals, SEC filling etc. Apart from this our team has access to various associations across the globe across different industries. Lastly, we have exchange relationships with various university as well as individual libraries.

Step 2: Primary Research
When we talk about primary research, it is a type of study in which the researchers collect relevant data samples directly, rather than relying on previously collected data. This type of research is focused on gaining content specific facts that can be sued to solve specific problems. Since the collected data is fresh and first hand therefore it makes the study more accurate and genuine.
We at SNS Insider have divided Primary Research into 2 parts.
Part 1 wherein we interview the KOLs of major players as well as the upcoming ones across various geographic regions. This allows us to have their view over the market scenario and acts as an important tool to come closer to the accurate market numbers. As many as 45 paid and unpaid primary interviews are taken from both the demand and supply side of the industry to make sure we land at an accurate judgement and analysis of the market.
This step involves the triangulation of data wherein our team analyses the interview transcripts, online survey responses and observation of on filed participants. The below mentioned chart should give a better understanding of the part 1 of the primary interview.

Part 2: In this part of primary research the data collected via secondary research and the part 1 of the primary research is validated with the interviews from individual consultants and subject matter experts.
Consultants are those set of people who have at least 12 years of experience and expertise within the industry whereas Subject Matter Experts are those with at least 15 years of experience behind their back within the same space. The data with the help of two main processes i.e., FGDs (Focused Group Discussions) and IDs (Individual Discussions). This gives us a 3rd party nonbiased primary view of the market scenario making it a more dependable one while collation of the data pointers.
Step 3: Data Bank Validation
Once all the information is collected via primary and secondary sources, we run that information for data validation. At our intelligence centre our research heads track a lot of information related to the market which includes the quarterly reports, the daily stock prices, and other relevant information. Our data bank server gets updated every fortnight and that is how the information which we collected using our primary and secondary information is revalidated in real time.

Step 4: QA/QC Process
After all the data collection and validation our team does a final level of quality check and quality assurance to get rid of any unwanted or undesired mistakes. This might include but not limited to getting rid of the any typos, duplication of numbers or missing of any important information. The people involved in this process include technical content writers, research heads and graphics people. Once this process is completed the title gets uploader on our platform for our clients to read it.
Step 5: Final QC/QA Process:
This is the last process and comes when the client has ordered the study. In this process a final QA/QC is done before the study is emailed to the client. Since we believe in giving our clients a good experience of our research studies, therefore, to make sure that we do not lack at our end in any way humanly possible we do a final round of quality check and then dispatch the study to the client.
By Offering
Hardware
Processor
Storage
Memory
Software
By Deployment
On-Premises
Cloud
Hybrid
By Technology
Machine Learning
Deep Learning
By End Use
Enterprise
Government Organization
Cloud Services Providers
Request for Segment Customization as per your Business Requirement: Segment Customization Request
REGIONAL COVERAGE:
North America
US
Canada
Mexico
Europe
Eastern Europe
Poland
Romania
Hungary
Turkey
Rest of Eastern Europe
Western Europe
Germany
France
UK
Italy
Spain
Netherlands
Switzerland
Austria
Rest of Western Europe
Asia-Pacific
China
India
Japan
South Korea
Vietnam
Singapore
Australia
Rest of Asia Pacific
Middle East & Africa
Middle East
UAE
Egypt
Saudi Arabia
Qatar
Rest of the Middle East
Africa
Nigeria
South Africa
Rest of Africa
Latin America
Brazil
Argentina
Colombia
Rest of Latin America
Request for Country Level Research Report: Country Level Customization Request
Available Customization
With the given market data, SNS Insider offers customization as per the company’s specific needs. The following customization options are available for the report:
Product Analysis
Criss-Cross segment analysis (e.g. Product X Application)
Product Matrix which gives a detailed comparison of the product portfolio of each company
Geographic Analysis
Additional countries in any of the regions
Company Information
Detailed analysis and profiling of additional market players (Up to five)
The Neural Processor Market was valued at USD 231.8 million in 2023 and is expected to reach USD 1085.1 million by 2032, growing at a CAGR of 18.73% from 2024-2032.
The Smart Road Market size was valued at USD 17.85 billion in 2023. It is estimated to hit USD 145.34 billion by 2032 and grow at a CAGR of 26.24% over the forecast period of 2024-2032.
The Audio Amplifier Market Size was valued at USD 4.78 billion in 2023 and is expected to grow at a CAGR of 5.67% to reach USD 7.85 billion by 2032.
The Display Driver Integrated Circuit Market size was USD 4.29 Bn in 2023 & is expected to reach USD 7.32 Bn by 2032 & grow at a CAGR of 6.12% by 2024-2032.
The Portable Battery Market Size was valued at USD 14.4 billion in 2023 and is expected to reach USD 34.79 billion by 2032 and grow at a CAGR of 10.3% over the forecast period 2024-2032.
LAN Cable Market Size was valued at USD 14.08 Billion in 2023 and is expected to reach USD 44.41 Billion by 2032 and grow at a CAGR of 13.63% over the forecast period 2024-2032.

Hi! Click one of our member below to chat on Phone
© 2025 All Rights Reserved by SNS Insider Pvt Ltd


