The AI In Asset Management Market was valued at USD 3.25 billion in 2023 and is expected to reach USD 23.01 billion by 2032, growing at a CAGR of 24.36% from 2024-2032. This report includes an analysis of adoption rates, investment and funding trends, cost-benefit factors, regulatory and compliance developments, and customer sentiment. The adoption of AI-driven solutions is rising as firms prioritize automation and data-driven decision-making, while investments and funding surge due to advancements in predictive analytics and risk management. Cost-benefit analysis highlights AI’s role in enhancing efficiency and reducing operational costs, while regulatory trends emphasize data security and ethical AI use. Customer sentiment remains positive, with growing trust in AI for portfolio management and asset optimization.
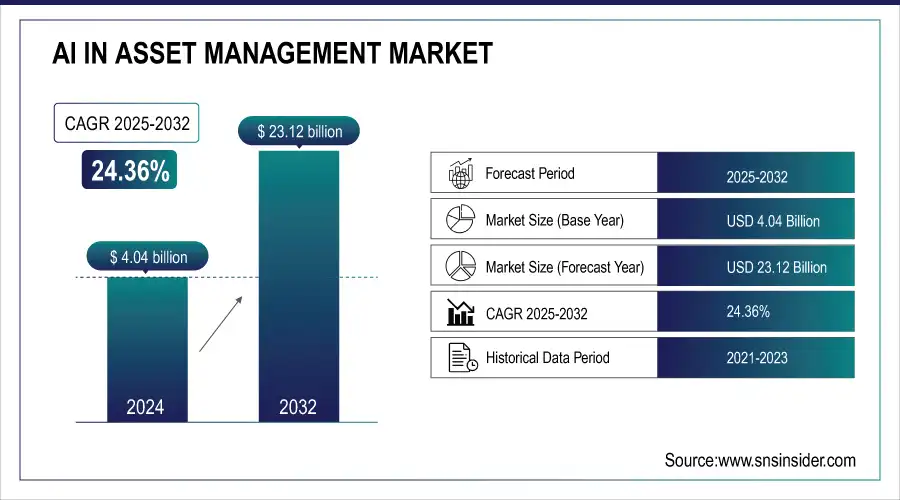
To Get more information on AI In Asset Management Market - Request Free Sample Report
Drivers
AI-powered analytics revolutionize asset management by enhancing decision-making, optimizing portfolios, predicting market trends, and minimizing risks.
Artificial intelligence analytics are transforming the world of asset management by improving decision-making. Using machine learning and sophisticated data processing, AI is capable of discerning complex market patterns and trends that conventional approaches tend to miss. This allows asset managers to make better investment decisions, optimize portfolio allocations, and forecast market movements more accurately. Data analysis in real-time facilitates quick response to market changes, minimizing risks, and maximizing returns. Secondly, AI insights assist in reducing human bias, providing more objective and data-driven solutions. As financial markets become more complex, AI capability to analyze large volumes of information and create actionable intelligence is turning into an asset manager's game-changer to find a competitive advantage in an ever-changing investment environment.
Restraints
High AI implementation costs, infrastructure demands, and skilled workforce shortages hinder adoption in asset management, limiting its widespread integration.
Implementation and integration of AI solutions into asset management require large amounts of financial investment, which becomes a hurdle for most companies. High expenses involved in sophisticated AI models, stable infrastructure, and trained experts are likely to force limitations on accessibility, especially for small asset management companies. The need for ongoing updates to AI systems also drives operational costs, deterring full-scale adoption. For most firms, balancing the advantages of AI with its cost scares them off at a slower rate. The requirement of specialized knowledge increases the complexity of implementation since companies have to incur costs for training or recruiting individuals with expertise in both AI and finance. Under-resourced organizations might not effectively utilize AI potential, postponing its integration in asset management planning.
Opportunities
AI enhances ESG investing by analyzing sustainability data, improving transparency, detecting greenwashing, and optimizing sustainable investment decisions for asset managers.
AI is revolutionizing environmental, social, and governance (ESG) investing by facilitating more accurate analysis of sustainability data. Conventional ESG evaluation tends to depend on disjointed or unreliable sources of data, but AI-powered analytics can handle large volumes of structured and unstructured data such as company filings, news sentiment, and satellite imagery to reveal richer insights. This improves transparency, assists asset managers in locating high-potential sustainable investments, and enforces compliance with changing ESG regulations. AI’s ability to detect greenwashing misleading sustainability claims further strengthens investor confidence in ethical investments. As demand for responsible investing grows, AI-powered ESG strategies provide asset managers with a competitive edge, enabling them to align portfolios with long-term sustainability goals while optimizing financial performance.
Challenges
AI-driven asset management faces risks from data quality issues and bias, leading to flawed predictions and suboptimal investment decisions.
AI asset management relies on accurate, unbiased information to make effective investment choices. Inconsistencies, incomplete data, and biased data, though, may result in incorrect predictions, misplaced portfolio strategies, and financial loss. AI algorithms learn from the past, and if the data used for training has inherent bias, the system will perpetuate these errors and make suboptimal decisions. Furthermore, financial markets are constantly changing, and therefore data needs to be updated constantly to remain relevant and accurate. Without strong data validation processes, AI-based insights can misread market trends, and asset managers will face heightened risks. Solving these issues involves sophisticated data processing methods, diversified data sets, and ongoing monitoring to make AI more reliable and objective-driven, data-driven investment strategies.
By Deployment Mode
The On-Premises segment led the AI in Asset Management Market with the largest revenue share of around 57% in 2023. The demand for stronger data security, compliance, and complete control over sensitive financial data fuels the growth. Financial institutions and asset management companies favor on-premises AI to prevent cybersecurity threats and guarantee adherence to stringent data protection policies. Moreover, on-premises infrastructure supports tailorable AI models, providing smoother integration with mature systems and greater performance optimization in sophisticated investment programs.
The Cloud segment is predicted to grow with the fastest CAGR of 25.96% from 2024 to 2032. The growing adoption of scalable, affordable, and adaptable AI technology drives it. Cloud-based AI supports real-time processing of data, easy integration with sophisticated analytics platforms, and remote access, which makes it the perfect choice for contemporary asset managers. Furthermore, advancements in cloud security and compliance platforms are nudging financial institutions to implement cloud AI solutions, driving the segment's growth over the next few years.
By Application
The Process Automation segment led the AI in Asset Management Market with the largest revenue share of nearly 29% in 2023. This is attributed to the growing demand for asset management operations efficiency, minimizing human errors, and increasing workflow automation. Automation with AI reduces redundant processes like trade processing, portfolio rebalancing, and compliance monitoring, which results in high cost savings and operational precision. Financial institutions depend on process automation to maximize resource utilization, enhance decision-making pace, and maximize overall investment management performance.
The Data Analysis segment is anticipated to grow at the fastest CAGR of 27.07% over 2024-2032. This increased growth is driven by the growing significance of AI-driven insights for informed investment decisions. Asset managers increasingly rely on AI-based data analytics to study market patterns, forecast investment risks, and maximize portfolio returns. The expanding use of big data and machine learning in making financial decisions and rising demand for real-time analysis are fueling the growth of this segment.
By Technology
The Machine Learning segment dominated the AI in Asset Management Market with the highest revenue share of about 61% in 2023. This dominance is driven by its ability to analyze vast datasets, identify market patterns, and enhance predictive analytics for investment strategies. Machine learning algorithms enable asset managers to optimize portfolio management, automate risk assessment, and improve decision-making accuracy. The increasing reliance on AI-driven quantitative analysis, fraud detection, and algorithmic trading further solidifies machine learning’s leadership in transforming asset management operations.
The Natural Language Processing (NLP) segment is expected to grow at the fastest CAGR of about 26.03% from 2024 to 2032. This rapid growth is fueled by the increasing need for AI-driven sentiment analysis, automated report generation, and real-time processing of financial news. NLP enhances investment decision-making by analyzing unstructured data from news sources, earnings reports, and market sentiments. As asset managers seek deeper insights from textual data, the demand for NLP solutions in financial analysis and risk assessment continues to rise.
North America dominated the AI in Asset Management Market with the highest revenue share of about 50% in 2023. This dominance is driven by the strong presence of leading financial institutions, early adoption of AI technologies, and a well-established regulatory framework supporting AI integration. The region's advanced infrastructure, high investment in AI-driven financial services, and increasing demand for automation in asset management contribute to its leadership. Additionally, the growing use of machine learning and predictive analytics in portfolio management strengthens North America’s position.
Asia Pacific is expected to grow at the fastest CAGR of about 27.11% from 2024 to 2032. This rapid growth is fueled by the rising adoption of AI in financial services, increasing digital transformation, and expanding asset management firms in emerging economies. Countries like China, India, and Japan are investing heavily in AI-powered financial technologies to enhance investment strategies and risk management. Additionally, the growing number of retail investors and the shift toward cloud-based AI solutions drive the market expansion in the region.
Get Customized Report as per Your Business Requirement - Enquiry Now
Amazon Web Services, Inc. (Amazon SageMaker, AWS AI Services)
BlackRock, Inc. (Aladdin, FutureAdvisor)
CapitalG (Investments in AI-focused companies, Strategic AI partnerships)
Charles Schwab & Co., Inc. (Schwab Intelligent Portfolios, AI-driven financial advice tools)
Genpact (Cora Finance Analytics, AI-powered asset management solutions)
Infosys Limited (Infosys Nia, AI-driven financial services solutions)
International Business Machines Corporation (IBM Watson, IBM Cloud Pak for Data)
IPsoft Inc. (Amelia, 1Desk)
Lexalytics (Salience, Lexalytics Intelligence Platform)
Microsoft (Azure AI, Microsoft Power BI)
TABLEAU SOFTWARE, LLC (Tableau Desktop, Tableau Server)
Next IT Corp. (Alme, AI-powered virtual assistants)
S&P Global (Market Intelligence Platform, Kensho AI)
Salesforce, Inc. (Einstein Analytics, AI-driven CRM solutions)
FIS (FIS Asset Management Solutions, FIS Data Integrity Manager)
ION Group (ION Treasury, ION Analytics)
Synechron (Neo AI Platform, AI Data Science Accelerators)
SAP SE (SAP Cash Application, SAP Leonardo)
HighRadius (Autonomous Receivables, AI-powered Treasury Management)
Axyon AI (Axyon IRIS, AI Investment Strategies)
Upstart (AI-powered Lending Platform, Upstart Auto Retail)
Capgemini SE (AI in Wealth Management Solutions, AI-powered Financial Services)
BayCurrent Inc. (AI Consulting Services, AI-driven Financial Solutions)
MGX Fund Management Limited (AI Investment Fund, Global AI Infrastructure Investment Partnership)
2025: AWS is expanding its AI efforts in asset management and financial services, working with firms like JPMorgan and Bridgewater. The company is investing heavily in AI-powered security, governance, and compliance tools while improving generative AI reliability through AWS Bedrock.
In 2025, IBM focuses on AI-powered automation to achieve sustainability goals in asset management. AI-driven observability, resource management, and lifecycle management will help optimize energy consumption, reduce data center strain, and enhance asset performance.
In 2024, SAP integrated AI and IoT into its Intelligent Asset Management solutions, enhancing predictive maintenance, resource optimization, and sustainability. The platform now enables proactive asset decision-making through a unified data thread, reducing downtime and improving efficiency.
Report Attributes | Details |
---|---|
Market Size in 2023 | USD 3.25 Billion |
Market Size by 2032 | USD 23.01 Billion |
CAGR | CAGR of 24.36% From 2024 to 2032 |
Base Year | 2023 |
Forecast Period | 2024-2032 |
Historical Data | 2020-2022 |
Report Scope & Coverage | Market Size, Segments Analysis, Competitive Landscape, Regional Analysis, DROC & SWOT Analysis, Forecast Outlook |
Key Segments | • By Technology (Machine Learning, Natural Language Processing (NLP), Others) • By Deployment Mode (On-Premises, Cloud) • By Application (Portfolio Optimization, Conversational Platform, Risk & Compliance, Data Analysis, Process Automation, Others) |
Regional Analysis/Coverage | North America (US, Canada, Mexico), Europe (Eastern Europe [Poland, Romania, Hungary, Turkey, Rest of Eastern Europe] Western Europe] Germany, France, UK, Italy, Spain, Netherlands, Switzerland, Austria, Rest of Western Europe]), Asia Pacific (China, India, Japan, South Korea, Vietnam, Singapore, Australia, Rest of Asia Pacific), Middle East & Africa (Middle East [UAE, Egypt, Saudi Arabia, Qatar, Rest of Middle East], Africa [Nigeria, South Africa, Rest of Africa], Latin America (Brazil, Argentina, Colombia, Rest of Latin America) |
Company Profiles | Amazon Web Services, Inc., BlackRock, Inc., CapitalG, Charles Schwab & Co., Inc., Genpact, Infosys Limited, International Business Machines Corporation, IPsoft Inc., Lexalytics, Microsoft, TABLEAU SOFTWARE, LLC, Next IT Corp., S&P Global, Salesforce, Inc., FIS, ION Group, Synechron, SAP SE, HighRadius, Axyon AI, Upstart, Capgemini SE, BayCurrent Inc., MGX Fund Management Limited |
ANS: AI In Asset Management Market was valued at USD 3.25 billion in 2023 and is expected to reach USD 23.01 billion by 2032, growing at a CAGR of 24.36% from 2024-2032.
ANS: The On-Premises segment dominated with a 57% revenue share.
ANS: The Cloud segment is expected to grow at a CAGR of 25.96% from 2024 to 2032.
ANS: The Process Automation segment held the highest revenue share at 29%.
ANS: Asia Pacific is expected to grow at a CAGR of 27.11% from 2024 to 2032.
Table of Contents:
1. Introduction
1.1 Market Definition
1.2 Scope (Inclusion and Exclusions)
1.3 Research Assumptions
2. Executive Summary
2.1 Market Overview
2.2 Regional Synopsis
2.3 Competitive Summary
3. Research Methodology
3.1 Top-Down Approach
3.2 Bottom-up Approach
3.3. Data Validation
3.4 Primary Interviews
4. Market Dynamics Impact Analysis
4.1 Market Driving Factors Analysis
4.1.1 Drivers
4.1.2 Restraints
4.1.3 Opportunities
4.1.4 Challenges
4.2 PESTLE Analysis
4.3 Porter’s Five Forces Model
5. Statistical Insights and Trends Reporting
5.1 Adoption Rate
5.2 Investment & Funding Trends
5.3 Cost-Benefit Analysis
5.4 Regulatory & Compliance Trends
5.5 Customer Sentiment Analysis
6. Competitive Landscape
6.1 List of Major Companies, By Region
6.2 Market Share Analysis, By Region
6.3 Product Benchmarking
6.3.1 Product specifications and features
6.3.2 Pricing
6.4 Strategic Initiatives
6.4.1 Marketing and promotional activities
6.4.2 Distribution and supply chain strategies
6.4.3 Expansion plans and new product launches
6.4.4 Strategic partnerships and collaborations
6.5 Technological Advancements
6.6 Market Positioning and Branding
7. AI In Asset Management Market Segmentation, By Technology
7.1 Chapter Overview
7.2 Machine Learning
7.2.1 Machine Learning Market Trends Analysis (2020-2032)
7.2.2 Machine Learning Market Size Estimates and Forecasts to 2032 (USD Billion)
7.3 Natural Language Processing (NLP)
7.3.1 Natural Language Processing (NLP) Market Trends Analysis (2020-2032)
7.3.2 Natural Language Processing (NLP) Market Size Estimates and Forecasts to 2032 (USD Billion)
7.4 Others
7.4.1 Others Market Trends Analysis (2020-2032)
7.4.2 Others Market Size Estimates and Forecasts to 2032 (USD Billion)
8. AI In Asset Management Market Segmentation, By Deployment Mode
8.1 Chapter Overview
8.2 On-Premises
8.2.1 On-Premises Market Trends Analysis (2020-2032)
8.2.2 On-Premises Market Size Estimates and Forecasts to 2032 (USD Billion)
8.3 Cloud
8.3.1 Cloud Market Trends Analysis (2020-2032)
8.3.2 Cloud Market Size Estimates and Forecasts to 2032 (USD Billion)
9. AI In Asset Management Market Segmentation, By Application
9.1 Chapter Overview
9.2 Portfolio Optimization
9.2.1 Portfolio Optimization Market Trends Analysis (2020-2032)
9.2.2 Portfolio Optimization Market Size Estimates and Forecasts to 2032 (USD Billion)
9.3 Conversational Platform
9.3.1 Conversational Platform Market Trends Analysis (2020-2032)
9.3.2 Conversational Platform Market Size Estimates and Forecasts to 2032 (USD Billion)
9.4 Risk & Compliance
9.4.1 Risk & Compliance Market Trends Analysis (2020-2032)
9.4.2 Risk & Compliance Market Size Estimates and Forecasts to 2032 (USD Billion)
9.5 Data Analysis
9.5.1 Data Analysis Market Trends Analysis (2020-2032)
9.5.2 Data Analysis Market Size Estimates and Forecasts to 2032 (USD Billion)
9.6 Process Automation
9.6.1 Process Automation Market Trends Analysis (2020-2032)
9.6.2 Process Automation Market Size Estimates and Forecasts to 2032 (USD Billion)
9.7 Others
9.7.1 Others Market Trends Analysis (2020-2032)
9.7.2 Others Market Size Estimates and Forecasts to 2032 (USD Billion)
10. Regional Analysis
10.1 Chapter Overview
10.2 North America
10.2.1 Trends Analysis
10.2.2 North America AI In Asset Management Market Estimates and Forecasts, by Country (2020-2032) (USD Billion)
10.2.3 North America AI In Asset Management Market Estimates and Forecasts, By Technology (2020-2032) (USD Billion)
10.2.4 North America AI In Asset Management Market Estimates and Forecasts, By Deployment Mode (2020-2032) (USD Billion)
10.2.5 North America AI In Asset Management Market Estimates and Forecasts, By Application (2020-2032) (USD Billion)
10.2.6 USA
10.2.6.1 USA AI In Asset Management Market Estimates and Forecasts, By Technology (2020-2032) (USD Billion)
10.2.6.2 USA AI In Asset Management Market Estimates and Forecasts, By Deployment Mode (2020-2032) (USD Billion)
10.2.6.3 USA AI In Asset Management Market Estimates and Forecasts, By Application (2020-2032) (USD Billion)
10.2.7 Canada
10.2.7.1 Canada AI In Asset Management Market Estimates and Forecasts, By Technology (2020-2032) (USD Billion)
10.2.7.2 Canada AI In Asset Management Market Estimates and Forecasts, By Deployment Mode (2020-2032) (USD Billion)
10.2.7.3 Canada AI In Asset Management Market Estimates and Forecasts, By Application (2020-2032) (USD Billion)
10.2.8 Mexico
10.2.8.1 Mexico AI In Asset Management Market Estimates and Forecasts, By Technology (2020-2032) (USD Billion)
10.2.8.2 Mexico AI In Asset Management Market Estimates and Forecasts, By Deployment Mode (2020-2032) (USD Billion)
10.2.8.3 Mexico AI In Asset Management Market Estimates and Forecasts, By Application (2020-2032) (USD Billion)
10.3 Europe
10.3.1 Eastern Europe
10.3.1.1 Trends Analysis
10.3.1.2 Eastern Europe AI In Asset Management Market Estimates and Forecasts, by Country (2020-2032) (USD Billion)
10.3.1.3 Eastern Europe AI In Asset Management Market Estimates and Forecasts, By Technology (2020-2032) (USD Billion)
10.3.1.4 Eastern Europe AI In Asset Management Market Estimates and Forecasts, By Deployment Mode (2020-2032) (USD Billion)
10.3.1.5 Eastern Europe AI In Asset Management Market Estimates and Forecasts, By Application (2020-2032) (USD Billion)
10.3.1.6 Poland
10.3.1.6.1 Poland AI In Asset Management Market Estimates and Forecasts, By Technology (2020-2032) (USD Billion)
10.3.1.6.2 Poland AI In Asset Management Market Estimates and Forecasts, By Deployment Mode (2020-2032) (USD Billion)
10.3.1.6.3 Poland AI In Asset Management Market Estimates and Forecasts, By Application (2020-2032) (USD Billion)
10.3.1.7 Romania
10.3.1.7.1 Romania AI In Asset Management Market Estimates and Forecasts, By Technology (2020-2032) (USD Billion)
10.3.1.7.2 Romania AI In Asset Management Market Estimates and Forecasts, By Deployment Mode (2020-2032) (USD Billion)
10.3.1.7.3 Romania AI In Asset Management Market Estimates and Forecasts, By Application (2020-2032) (USD Billion)
10.3.1.8 Hungary
10.3.1.8.1 Hungary AI In Asset Management Market Estimates and Forecasts, By Technology (2020-2032) (USD Billion)
10.3.1.8.2 Hungary AI In Asset Management Market Estimates and Forecasts, By Deployment Mode (2020-2032) (USD Billion)
10.3.1.8.3 Hungary AI In Asset Management Market Estimates and Forecasts, By Application (2020-2032) (USD Billion)
10.3.1.9 Turkey
10.3.1.9.1 Turkey AI In Asset Management Market Estimates and Forecasts, By Technology (2020-2032) (USD Billion)
10.3.1.9.2 Turkey AI In Asset Management Market Estimates and Forecasts, By Deployment Mode (2020-2032) (USD Billion)
10.3.1.9.3 Turkey AI In Asset Management Market Estimates and Forecasts, By Application (2020-2032) (USD Billion)
10.3.1.10 Rest of Eastern Europe
10.3.1.10.1 Rest of Eastern Europe AI In Asset Management Market Estimates and Forecasts, By Technology (2020-2032) (USD Billion)
10.3.1.10.2 Rest of Eastern Europe AI In Asset Management Market Estimates and Forecasts, By Deployment Mode (2020-2032) (USD Billion)
10.3.1.10.3 Rest of Eastern Europe AI In Asset Management Market Estimates and Forecasts, By Application (2020-2032) (USD Billion)
10.3.2 Western Europe
10.3.2.1 Trends Analysis
10.3.2.2 Western Europe AI In Asset Management Market Estimates and Forecasts, by Country (2020-2032) (USD Billion)
10.3.2.3 Western Europe AI In Asset Management Market Estimates and Forecasts, By Technology (2020-2032) (USD Billion)
10.3.2.4 Western Europe AI In Asset Management Market Estimates and Forecasts, By Deployment Mode (2020-2032) (USD Billion)
10.3.2.5 Western Europe AI In Asset Management Market Estimates and Forecasts, By Application (2020-2032) (USD Billion)
10.3.2.6 Germany
10.3.2.6.1 Germany AI In Asset Management Market Estimates and Forecasts, By Technology (2020-2032) (USD Billion)
10.3.2.6.2 Germany AI In Asset Management Market Estimates and Forecasts, By Deployment Mode (2020-2032) (USD Billion)
10.3.2.6.3 Germany AI In Asset Management Market Estimates and Forecasts, By Application (2020-2032) (USD Billion)
10.3.2.7 France
10.3.2.7.1 France AI In Asset Management Market Estimates and Forecasts, By Technology (2020-2032) (USD Billion)
10.3.2.7.2 France AI In Asset Management Market Estimates and Forecasts, By Deployment Mode (2020-2032) (USD Billion)
10.3.2.7.3 France AI In Asset Management Market Estimates and Forecasts, By Application (2020-2032) (USD Billion)
10.3.2.8 UK
10.3.2.8.1 UK AI In Asset Management Market Estimates and Forecasts, By Technology (2020-2032) (USD Billion)
10.3.2.8.2 UK AI In Asset Management Market Estimates and Forecasts, By Deployment Mode (2020-2032) (USD Billion)
10.3.2.8.3 UK AI In Asset Management Market Estimates and Forecasts, By Application (2020-2032) (USD Billion)
10.3.2.9 Italy
10.3.2.9.1 Italy AI In Asset Management Market Estimates and Forecasts, By Technology (2020-2032) (USD Billion)
10.3.2.9.2 Italy AI In Asset Management Market Estimates and Forecasts, By Deployment Mode (2020-2032) (USD Billion)
10.3.2.9.3 Italy AI In Asset Management Market Estimates and Forecasts, By Application (2020-2032) (USD Billion)
10.3.2.10 Spain
10.3.2.10.1 Spain AI In Asset Management Market Estimates and Forecasts, By Technology (2020-2032) (USD Billion)
10.3.2.10.2 Spain AI In Asset Management Market Estimates and Forecasts, By Deployment Mode (2020-2032) (USD Billion)
10.3.2.10.3 Spain AI In Asset Management Market Estimates and Forecasts, By Application (2020-2032) (USD Billion)
10.3.2.11 Netherlands
10.3.2.11.1 Netherlands AI In Asset Management Market Estimates and Forecasts, By Technology (2020-2032) (USD Billion)
10.3.2.11.2 Netherlands AI In Asset Management Market Estimates and Forecasts, By Deployment Mode (2020-2032) (USD Billion)
10.3.2.11.3 Netherlands AI In Asset Management Market Estimates and Forecasts, By Application (2020-2032) (USD Billion)
10.3.2.12 Switzerland
10.3.2.12.1 Switzerland AI In Asset Management Market Estimates and Forecasts, By Technology (2020-2032) (USD Billion)
10.3.2.12.2 Switzerland AI In Asset Management Market Estimates and Forecasts, By Deployment Mode (2020-2032) (USD Billion)
10.3.2.12.3 Switzerland AI In Asset Management Market Estimates and Forecasts, By Application (2020-2032) (USD Billion)
10.3.2.13 Austria
10.3.2.13.1 Austria AI In Asset Management Market Estimates and Forecasts, By Technology (2020-2032) (USD Billion)
10.3.2.13.2 Austria AI In Asset Management Market Estimates and Forecasts, By Deployment Mode (2020-2032) (USD Billion)
10.3.2.13.3 Austria AI In Asset Management Market Estimates and Forecasts, By Application (2020-2032) (USD Billion)
10.3.2.14 Rest of Western Europe
10.3.2.14.1 Rest of Western Europe AI In Asset Management Market Estimates and Forecasts, By Technology (2020-2032) (USD Billion)
10.3.2.14.2 Rest of Western Europe AI In Asset Management Market Estimates and Forecasts, By Deployment Mode (2020-2032) (USD Billion)
10.3.2.14.3 Rest of Western Europe AI In Asset Management Market Estimates and Forecasts, By Application (2020-2032) (USD Billion)
10.4 Asia Pacific
10.4.1 Trends Analysis
10.4.2 Asia Pacific AI In Asset Management Market Estimates and Forecasts, by Country (2020-2032) (USD Billion)
10.4.3 Asia Pacific AI In Asset Management Market Estimates and Forecasts, By Technology (2020-2032) (USD Billion)
10.4.4 Asia Pacific AI In Asset Management Market Estimates and Forecasts, By Deployment Mode (2020-2032) (USD Billion)
10.4.5 Asia Pacific AI In Asset Management Market Estimates and Forecasts, By Application (2020-2032) (USD Billion)
10.4.6 China
10.4.6.1 China AI In Asset Management Market Estimates and Forecasts, By Technology (2020-2032) (USD Billion)
10.4.6.2 China AI In Asset Management Market Estimates and Forecasts, By Deployment Mode (2020-2032) (USD Billion)
10.4.6.3 China AI In Asset Management Market Estimates and Forecasts, By Application (2020-2032) (USD Billion)
10.4.7 India
10.4.7.1 India AI In Asset Management Market Estimates and Forecasts, By Technology (2020-2032) (USD Billion)
10.4.7.2 India AI In Asset Management Market Estimates and Forecasts, By Deployment Mode (2020-2032) (USD Billion)
10.4.7.3 India AI In Asset Management Market Estimates and Forecasts, By Application (2020-2032) (USD Billion)
10.4.8 Japan
10.4.8.1 Japan AI In Asset Management Market Estimates and Forecasts, By Technology (2020-2032) (USD Billion)
10.4.8.2 Japan AI In Asset Management Market Estimates and Forecasts, By Deployment Mode (2020-2032) (USD Billion)
10.4.8.3 Japan AI In Asset Management Market Estimates and Forecasts, By Application (2020-2032) (USD Billion)
10.4.9 South Korea
10.4.9.1 South Korea AI In Asset Management Market Estimates and Forecasts, By Technology (2020-2032) (USD Billion)
10.4.9.2 South Korea AI In Asset Management Market Estimates and Forecasts, By Deployment Mode (2020-2032) (USD Billion)
10.4.9.3 South Korea AI In Asset Management Market Estimates and Forecasts, By Application (2020-2032) (USD Billion)
10.4.10 Vietnam
10.4.10.1 Vietnam AI In Asset Management Market Estimates and Forecasts, By Technology (2020-2032) (USD Billion)
10.4.10.2 Vietnam AI In Asset Management Market Estimates and Forecasts, By Deployment Mode (2020-2032) (USD Billion)
10.4.10.3 Vietnam AI In Asset Management Market Estimates and Forecasts, By Application (2020-2032) (USD Billion)
10.4.11 Singapore
10.4.11.1 Singapore AI In Asset Management Market Estimates and Forecasts, By Technology (2020-2032) (USD Billion)
10.4.11.2 Singapore AI In Asset Management Market Estimates and Forecasts, By Deployment Mode (2020-2032) (USD Billion)
10.4.11.3 Singapore AI In Asset Management Market Estimates and Forecasts, By Application (2020-2032) (USD Billion)
10.4.12 Australia
10.4.12.1 Australia AI In Asset Management Market Estimates and Forecasts, By Technology (2020-2032) (USD Billion)
10.4.12.2 Australia AI In Asset Management Market Estimates and Forecasts, By Deployment Mode (2020-2032) (USD Billion)
10.4.12.3 Australia AI In Asset Management Market Estimates and Forecasts, By Application (2020-2032) (USD Billion)
10.4.13 Rest of Asia Pacific
10.4.13.1 Rest of Asia Pacific AI In Asset Management Market Estimates and Forecasts, By Technology (2020-2032) (USD Billion)
10.4.13.2 Rest of Asia Pacific AI In Asset Management Market Estimates and Forecasts, By Deployment Mode (2020-2032) (USD Billion)
10.4.13.3 Rest of Asia Pacific AI In Asset Management Market Estimates and Forecasts, By Application (2020-2032) (USD Billion)
10.5 Middle East and Africa
10.5.1 Middle East
10.5.1.1 Trends Analysis
10.5.1.2 Middle East AI In Asset Management Market Estimates and Forecasts, by Country (2020-2032) (USD Billion)
10.5.1.3 Middle East AI In Asset Management Market Estimates and Forecasts, By Technology (2020-2032) (USD Billion)
10.5.1.4 Middle East AI In Asset Management Market Estimates and Forecasts, By Deployment Mode (2020-2032) (USD Billion)
10.5.1.5 Middle East AI In Asset Management Market Estimates and Forecasts, By Application (2020-2032) (USD Billion)
10.5.1.6 UAE
10.5.1.6.1 UAE AI In Asset Management Market Estimates and Forecasts, By Technology (2020-2032) (USD Billion)
10.5.1.6.2 UAE AI In Asset Management Market Estimates and Forecasts, By Deployment Mode (2020-2032) (USD Billion)
10.5.1.6.3 UAE AI In Asset Management Market Estimates and Forecasts, By Application (2020-2032) (USD Billion)
10.5.1.7 Egypt
10.5.1.7.1 Egypt AI In Asset Management Market Estimates and Forecasts, By Technology (2020-2032) (USD Billion)
10.5.1.7.2 Egypt AI In Asset Management Market Estimates and Forecasts, By Deployment Mode (2020-2032) (USD Billion)
10.5.1.7.3 Egypt AI In Asset Management Market Estimates and Forecasts, By Application (2020-2032) (USD Billion)
10.5.1.8 Saudi Arabia
10.5.1.8.1 Saudi Arabia AI In Asset Management Market Estimates and Forecasts, By Technology (2020-2032) (USD Billion)
10.5.1.8.2 Saudi Arabia AI In Asset Management Market Estimates and Forecasts, By Deployment Mode (2020-2032) (USD Billion)
10.5.1.8.3 Saudi Arabia AI In Asset Management Market Estimates and Forecasts, By Application (2020-2032) (USD Billion)
10.5.1.9 Qatar
10.5.1.9.1 Qatar AI In Asset Management Market Estimates and Forecasts, By Technology (2020-2032) (USD Billion)
10.5.1.9.2 Qatar AI In Asset Management Market Estimates and Forecasts, By Deployment Mode (2020-2032) (USD Billion)
10.5.1.9.3 Qatar AI In Asset Management Market Estimates and Forecasts, By Application (2020-2032) (USD Billion)
10.5.1.10 Rest of Middle East
10.5.1.10.1 Rest of Middle East AI In Asset Management Market Estimates and Forecasts, By Technology (2020-2032) (USD Billion)
10.5.1.10.2 Rest of Middle East AI In Asset Management Market Estimates and Forecasts, By Deployment Mode (2020-2032) (USD Billion)
10.5.1.10.3 Rest of Middle East AI In Asset Management Market Estimates and Forecasts, By Application (2020-2032) (USD Billion)
10.5.2 Africa
10.5.2.1 Trends Analysis
10.5.2.2 Africa AI In Asset Management Market Estimates and Forecasts, by Country (2020-2032) (USD Billion)
10.5.2.3 Africa AI In Asset Management Market Estimates and Forecasts, By Technology (2020-2032) (USD Billion)
10.5.2.4 Africa AI In Asset Management Market Estimates and Forecasts, By Deployment Mode (2020-2032) (USD Billion)
10.5.2.5 Africa AI In Asset Management Market Estimates and Forecasts, By Application (2020-2032) (USD Billion)
10.5.2.6 South Africa
10.5.2.6.1 South Africa AI In Asset Management Market Estimates and Forecasts, By Technology (2020-2032) (USD Billion)
10.5.2.6.2 South Africa AI In Asset Management Market Estimates and Forecasts, By Deployment Mode (2020-2032) (USD Billion)
10.5.2.6.3 South Africa AI In Asset Management Market Estimates and Forecasts, By Application (2020-2032) (USD Billion)
10.5.2.7 Nigeria
10.5.2.7.1 Nigeria AI In Asset Management Market Estimates and Forecasts, By Technology (2020-2032) (USD Billion)
10.5.2.7.2 Nigeria AI In Asset Management Market Estimates and Forecasts, By Deployment Mode (2020-2032) (USD Billion)
10.5.2.7.3 Nigeria AI In Asset Management Market Estimates and Forecasts, By Application (2020-2032) (USD Billion)
10.5.2.8 Rest of Africa
10.5.2.8.1 Rest of Africa AI In Asset Management Market Estimates and Forecasts, By Technology (2020-2032) (USD Billion)
10.5.2.8.2 Rest of Africa AI In Asset Management Market Estimates and Forecasts, By Deployment Mode (2020-2032) (USD Billion)
10.5.2.8.3 Rest of Africa AI In Asset Management Market Estimates and Forecasts, By Application (2020-2032) (USD Billion)
10.6 Latin America
10.6.1 Trends Analysis
10.6.2 Latin America AI In Asset Management Market Estimates and Forecasts, by Country (2020-2032) (USD Billion)
10.6.3 Latin America AI In Asset Management Market Estimates and Forecasts, By Technology (2020-2032) (USD Billion)
10.6.4 Latin America AI In Asset Management Market Estimates and Forecasts, By Deployment Mode (2020-2032) (USD Billion)
10.6.5 Latin America AI In Asset Management Market Estimates and Forecasts, By Application (2020-2032) (USD Billion)
10.6.6 Brazil
10.6.6.1 Brazil AI In Asset Management Market Estimates and Forecasts, By Technology (2020-2032) (USD Billion)
10.6.6.2 Brazil AI In Asset Management Market Estimates and Forecasts, By Deployment Mode (2020-2032) (USD Billion)
10.6.6.3 Brazil AI In Asset Management Market Estimates and Forecasts, By Application (2020-2032) (USD Billion)
10.6.7 Argentina
10.6.7.1 Argentina AI In Asset Management Market Estimates and Forecasts, By Technology (2020-2032) (USD Billion)
10.6.7.2 Argentina AI In Asset Management Market Estimates and Forecasts, By Deployment Mode (2020-2032) (USD Billion)
10.6.7.3 Argentina AI In Asset Management Market Estimates and Forecasts, By Application (2020-2032) (USD Billion)
10.6.8 Colombia
10.6.8.1 Colombia AI In Asset Management Market Estimates and Forecasts, By Technology (2020-2032) (USD Billion)
10.6.8.2 Colombia AI In Asset Management Market Estimates and Forecasts, By Deployment Mode (2020-2032) (USD Billion)
10.6.8.3 Colombia AI In Asset Management Market Estimates and Forecasts, By Application (2020-2032) (USD Billion)
10.6.9 Rest of Latin America
10.6.9.1 Rest of Latin America AI In Asset Management Market Estimates and Forecasts, By Technology (2020-2032) (USD Billion)
10.6.9.2 Rest of Latin America AI In Asset Management Market Estimates and Forecasts, By Deployment Mode (2020-2032) (USD Billion)
10.6.9.3 Rest of Latin America AI In Asset Management Market Estimates and Forecasts, By Application (2020-2032) (USD Billion)
11. Company Profiles
11.1 Amazon Web Services, Inc.
11.1.1 Company Overview
11.1.2 Financial
11.1.3 Products/ Services Offered
11.1.4 SWOT Analysis
11.2 BlackRock, Inc.
11.2.1 Company Overview
11.2.2 Financial
11.2.3 Products/ Services Offered
11.2.4 SWOT Analysis
11.3 CapitalG
11.3.1 Company Overview
11.3.2 Financial
11.3.3 Products/ Services Offered
11.3.4 SWOT Analysis
11.4 Charles Schwab & Co., Inc.
11.4.1 Company Overview
11.4.2 Financial
11.4.3 Products/ Services Offered
11.4.4 SWOT Analysis
11.5 Genpact
11.5.1 Company Overview
11.5.2 Financial
11.5.3 Products/ Services Offered
11.5.4 SWOT Analysis
11.6 Infosys Limited
11.6.1 Company Overview
11.6.2 Financial
11.6.3 Products/ Services Offered
11.6.4 SWOT Analysis
11.7 International Business Machines Corporation
11.7.1 Company Overview
11.7.2 Financial
11.7.3 Products/ Services Offered
11.7.4 SWOT Analysis
11.8 IPsoft Inc.
11.8.1 Company Overview
11.8.2 Financial
11.8.3 Products/ Services Offered
11.8.4 SWOT Analysis
11.9 Lexalytics
11.9.1 Company Overview
11.9.2 Financial
11.9.3 Products/ Services Offered
11.9.4 SWOT Analysis
11.10 Microsoft
11.10.1 Company Overview
11.10.2 Financial
11.10.3 Products/ Services Offered
11.10.4 SWOT Analysis
12. Use Cases and Best Practices
13. Conclusion
An accurate research report requires proper strategizing as well as implementation. There are multiple factors involved in the completion of good and accurate research report and selecting the best methodology to compete the research is the toughest part. Since the research reports we provide play a crucial role in any company’s decision-making process, therefore we at SNS Insider always believe that we should choose the best method which gives us results closer to reality. This allows us to reach at a stage wherein we can provide our clients best and accurate investment to output ratio.
Each report that we prepare takes a timeframe of 350-400 business hours for production. Starting from the selection of titles through a couple of in-depth brain storming session to the final QC process before uploading our titles on our website we dedicate around 350 working hours. The titles are selected based on their current market cap and the foreseen CAGR and growth.
The 5 steps process:
Step 1: Secondary Research:
Secondary Research or Desk Research is as the name suggests is a research process wherein, we collect data through the readily available information. In this process we use various paid and unpaid databases which our team has access to and gather data through the same. This includes examining of listed companies’ annual reports, Journals, SEC filling etc. Apart from this our team has access to various associations across the globe across different industries. Lastly, we have exchange relationships with various university as well as individual libraries.
Step 2: Primary Research
When we talk about primary research, it is a type of study in which the researchers collect relevant data samples directly, rather than relying on previously collected data. This type of research is focused on gaining content specific facts that can be sued to solve specific problems. Since the collected data is fresh and first hand therefore it makes the study more accurate and genuine.
We at SNS Insider have divided Primary Research into 2 parts.
Part 1 wherein we interview the KOLs of major players as well as the upcoming ones across various geographic regions. This allows us to have their view over the market scenario and acts as an important tool to come closer to the accurate market numbers. As many as 45 paid and unpaid primary interviews are taken from both the demand and supply side of the industry to make sure we land at an accurate judgement and analysis of the market.
This step involves the triangulation of data wherein our team analyses the interview transcripts, online survey responses and observation of on filed participants. The below mentioned chart should give a better understanding of the part 1 of the primary interview.
Part 2: In this part of primary research the data collected via secondary research and the part 1 of the primary research is validated with the interviews from individual consultants and subject matter experts.
Consultants are those set of people who have at least 12 years of experience and expertise within the industry whereas Subject Matter Experts are those with at least 15 years of experience behind their back within the same space. The data with the help of two main processes i.e., FGDs (Focused Group Discussions) and IDs (Individual Discussions). This gives us a 3rd party nonbiased primary view of the market scenario making it a more dependable one while collation of the data pointers.
Step 3: Data Bank Validation
Once all the information is collected via primary and secondary sources, we run that information for data validation. At our intelligence centre our research heads track a lot of information related to the market which includes the quarterly reports, the daily stock prices, and other relevant information. Our data bank server gets updated every fortnight and that is how the information which we collected using our primary and secondary information is revalidated in real time.
Step 4: QA/QC Process
After all the data collection and validation our team does a final level of quality check and quality assurance to get rid of any unwanted or undesired mistakes. This might include but not limited to getting rid of the any typos, duplication of numbers or missing of any important information. The people involved in this process include technical content writers, research heads and graphics people. Once this process is completed the title gets uploader on our platform for our clients to read it.
Step 5: Final QC/QA Process:
This is the last process and comes when the client has ordered the study. In this process a final QA/QC is done before the study is emailed to the client. Since we believe in giving our clients a good experience of our research studies, therefore, to make sure that we do not lack at our end in any way humanly possible we do a final round of quality check and then dispatch the study to the client.
Key Segments:
By Technology
Machine Learning
Natural Language Processing (NLP)
Others
By Deployment Mode
On-Premises
Cloud
By Application
Portfolio Optimization
Conversational Platform
Risk & Compliance
Data Analysis
Process Automation
Others
Request for Segment Customization as per your Business Requirement: Segment Customization Request
Regional Coverage:
North America
US
Canada
Mexico
Europe
Eastern Europe
Poland
Romania
Hungary
Turkey
Rest of Eastern Europe
Western Europe
Germany
France
UK
Italy
Spain
Netherlands
Switzerland
Austria
Rest of Western Europe
Asia Pacific
China
India
Japan
South Korea
Vietnam
Singapore
Australia
Rest of Asia Pacific
Middle East & Africa
Middle East
UAE
Egypt
Saudi Arabia
Qatar
Rest of Middle East
Africa
Nigeria
South Africa
Rest of Africa
Latin America
Brazil
Argentina
Colombia
Rest of Latin America
Request for Country Level Research Report: Country Level Customization Request
Available Customization
With the given market data, SNS Insider offers customization as per the company’s specific needs. The following customization options are available for the report:
Detailed Volume Analysis
Criss-Cross segment analysis (e.g. Product X Application)
Competitive Product Benchmarking
Geographic Analysis
Additional countries in any of the regions
Customized Data Representation
Detailed analysis and profiling of additional market players
5G Tester Market was valued at USD 3.45 billion in 2023 and is expected to reach USD 7.05 billion by 2032, growing at a CAGR of 8.29% from 2024-2032.
The Web Performance Market was valued at USD 5.86 billion in 2023 and is projected to reach USD 12.70 billion by 2032, growing at a CAGR of 9.04% by 2032
The Cloud Mobile Backend-As-A-Service (BaaS) Market Size was valued at USD 4.25 Billion in 2023 and is expected to reach USD 18.52 Billion by 2032 and grow at a CAGR of 17.79% over the forecast period 2024-2032.
The Farm Management Software Market was valued at USD 3.0 billion in 2023 and is expected to reach USD 12.8 billion by 2032, growing at a CAGR of 17.74% from 2024-2032.
Location-Based Entertainment Market Size was USD 4.0 Billion in 2023 & is expected to reach USD 31.1 Billion by 2032 growing at a CAGR of 25.6% by 2024-2032.
The Enterprise VSAT System Market was valued at USD 6.02 billion in 2023 and is expected to reach USD 11.32 billion by 2032, growing at a CAGR of 7.29% over the forecast period 2024-2032.
Hi! Click one of our member below to chat on Phone