image

AI Image Generator Market Report Scope & Overview:
AI Image Generator Market, Revenue Analysis

Get More Information on AI Image Generator Market - Request Sample Report

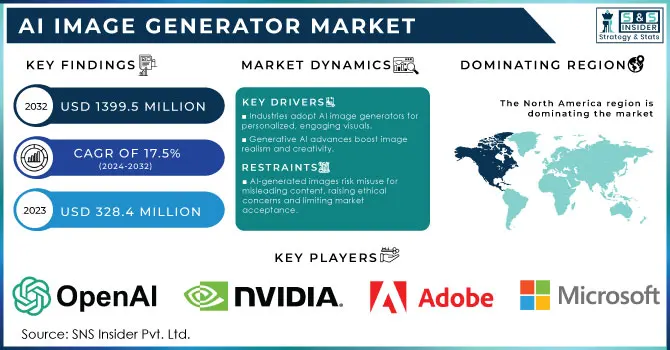
The AI Image Generator Market size was valued at USD 328.4 Million in 2023 and is expected to grow to USD 1399.5 Million by 2032 and grow at a CAGR of 17.5% over the forecast period of 2024-2032.

Advancements in artificial intelligence, computer vision, and deep learning are driving the AI Image Generator Market, which is experiencing significant growth. Governments globally recognize the potential of AI technology in creative industries, which has spurred public investment and innovation in the field. Governments globally recognize the potential of AI technology in creative industries, which has spurred public investment and innovation in the field. In the United States, the Department of Commerce reported a 12% year-over-year growth in creative AI technology adoption, largely propelled by increasing demand across media, marketing, and entertainment industries. AI funding trend (EU) In 2023, the European Union (EU) allocated €1 billion worth of funding to promote AI development with a focus on its ethical and transparent use. China, which leads the world in AI technology with its “New Generation AI Development Plan,” has also emphasized this area, investing more than $2 billion in research and development into applications such as AI-generated images to take a leading position in that market. The recent support from the government also emphasizes an international trend toward promoting AI development, pushing the market for AI image generators.

Demand for virtual try-on tools and customized visual content has increased due to the growth of e-commerce. Image generators are essential for virtual try-ons in fashion, accessories, and cosmetics, allowing customers to see how items would appear on them. These tools further enhance customer engagement and conversion rates by providing personalized experiences with interactive features. According to Everypixel, 15.5 billion images were generated by August 2023 with 34 million new ones each day. Further, an OpenAI report from August 2023 pointed out that platforms such as DALL-E and ChatGPT had more than 3 million active users, cranking out over 4 million images each day. The soaring interest towards NFTs has brought about a demand for unique digital artwork, and AI Art as an accepted form of creativity.

AI Image Generator Market Dynamics

Drivers

  • Industries like marketing, entertainment, and e-commerce are leveraging AI-generated images for personalization and engagement. Visual content drives higher engagement, leading companies to adopt AI image generators for scalable, customizable visuals.

  • Breakthroughs in generative models, such as DALL-E and Stable Diffusion, improve image realism and quality. Enhanced computational power and availability of large datasets are driving the accuracy and creativity of AI-generated images.

  • AI image generators are enabling new forms of digital art, supporting artists with tools that enhance creativity and streamline workflows. AI-generated content is gaining acceptance in mainstream media, online platforms, and creative projects.

The generative AI model is a major driver of the AI image generator market and has seen the advent of some very sophisticated algorithms including DALL-E, Midjourney, and Stable Diffusion that make images more realistic. Recent advances in machine learning and neural networks, particularly in the area of transformer-based models, have enabled AI to produce hyper-realistic images that emulate human-crafted artwork. In 2023, for instance, OpenAI released its DALL-E 3, which generated further improvement in producing complex images from text-based descriptions and setting new standards for AI creativity and coherence.

These advancements are fueled by the availability of powerful computational resources, such as GPUs and cloud-based processing, which can handle the heavy workload required to train large datasets. This advanced computational power with massive datasets results in models that can create everything from artistic-quality images to photorealistic scenes. As generative AI has quickly developed, NVIDIA has pushed innovations such as the DGX GH200 designed to drive intensive processing and enable faster and more efficient training and refinement of complex models. from Adobe Firefly generating more than a billion assets within a couple of months in 2023 to quicker adoption of generative AI tools overall. The interest span continues beyond media houses and into sectors such as advertising, gaming, and digital design where AI-generated visuals are extending practices to personalize content for audiences while enabling scaling creativity or drastically reducing time-to-market for visual assets.

Restraints

  • Concerns over the ownership of AI-generated images challenge market adoption due to the legal ambiguity of content rights. Copyright disputes may arise when models are trained on existing copyrighted images without permission.

  • AI-generated images can be misused to create misleading or harmful content, raising ethical concerns. The spread of deepfakes and manipulated visuals creates distrust, limiting acceptance and regulation in the market.

One significant restraint in the AI image generator market is the issue of intellectual property (IP) and copyright concerns. AI-generated images often draw on vast datasets that may include copyrighted materials, creating complex ownership challenges. This raises questions about ownership of the resulting AI-generated content if an AI model is trained on existing art or imagery without express permission. This gray area can deter businesses and artists from using AI tools, as the potential for legal disputes creates uncertainty around intellectual property ownership. Moreover, creators might feel that their original work is devalued or exploited without appropriate compensation. IP issues remain legal and ethical barriers as regulations continue to lag behind technology. All AI image generators will need clear guidelines on where to get data from, how open the training of models is, and which copyright attribution should be enforced if any, to become more widely trusted in different industries.

AI Image Generator Market Segmentation Overview

By Component

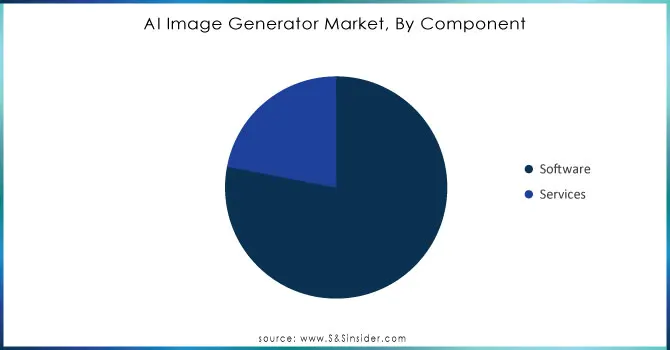
The software segment was the leader, accounting for a 78% share of revenue in 2023. The prevalence of software solutions shows a market that prioritizes accessible, fast AI image-generation options. The adoption rate has also been driven by government initiatives such as the establishment of standards for AI software development by NIST (U.S. National Institute of Standards and Technology). This segment will also rise due to an increasing need for high-quality image-generation software in marketing, gaming, and advertisement.

The services component which includes consulting, integration, and support is growing at a rapid pace as businesses discover that they are more dependent than ever upon expert guidance and customization. Services cater to organizations seeking to integrate image generation software into their operations seamlessly, which is critical as industries become increasingly reliant on specialized AI applications. The rapid growth of the AI services segment has been further driven by the recent policy changes made by governments across regions, specifically EU and China.
AI-Image-Generator-Market-By-Component.

Need Any Customization Research On AI Image Generator Market - Inquiry Now

By End-User

Media & Entertainment sector dominated artificial intelligence image generator market with a 45% revenue share in the year 2023. This dominance stems from the sector’s rapid adoption of AI for content creation, visual effects, and personalized media experiences. In 2023, the United States Bureau of Economic Analysis (BEA) emphasized that media firms powered by AI in content generation achieved a 20% growth, bolstering productivity margins and reducing production expenses. Similarly, the EU has recognized its 2023 Digital Agenda, focusing funding on applications of AI in entertainment as a means to drive competitiveness in the digital space. This government support has accelerated AI adoption, enabling the media and entertainment industry to continue its leadership in utilizing AI image-generation technologies.

AI Image Generator Market Regional Analysis

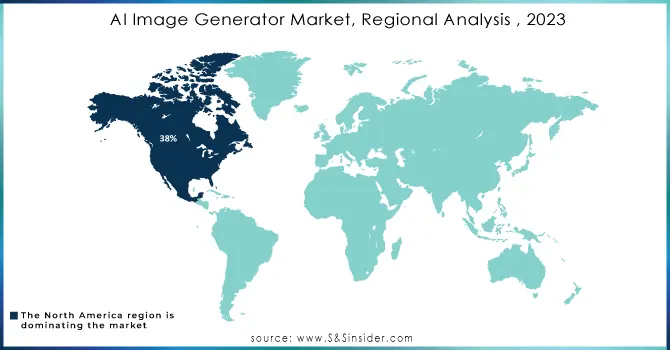
In 2023, North America emerged as the dominant region in the AI Image Generator Market which secured over 38% of the global market share. The high adoption rate of many advanced technologies, the established AI infrastructure here and elsewhere, as well as large government expenditures particularly in the U.S. The U.S. government’s AI Initiative, which allocated $1.2 billion specifically for the promotion of AI in creative industries, has catalyzed innovation in image generation. Furthermore, the increasing demand for AI-based content in the media, advertising, and gaming industry is ensuring North America remains dominant as a market.

On the other hand, the Asia-Pacific (APAC) region is growing at the highest CAGR during the forecast period. This growth is driven by countries like China and South Korea with heavy government-backed AI policies and funding. China has announced its new AI policy paving the way for $2 billion dedicated toward AI innovation while ensuring that they continues to gain an edge in its stake of market share within AI applications. This funding supports advanced research, educational programs, and the creation of AI parks to encourage startups and established firms alike. The Ministry of Science and ICT in South Korea is also a key driver of regional development, with a higher share of creative industry and 30% application productivity growth due to AI-based technology in 2023. With an ecosystem built to nurture AI innovation and adoption, APAC is quickly absorbing expertise in AI image generation technology and closing the gap with North America. With a very favorable policy landscape and technology advancements, the region is poised for exponential growth in the coming years.
AI-Image-Generator-Market-Regional-Analysis--2023

Recent Market Developments

  • In May, Stability AI released StableStudio, an open-source alternative to DreamStudio used by developers and creators to transform text into images with lots of other uses.

  • In April 2023, VanceAI unveiled the VanceAI Art Generator to create artwork from text descriptions using Stable Diffusion. On this platform you can mix and match styles, size them up or down, and visually manifest inspiration from whatever source of art that strikes your fancy.

Key Players in AI Image Generator Market

Service Providers/Manufacturers:

  • OpenAI (DALL-E, ChatGPT Image Generation)

  • NVIDIA (GauGAN, Picasso)

  • Adobe (Firefly, Sensei)

  • Midjourney (Midjourney Model, Blend Tool)

  • Microsoft (VASA-1, Azure OpenAI Services)

  • Stability AI (Stable Diffusion, Clipdrop)

  • DeepMind (Dreamer, Visual Transformer)

  • Runway (Gen-2, Inpainting Tools)

  • Google DeepMind (Imagen, Parti)

  • Meta Platforms (Make-A-Scene, Emu)

Key Users of AI Image Generator Products/Services:

  • Disney

  • Netflix

  • Sony

  • Electronic Arts (EA)

  • Universal Music Group

  • HBO

  • Coca-Cola

  • BBC

  • Warner Bros.

  • National Geographic

AI Image Generator Market Report Scope

Report Attributes Details
Market Size in 2023 USD 328.4 Million
Market Size by 2032 USD 1399.5 Million
CAGR CAGR of 17.5% From 2024 to 2032
Base Year 2023
Forecast Period 2024-2032
Historical Data 2020-2022
Report Scope & Coverage Market Size, Segments Analysis, Competitive  Landscape, Regional Analysis, DROC & SWOT Analysis, Forecast Outlook
Key Segments • By Component (Software, Services)
• By Organization Size (SME’s, Large organization)
• By End-user (Media & Entertainment, Healthcare, Fashion, Social Media, E-commerce, Others)
Regional Analysis/Coverage North America (US, Canada, Mexico), Europe (Eastern Europe [Poland, Romania, Hungary, Turkey, Rest of Eastern Europe] Western Europe] Germany, France, UK, Italy, Spain, Netherlands, Switzerland, Austria, Rest of Western Europe]), Asia Pacific (China, India, Japan, South Korea, Vietnam, Singapore, Australia, Rest of Asia Pacific), Middle East & Africa (Middle East [UAE, Egypt, Saudi Arabia, Qatar, Rest of Middle East], Africa [Nigeria, South Africa, Rest of Africa], Latin America (Brazil, Argentina, Colombia, Rest of Latin America)
Company Profiles OpenAI, NVIDIA, Adobe, Midjourney, Microsoft, Stability AI, DeepMind, Runway, Google DeepMind, Meta Platforms
Key Drivers • Industries like marketing, entertainment, and e-commerce are leveraging AI-generated images for personalization and engagement. Visual content drives higher engagement, leading companies to adopt AI image generators for scalable, customizable visuals.
• AI image generators are enabling new forms of digital art, supporting artists with tools that enhance creativity and streamline workflows. AI-generated content is gaining acceptance in mainstream media, online platforms, and creative projects.
RESTRAINTS • Concerns over the ownership of AI-generated images challenge market adoption due to the legal ambiguity of content rights. Copyright disputes may arise when models are trained on existing copyrighted images without permission.
• AI-generated images can be misused to create misleading or harmful content, raising ethical concerns. The spread of deepfakes and manipulated visuals creates distrust, limiting acceptance and regulation in the market.

Frequently Asked Questions

Ans: The projected size of the AI Image Generator Market by 2032 is USD 13.3 Million.

Ans: The North American region dominated the AI Image Generator Market in 2023.

Ans: The Platform component segment dominated the AI Image Generator market.

Ans: The 28.6% is the CAGR of the AI Image Generator market During the forecast period of 2024-2032.

Ans: The key players in the market are OpenAI, NVIDIA, Adobe, Midjourney, Microsoft, Stability AI, DeepMind, Runway, Google DeepMind, Meta Platforms and others.

1. Introduction

1.1 Market Definition

1.2 Scope (Inclusion and Exclusions)

1.3 Research Assumptions

2. Executive Summary

2.1 Market Overview

2.2 Regional Synopsis

2.3 Competitive Summary

3. Research Methodology

3.1 Top-Down Approach

3.2 Bottom-up Approach

3.3. Data Validation

3.4 Primary Interviews

4. Market Dynamics

4.1 Market Analysis

4.1.1 Drivers

4.1.2 Restraints

4.1.3 Opportunities

4.1.4 Challenges

4.2 PESTLE Analysis

4.3 Porter’s Five Forces Model

5. Statistical Insights and Trends Reporting

5.1 Adoption Rates of Emerging Technologies

5.2 Network Infrastructure Expansion, by Region

5.3 Cybersecurity Incidents, by Region (2020-2023)

5.4 Cloud Services Usage, by Region

6. Competitive Landscape

6.1 List of Major Companies, By Region

6.2 Market Share Analysis, By Region

6.3 Product Benchmarking

6.3.1 Product specifications and features

6.3.2 Pricing

6.4 Strategic Initiatives

6.4.1 Marketing and promotional activities

6.4.2 Distribution and Supply Chain Strategies

6.4.3 Expansion plans and new product launches

6.4.4 Strategic partnerships and collaborations

6.5 Technological Advancements

6.6 Market Positioning and Branding

7. AI Image Generator Market Segmentation, By Component

7.1 Chapter Overview

7.2 Services

7.2.1 Services Market Trends Analysis (2020-2032)

7.2.2 Services Market Size Estimates and Forecasts to 2032 (USD Million)

7.3 Software

7.3.1 Software Market Trends Analysis (2020-2032)

7.3.2 Software Market Size Estimates and Forecasts to 2032 (USD Million)

8. AI Image Generator Market Segmentation, By Organization Size

8.1 Chapter Overview

8.2 SME’s

8.2.1 SME’s Market Trends Analysis (2020-2032)

8.2.2 SME’s Market Size Estimates and Forecasts to 2032 (USD Million)

8.3 Large organization

8.3.1 Large organization Market Trends Analysis (2020-2032)

8.3.2 Large organization Market Size Estimates and Forecasts to 2032 (USD Million)

9. AI Image Generator Market Segmentation, By End-user

9.1 Chapter Overview

9.2 Media & Entertainment

9.2.1 Media & Entertainment Market Trends Analysis (2020-2032)

9.2.2 Media & Entertainment Market Size Estimates and Forecasts to 2032 (USD Million)

9.3 Healthcare

9.3.1 Healthcare Market Trends Analysis (2020-2032)

9.3.2 Healthcare Market Size Estimates and Forecasts to 2032 (USD Million)

9.4 Fashion

               9.4.1 Fashion Market Trends Analysis (2020-2032)

9.4.2 Fashion Market Size Estimates and Forecasts to 2032 (USD Million)

9.5 Social Media

               9.5.1 Social Media Market Trends Analysis (2020-2032)

9.5.2 Social Media Market Size Estimates and Forecasts to 2032 (USD Million)

9.6 E-commerce

               9.6.1 E-commerce Market Trends Analysis (2020-2032)

9.6.2 E-commerce Market Size Estimates and Forecasts to 2032 (USD Million)

9.7 Others

               9.7.1 Others Market Trends Analysis (2020-2032)

9.7.2 Others Market Size Estimates and Forecasts to 2032 (USD Million)

10. Regional Analysis

10.1 Chapter Overview

10.2 North America

10.2.1 Trends Analysis

10.2.2 North America AI Image Generator Market Estimates and Forecasts, by Country (2020-2032) (USD Million)

10.2.3 North America AI Image Generator Market Estimates and Forecasts, By Component (2020-2032) (USD Million)  

10.2.4 North America AI Image Generator Market Estimates and Forecasts, By Organization Size (2020-2032) (USD Million)

10.2.5 North America AI Image Generator Market Estimates and Forecasts, By End-user (2020-2032) (USD Million)

10.2.6 USA

10.2.6.1 USA AI Image Generator Market Estimates and Forecasts, By Component (2020-2032) (USD Million)

10.2.6.2 USA AI Image Generator Market Estimates and Forecasts, By Organization Size (2020-2032) (USD Million)

10.2.6.3 USA AI Image Generator Market Estimates and Forecasts, By End-user (2020-2032) (USD Million)

10.2.7 Canada

10.2.7.1 Canada AI Image Generator Market Estimates and Forecasts, By Component (2020-2032) (USD Million)

10.2.7.2 Canada AI Image Generator Market Estimates and Forecasts, By Organization Size (2020-2032) (USD Million)

10.2.7.3 Canada AI Image Generator Market Estimates and Forecasts, By End-user (2020-2032) (USD Million)

10.2.8 Mexico

10.2.8.1 Mexico AI Image Generator Market Estimates and Forecasts, By Component (2020-2032) (USD Million)

10.2.8.2 Mexico AI Image Generator Market Estimates and Forecasts, By Organization Size (2020-2032) (USD Million)

10.2.8.3 Mexico AI Image Generator Market Estimates and Forecasts, By End-user (2020-2032) (USD Million)

10.3 Europe

10.3.1 Eastern Europe

10.3.1.1 Trends Analysis

10.3.1.2 Eastern Europe AI Image Generator Market Estimates and Forecasts, by Country (2020-2032) (USD Million)

10.3.1.3 Eastern Europe AI Image Generator Market Estimates and Forecasts, By Component (2020-2032) (USD Million)  

10.3.1.4 Eastern Europe AI Image Generator Market Estimates and Forecasts, By Organization Size (2020-2032) (USD Million)

10.3.1.5 Eastern Europe AI Image Generator Market Estimates and Forecasts, By End-user (2020-2032) (USD Million)

10.3.1.6 Poland

10.3.1.6.1 Poland AI Image Generator Market Estimates and Forecasts, By Component (2020-2032) (USD Million)

10.3.1.6.2 Poland AI Image Generator Market Estimates and Forecasts, By Organization Size (2020-2032) (USD Million)

10.3.1.6.3 Poland AI Image Generator Market Estimates and Forecasts, By End-user (2020-2032) (USD Million)

10.3.1.7 Romania

10.3.1.7.1 Romania AI Image Generator Market Estimates and Forecasts, By Component (2020-2032) (USD Million)

10.3.1.7.2 Romania AI Image Generator Market Estimates and Forecasts, By Organization Size (2020-2032) (USD Million)

10.3.1.7.3 Romania AI Image Generator Market Estimates and Forecasts, By End-user (2020-2032) (USD Million)

10.3.1.8 Hungary

10.3.1.8.1 Hungary AI Image Generator Market Estimates and Forecasts, By Component (2020-2032) (USD Million)

10.3.1.8.2 Hungary AI Image Generator Market Estimates and Forecasts, By Organization Size (2020-2032) (USD Million)

10.3.1.8.3 Hungary AI Image Generator Market Estimates and Forecasts, By End-user (2020-2032) (USD Million)

10.3.1.9 Turkey

10.3.1.9.1 Turkey AI Image Generator Market Estimates and Forecasts, By Component (2020-2032) (USD Million)

10.3.1.9.2 Turkey AI Image Generator Market Estimates and Forecasts, By Organization Size (2020-2032) (USD Million)

10.3.1.9.3 Turkey AI Image Generator Market Estimates and Forecasts, By End-user (2020-2032) (USD Million)

10.3.1.10 Rest of Eastern Europe

10.3.1.10.1 Rest of Eastern Europe AI Image Generator Market Estimates and Forecasts, By Component (2020-2032) (USD Million)

10.3.1.10.2 Rest of Eastern Europe AI Image Generator Market Estimates and Forecasts, By Organization Size (2020-2032) (USD Million)

10.3.1.10.3 Rest of Eastern Europe AI Image Generator Market Estimates and Forecasts, By End-user (2020-2032) (USD Million)

10.3.2 Western Europe

10.3.2.1 Trends Analysis

10.3.2.2 Western Europe AI Image Generator Market Estimates and Forecasts, by Country (2020-2032) (USD Million)

10.3.2.3 Western Europe AI Image Generator Market Estimates and Forecasts, By Component (2020-2032) (USD Million)  

10.3.2.4 Western Europe AI Image Generator Market Estimates and Forecasts, By Organization Size (2020-2032) (USD Million)

10.3.2.5 Western Europe AI Image Generator Market Estimates and Forecasts, By End-user (2020-2032) (USD Million)

10.3.2.6 Germany

10.3.2.6.1 Germany AI Image Generator Market Estimates and Forecasts, By Component (2020-2032) (USD Million)

10.3.2.6.2 Germany AI Image Generator Market Estimates and Forecasts, By Organization Size (2020-2032) (USD Million)

10.3.2.6.3 Germany AI Image Generator Market Estimates and Forecasts, By End-user (2020-2032) (USD Million)

10.3.2.7 France

10.3.2.7.1 France AI Image Generator Market Estimates and Forecasts, By Component (2020-2032) (USD Million)

10.3.2.7.2 France AI Image Generator Market Estimates and Forecasts, By Organization Size (2020-2032) (USD Million)

10.3.2.7.3 France AI Image Generator Market Estimates and Forecasts, By End-user (2020-2032) (USD Million)

10.3.2.8 UK

10.3.2.8.1 UK AI Image Generator Market Estimates and Forecasts, By Component (2020-2032) (USD Million)

10.3.2.8.2 UK AI Image Generator Market Estimates and Forecasts, By Organization Size (2020-2032) (USD Million)

10.3.2.8.3 UK AI Image Generator Market Estimates and Forecasts, By End-user (2020-2032) (USD Million)

10.3.2.9 Italy

10.3.2.9.1 Italy AI Image Generator Market Estimates and Forecasts, By Component (2020-2032) (USD Million)

10.3.2.9.2 Italy AI Image Generator Market Estimates and Forecasts, By Organization Size (2020-2032) (USD Million)

10.3.2.9.3 Italy AI Image Generator Market Estimates and Forecasts, By End-user (2020-2032) (USD Million)

10.3.2.10 Spain

10.3.2.10.1 Spain AI Image Generator Market Estimates and Forecasts, By Component (2020-2032) (USD Million)

10.3.2.10.2 Spain AI Image Generator Market Estimates and Forecasts, By Organization Size (2020-2032) (USD Million)

10.3.2.10.3 Spain AI Image Generator Market Estimates and Forecasts, By End-user (2020-2032) (USD Million)

10.3.2.11 Netherlands

10.3.2.11.1 Netherlands AI Image Generator Market Estimates and Forecasts, By Component (2020-2032) (USD Million)

10.3.2.11.2 Netherlands AI Image Generator Market Estimates and Forecasts, By Organization Size (2020-2032) (USD Million)

10.3.2.11.3 Netherlands AI Image Generator Market Estimates and Forecasts, By End-user (2020-2032) (USD Million)

10.3.2.12 Switzerland

10.3.2.12.1 Switzerland AI Image Generator Market Estimates and Forecasts, By Component (2020-2032) (USD Million)

10.3.2.12.2 Switzerland AI Image Generator Market Estimates and Forecasts, By Organization Size (2020-2032) (USD Million)

10.3.2.12.3 Switzerland AI Image Generator Market Estimates and Forecasts, By End-user (2020-2032) (USD Million)

10.3.2.13 Austria

10.3.2.13.1 Austria AI Image Generator Market Estimates and Forecasts, By Component (2020-2032) (USD Million)

10.3.2.13.2 Austria AI Image Generator Market Estimates and Forecasts, By Organization Size (2020-2032) (USD Million)

10.3.2.13.3 Austria AI Image Generator Market Estimates and Forecasts, By End-user (2020-2032) (USD Million)

10.3.2.14 Rest of Western Europe

10.3.2.14.1 Rest of Western Europe AI Image Generator Market Estimates and Forecasts, By Component (2020-2032) (USD Million)

10.3.2.14.2 Rest of Western Europe AI Image Generator Market Estimates and Forecasts, By Organization Size (2020-2032) (USD Million)

10.3.2.14.3 Rest of Western Europe AI Image Generator Market Estimates and Forecasts, By End-user (2020-2032) (USD Million)

10.4 Asia Pacific

10.4.1 Trends Analysis

10.4.2 Asia Pacific AI Image Generator Market Estimates and Forecasts, by Country (2020-2032) (USD Million)

10.4.3 Asia Pacific AI Image Generator Market Estimates and Forecasts, By Component (2020-2032) (USD Million)  

10.4.4 Asia Pacific AI Image Generator Market Estimates and Forecasts, By Organization Size (2020-2032) (USD Million)

10.4.5 Asia Pacific AI Image Generator Market Estimates and Forecasts, By End-user (2020-2032) (USD Million)

10.4.6 China

10.4.6.1 China AI Image Generator Market Estimates and Forecasts, By Component (2020-2032) (USD Million)

10.4.6.2 China AI Image Generator Market Estimates and Forecasts, By Organization Size (2020-2032) (USD Million)

10.4.6.3 China AI Image Generator Market Estimates and Forecasts, By End-user (2020-2032) (USD Million)

10.4.7 India

10.4.7.1 India AI Image Generator Market Estimates and Forecasts, By Component (2020-2032) (USD Million)

10.4.7.2 India AI Image Generator Market Estimates and Forecasts, By Organization Size (2020-2032) (USD Million)

10.4.7.3 India AI Image Generator Market Estimates and Forecasts, By End-user (2020-2032) (USD Million)

10.4.8 Japan

10.4.8.1 Japan AI Image Generator Market Estimates and Forecasts, By Component (2020-2032) (USD Million)

10.4.8.2 Japan AI Image Generator Market Estimates and Forecasts, By Organization Size (2020-2032) (USD Million)

10.4.8.3 Japan AI Image Generator Market Estimates and Forecasts, By End-user (2020-2032) (USD Million)

10.4.9 South Korea

10.4.9.1 South Korea AI Image Generator Market Estimates and Forecasts, By Component (2020-2032) (USD Million)

10.4.9.2 South Korea AI Image Generator Market Estimates and Forecasts, By Organization Size (2020-2032) (USD Million)

10.4.9.3 South Korea AI Image Generator Market Estimates and Forecasts, By End-user (2020-2032) (USD Million)

10.4.10 Vietnam

10.4.10.1 Vietnam AI Image Generator Market Estimates and Forecasts, By Component (2020-2032) (USD Million)

10.4.10.2 Vietnam AI Image Generator Market Estimates and Forecasts, By Organization Size (2020-2032) (USD Million)

10.4.10.3 Vietnam AI Image Generator Market Estimates and Forecasts, By End-user (2020-2032) (USD Million)

10.4.11 Singapore

10.4.11.1 Singapore AI Image Generator Market Estimates and Forecasts, By Component (2020-2032) (USD Million)

10.4.11.2 Singapore AI Image Generator Market Estimates and Forecasts, By Organization Size (2020-2032) (USD Million)

10.4.11.3 Singapore AI Image Generator Market Estimates and Forecasts, By End-user (2020-2032) (USD Million)

10.4.12 Australia

10.4.12.1 Australia AI Image Generator Market Estimates and Forecasts, By Component (2020-2032) (USD Million)

10.4.12.2 Australia AI Image Generator Market Estimates and Forecasts, By Organization Size (2020-2032) (USD Million)

10.4.12.3 Australia AI Image Generator Market Estimates and Forecasts, By End-user (2020-2032) (USD Million)

10.4.13 Rest of Asia Pacific

10.4.13.1 Rest of Asia Pacific AI Image Generator Market Estimates and Forecasts, By Component (2020-2032) (USD Million)

10.4.13.2 Rest of Asia Pacific AI Image Generator Market Estimates and Forecasts, By Organization Size (2020-2032) (USD Million)

10.4.13.3 Rest of Asia Pacific AI Image Generator Market Estimates and Forecasts, By End-user (2020-2032) (USD Million)

10.5 Middle East and Africa

10.5.1 Middle East

10.5.1.1 Trends Analysis

10.5.1.2 Middle East AI Image Generator Market Estimates and Forecasts, by Country (2020-2032) (USD Million)

10.5.1.3 Middle East AI Image Generator Market Estimates and Forecasts, By Component (2020-2032) (USD Million)  

10.5.1.4 Middle East AI Image Generator Market Estimates and Forecasts, By Organization Size (2020-2032) (USD Million)

10.5.1.5 Middle East AI Image Generator Market Estimates and Forecasts, By End-user (2020-2032) (USD Million)

10.5.1.6 UAE

10.5.1.6.1 UAE AI Image Generator Market Estimates and Forecasts, By Component (2020-2032) (USD Million)

10.5.1.6.2 UAE AI Image Generator Market Estimates and Forecasts, By Organization Size (2020-2032) (USD Million)

10.5.1.6.3 UAE AI Image Generator Market Estimates and Forecasts, By End-user (2020-2032) (USD Million)

10.5.1.7 Egypt

10.5.1.7.1 Egypt AI Image Generator Market Estimates and Forecasts, By Component (2020-2032) (USD Million)

10.5.1.7.2 Egypt AI Image Generator Market Estimates and Forecasts, By Organization Size (2020-2032) (USD Million)

10.5.1.7.3 Egypt AI Image Generator Market Estimates and Forecasts, By End-user (2020-2032) (USD Million)

10.5.1.8 Saudi Arabia

10.5.1.8.1 Saudi Arabia AI Image Generator Market Estimates and Forecasts, By Component (2020-2032) (USD Million)

10.5.1.8.2 Saudi Arabia AI Image Generator Market Estimates and Forecasts, By Organization Size (2020-2032) (USD Million)

10.5.1.8.3 Saudi Arabia AI Image Generator Market Estimates and Forecasts, By End-user (2020-2032) (USD Million)

10.5.1.9 Qatar

10.5.1.9.1 Qatar AI Image Generator Market Estimates and Forecasts, By Component (2020-2032) (USD Million)

10.5.1.9.2 Qatar AI Image Generator Market Estimates and Forecasts, By Organization Size (2020-2032) (USD Million)

10.5.1.9.3 Qatar AI Image Generator Market Estimates and Forecasts, By End-user (2020-2032) (USD Million)

10.5.1.10 Rest of Middle East

10.5.1.10.1 Rest of Middle East AI Image Generator Market Estimates and Forecasts, By Component (2020-2032) (USD Million)

10.5.1.10.2 Rest of Middle East AI Image Generator Market Estimates and Forecasts, By Organization Size (2020-2032) (USD Million)

10.5.1.10.3 Rest of Middle East AI Image Generator Market Estimates and Forecasts, By End-user (2020-2032) (USD Million)

10.5.2 Africa

10.5.2.1 Trends Analysis

10.5.2.2 Africa AI Image Generator Market Estimates and Forecasts, by Country (2020-2032) (USD Million)

10.5.2.3 Africa AI Image Generator Market Estimates and Forecasts, By Component (2020-2032) (USD Million)  

10.5.2.4 Africa AI Image Generator Market Estimates and Forecasts, By Organization Size (2020-2032) (USD Million)

10.5.2.5 Africa AI Image Generator Market Estimates and Forecasts, By End-user (2020-2032) (USD Million)

10.5.2.6 South Africa

10.5.2.6.1 South Africa AI Image Generator Market Estimates and Forecasts, By Component (2020-2032) (USD Million)

10.5.2.6.2 South Africa AI Image Generator Market Estimates and Forecasts, By Organization Size (2020-2032) (USD Million)

10.5.2.6.3 South Africa AI Image Generator Market Estimates and Forecasts, By End-user (2020-2032) (USD Million)

10.5.2.7 Nigeria

10.5.2.7.1 Nigeria AI Image Generator Market Estimates and Forecasts, By Component (2020-2032) (USD Million)

10.5.2.7.2 Nigeria AI Image Generator Market Estimates and Forecasts, By Organization Size (2020-2032) (USD Million)

10.5.2.7.3 Nigeria AI Image Generator Market Estimates and Forecasts, By End-user (2020-2032) (USD Million)

10.5.2.8 Rest of Africa

10.5.2.8.1 Rest of Africa AI Image Generator Market Estimates and Forecasts, By Component (2020-2032) (USD Million)

10.5.2.8.2 Rest of Africa AI Image Generator Market Estimates and Forecasts, By Organization Size (2020-2032) (USD Million)

10.5.2.8.3 Rest of Africa AI Image Generator Market Estimates and Forecasts, By End-user (2020-2032) (USD Million)

10.6 Latin America

10.6.1 Trends Analysis

10.6.2 Latin America AI Image Generator Market Estimates and Forecasts, by Country (2020-2032) (USD Million)

10.6.3 Latin America AI Image Generator Market Estimates and Forecasts, By Component (2020-2032) (USD Million)  

10.6.4 Latin America AI Image Generator Market Estimates and Forecasts, By Organization Size (2020-2032) (USD Million)

10.6.5 Latin America AI Image Generator Market Estimates and Forecasts, By End-user (2020-2032) (USD Million)

10.6.6 Brazil

10.6.6.1 Brazil AI Image Generator Market Estimates and Forecasts, By Component (2020-2032) (USD Million)

10.6.6.2 Brazil AI Image Generator Market Estimates and Forecasts, By Organization Size (2020-2032) (USD Million)

10.6.6.3 Brazil AI Image Generator Market Estimates and Forecasts, By End-user (2020-2032) (USD Million)

10.6.7 Argentina

10.6.7.1 Argentina AI Image Generator Market Estimates and Forecasts, By Component (2020-2032) (USD Million)

10.6.7.2 Argentina AI Image Generator Market Estimates and Forecasts, By Organization Size (2020-2032) (USD Million)

10.6.7.3 Argentina AI Image Generator Market Estimates and Forecasts, By End-user (2020-2032) (USD Million)

10.6.8 Colombia

10.6.8.1 Colombia AI Image Generator Market Estimates and Forecasts, By Component (2020-2032) (USD Million)

10.6.8.2 Colombia AI Image Generator Market Estimates and Forecasts, By Organization Size (2020-2032) (USD Million)

10.6.8.3 Colombia AI Image Generator Market Estimates and Forecasts, By End-user (2020-2032) (USD Million)

10.6.9 Rest of Latin America

10.6.9.1 Rest of Latin America AI Image Generator Market Estimates and Forecasts, By Component (2020-2032) (USD Million)

10.6.9.2 Rest of Latin America AI Image Generator Market Estimates and Forecasts, By Organization Size (2020-2032) (USD Million)

10.6.9.3 Rest of Latin America AI Image Generator Market Estimates and Forecasts, By End-user (2020-2032) (USD Million)

11. Company Profiles

11.1 OpenAI

11.1.1 Company Overview

11.1.2 Financial

11.1.3 Products/ Services Offered

11.1.4 SWOT Analysis

11.2  NVIDIA

11.2.1 Company Overview

11.2.2 Financial

11.2.3 Products/ Services Offered

11.2.4 SWOT Analysis

11.3 Adobe

11.3.1 Company Overview

11.3.2 Financial

11.3.3 Products/ Services Offered

11.3.4 SWOT Analysis

11.4 Midjourney

11.4.1 Company Overview

11.4.2 Financial

11.4.3 Products/ Services Offered

11.4.4 SWOT Analysis

11.5 Microsoft

11.5.1 Company Overview

11.5.2 Financial

11.5.3 Products/ Services Offered

11.5.4 SWOT Analysis

11.6 Stability AI

11.6.1 Company Overview

11.6.2 Financial

11.6.3 Products/ Services Offered

11.6.4 SWOT Analysis

11.7 DeepMind

11.7.1 Company Overview

11.7.2 Financial

11.7.3 Products/ Services Offered

11.7.4 SWOT Analysis

11.8 Runway

11.8.1 Company Overview

11.8.2 Financial

11.8.3 Products/ Services Offered

11.8.4 SWOT Analysis

11.9 Google DeepMind

11.9.1 Company Overview

11.9.2 Financial

11.9.3 Products/ Services Offered

11.9.4 SWOT Analysis

11.10 Meta Platforms

11.10.1 Company Overview

11.10.2 Financial

11.10.3 Products/ Services Offered

11.10.4 SWOT Analysis

12. Use Cases and Best Practices

13. Conclusion

An accurate research report requires proper strategizing as well as implementation. There are multiple factors involved in the completion of good and accurate research report and selecting the best methodology to compete the research is the toughest part. Since the research reports we provide play a crucial role in any company’s decision-making process, therefore we at SNS Insider always believe that we should choose the best method which gives us results closer to reality. This allows us to reach at a stage wherein we can provide our clients best and accurate investment to output ratio.

Each report that we prepare takes a timeframe of 350-400 business hours for production. Starting from the selection of titles through a couple of in-depth brain storming session to the final QC process before uploading our titles on our website we dedicate around 350 working hours. The titles are selected based on their current market cap and the foreseen CAGR and growth.


The 5 steps process:

Step 1: Secondary Research:

Secondary Research or Desk Research is as the name suggests is a research process wherein, we collect data through the readily available information. In this process we use various paid and unpaid databases which our team has access to and gather data through the same. This includes examining of listed companies’ annual reports, Journals, SEC filling etc. Apart from this our team has access to various associations across the globe across different industries. Lastly, we have exchange relationships with various university as well as individual libraries.

Secondary Research

Step 2: Primary Research

When we talk about primary research, it is a type of study in which the researchers collect relevant data samples directly, rather than relying on previously collected data.  This type of research is focused on gaining content specific facts that can be sued to solve specific problems. Since the collected data is fresh and first hand therefore it makes the study more accurate and genuine.

We at SNS Insider have divided Primary Research into 2 parts.

Part 1 wherein we interview the KOLs of major players as well as the upcoming ones across various geographic regions. This allows us to have their view over the market scenario and acts as an important tool to come closer to the accurate market numbers. As many as 45 paid and unpaid primary interviews are taken from both the demand and supply side of the industry to make sure we land at an accurate judgement and analysis of the market.

This step involves the triangulation of data wherein our team analyses the interview transcripts, online survey responses and observation of on filed participants. The below mentioned chart should give a better understanding of the part 1 of the primary interview.

Primary Research

Part 2: In this part of primary research the data collected via secondary research and the part 1 of the primary research is validated with the interviews from individual consultants and subject matter experts.

Consultants are those set of people who have at least 12 years of experience and expertise within the industry whereas Subject Matter Experts are those with at least 15 years of experience behind their back within the same space. The data with the help of two main processes i.e., FGDs (Focused Group Discussions) and IDs (Individual Discussions). This gives us a 3rd party nonbiased primary view of the market scenario making it a more dependable one while collation of the data pointers.

Step 3: Data Bank Validation

Once all the information is collected via primary and secondary sources, we run that information for data validation. At our intelligence centre our research heads track a lot of information related to the market which includes the quarterly reports, the daily stock prices, and other relevant information. Our data bank server gets updated every fortnight and that is how the information which we collected using our primary and secondary information is revalidated in real time.

Data Bank Validation

Step 4: QA/QC Process

After all the data collection and validation our team does a final level of quality check and quality assurance to get rid of any unwanted or undesired mistakes. This might include but not limited to getting rid of the any typos, duplication of numbers or missing of any important information. The people involved in this process include technical content writers, research heads and graphics people. Once this process is completed the title gets uploader on our platform for our clients to read it.

Step 5: Final QC/QA Process:

This is the last process and comes when the client has ordered the study. In this process a final QA/QC is done before the study is emailed to the client. Since we believe in giving our clients a good experience of our research studies, therefore, to make sure that we do not lack at our end in any way humanly possible we do a final round of quality check and then dispatch the study to the client.

Key Segments:

By Component

  • Software

  • Services

By Organization Size

  • SME’s

  • Large organization

By End-user

  • Media & Entertainment

  • Healthcare

  • Fashion

  • Social Media

  • E-commerce

  • Others

Request for Segment Customization as per your Business Requirement: Segment Customization Request

REGIONAL COVERAGE:

North America

  • US

  • Canada

  • Mexico

Europe

  • Eastern Europe

    • Poland

    • Romania

    • Hungary

    • Turkey

    • Rest of Eastern Europe

  • Western Europe

    • Germany

    • France

    • UK

    • Italy

    • Spain

    • Netherlands

    • Switzerland

    • Austria

    • Rest of Western Europe

Asia Pacific

  • China

  • India

  • Japan

  • South Korea

  • Vietnam

  • Singapore

  • Australia

  • Rest of Asia Pacific

Middle East & Africa

  • Middle East

    • UAE

    • Egypt

    • Saudi Arabia

    • Qatar

    • Rest of the Middle East

  • Africa

    • Nigeria

    • South Africa

    • Rest of Africa

Latin America

  • Brazil

  • Argentina

  • Colombia

  • Rest of Latin America

Request for Country Level Research Report: Country Level Customization Request

Available Customization

With the given market data, SNS Insider offers customization as per the company’s specific needs. The following customization options are available for the report:

  • Product Analysis

  • Criss-Cross segment analysis (e.g. Product X Application)

  • Product Matrix which gives a detailed comparison of product portfolio of each company

  • Geographic Analysis

  • Additional countries in any of the regions

  • Company Information

  • Detailed analysis and profiling of additional market players (Up to five)


  •            5000 (33% Discount)


  •            8950 (40% Discount)


  •            3050 (23% Discount)

Start a Conversation

Hi! Click one of our member below to chat on Phone