image

AI-Enabled Global Capability Centers (GCC) Market Size:

AI-Enabled Global Capability Center (GCC) Market Revenue Analysis

Get More Information on AI-Enabled Global Capability Center (GCC) Market - Request Sample Report

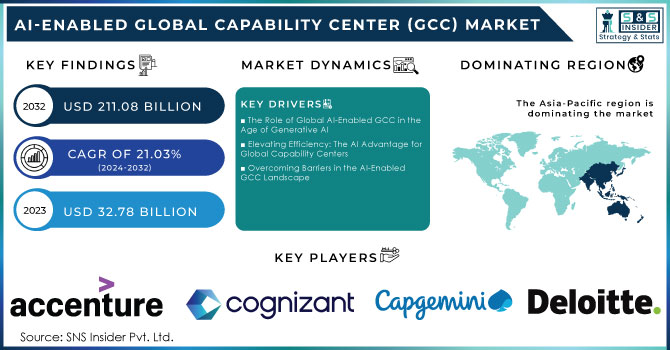
The AI-Enabled Global Capability Center (GCC) Market size was valued at USD 32.78 billion in 2023 and estimated at  USD 211.08 billion in 2032, and grow at a CAGR is 21.03% for 2024-2032.

AI-Enabled Global Capability Center Market Overview

The AI-enabled Global Capability Center (GCC) market is rapidly evolving, driven by the increasing demand for digital transformation across various sectors. GCCs serve as strategic hubs for multinational corporations, leveraging artificial intelligence (AI) to enhance operational efficiency and innovate business processes. India leads the global GCC market, commanding over 50% of the centers, while Southeast Asia is emerging as a prominent data center hotspot. The economic potential of AI technologies is significant, with estimates suggesting that generative AI could contribute an additional USD 2.6 trillion to the global economy by improving productivity. This growth is further supported by substantial investments from tech giants like Microsoft and Amazon, who are committing billions to build robust data infrastructures.

  • The Role of Global AI-Enabled GCC in the Age of Generative AI

The age of generative AI promises to dramatically amplify the capabilities and impact of artificial intelligence (AI) across all technology sectors. To realize this potential and thrive in the next decade, companies must fundamentally reinvent their operations. A crucial element of this transformation involves rethinking every part of the business-from innovation and customer interaction to product development and research. Furthermore, organizations need the right talent to strategically apply technology, data, and AI to transform their business effectively. This necessitates reshaping company culture and ensuring that employee skills develop in tandem with the organization, thereby creating a workplace that maximizes employee potential.

Global AI-Enabled GCC (GCCs) have emerged as critical drivers of this transformation, acting as true business reinvention engines. GCCs provide access to a global pool of top-tier talent equipped with the latest technology and training necessary for organizations to stay ahead of industry trends. These centers often function as extensions of corporate headquarters, with senior leaders managing global teams and spearheading international strategies. By focusing on areas such as technology innovation, product design, and engineering, GCCs streamline corporate functions, enhancing efficiency and innovation through integrated help desks and operational command hubs.

Moreover, research indicates significant expected growth in Global Business Services (GBS), especially in marketing (113% increase), supply chain and logistics (88% increase), and transformation capabilities (64%). This surge demonstrates that GCCs and GBS can work in tandem to create maximum value for organizations, allowing them to access best-in-class talent and services that enhance efficiency and innovation without starting from scratch.

The pandemic highlighted GCCs' broader potential, showcasing their agility and resilience. For example, a global pharmaceutical and healthcare company has optimized operations using a GCC network that harnesses digital-first talent across various functions such as R&D, IT, manufacturing, and finance. This realignment is set to reduce operational costs while accelerating the development of groundbreaking treatments.

In mature markets, finding highly skilled workers can be challenging, but many emerging markets offer a rich talent pool. By 2030, 606 million skilled workers are expected to be available in 19 countries across Asia-Pacific, Africa, and Latin America. Countries like India are particularly attractive, with the number of employees in Indian GCCs expected to double in the next three years, reaching over 3 million and occupying over 50 million square feet of office space.

To maximize the value of GCCs, organizations must continuously invest in technology and cultivate a culture that fosters cross-functional collaboration. GCCs can drive a cultural reset within organizations, ensuring that employees feel connected regardless of their physical location. This omni-connected approach has been shown to generate a 7.4% increase in revenue growth, enhancing both employee satisfaction and business outcomes.

In summary, GCCs are crucial in the age of generative AI, enabling companies to access top talent, streamline operations, and drive innovation. By integrating GCCs into their business strategies, organizations can unlock the full potential of AI and transform their operations for sustained growth.

  • Elevating Efficiency: The AI Advantage for Global Capability Centers

The AI-enabled Global AI-Enabled GCC (GCC) market represents a significant opportunity for businesses to leverage cutting-edge technologies for operational excellence. As organizations increasingly adopt AI and machine learning capabilities, 65% of enterprises report that leveraging AI has led to improved customer experiences and 64% note enhanced operational efficiency. This trend underscores the importance of GCCs as vital partners in digital transformation, enabling businesses to integrate AI-driven solutions that streamline processes and foster innovation. Furthermore, with the rise of remote work and the need for agility in business operations, 70% of GCCs are focusing on automation to enhance productivity and adapt to changing market dynamics. By positioning themselves as leaders in advanced analytics and data management, GCCs can help organizations extract actionable insights from vast data sets, driving better decision-making and ultimately increasing profitability. As the demand for AI solutions grows, GCCs that specialize in these areas will not only enhance their competitive edge but also solidify their role as indispensable partners in navigating the complexities of an AI-driven landscape.

Rapid expansion of AI technologies in the region. This growth trend is mirrored across Southeast Asia, which is becoming a significant data center hotspot due to increasing investments and the proliferation of AI technologies. The AI products and services market is expected to reach up to USD 990 billion by 2027, indicating a growing reliance on AI-driven solutions for addressing business challenges, enhancing customer experiences, and improving decision-making processes. Additionally, the overall AI market is poised for exponential growth, with substantial demand for AI and automation backed by significant investments in data infrastructure. Notably, 80% of new GCCs prioritize AI and machine learning capabilities, reflecting the increasing recognition of AI’s potential to transform business operations. The integration of AI within GCCs is generating a surge in demand for advanced analytics and data management solutions, allowing companies to extract valuable insights from large data sets and enabling swift, informed decision-making. This trend not only optimizes operational efficiency but also drives revenue growth through enhanced customer engagement and satisfaction.

  • Overcoming Barriers in the AI-Enabled GCC Landscape

The AI-enabled Global AI-Enabled GCC (GCC) market faces several restraints that could hinder its growth. One of the primary challenges is the shortage of skilled talent in AI and machine learning, which limits the ability of GCCs to implement advanced technologies effectively. As organizations increasingly prioritize automation and AI integration, the demand for skilled professionals outpaces supply, creating a competitive hiring environment. Additionally, the high costs associated with developing and maintaining sophisticated AI systems can deter smaller companies from entering the market. Moreover, data privacy and regulatory compliance present significant hurdles, as organizations must navigate complex legal frameworks to ensure responsible AI usage.

Concerns over data security further complicate the landscape, as companies need to protect sensitive information while leveraging data analytics for decision-making. Furthermore, the rapid pace of technological advancement can lead to obsolescence, making it challenging for GCCs to keep their infrastructure and skills up to date. As reported, 70% of GCCs emphasize the need for agility in operations, yet adapting to these changes often requires significant investments in training and technology, adding another layer of complexity to the operational environment. Thus, while the potential for growth in the AI-enabled GCC market is substantial, these restraints must be addressed to ensure sustainable development.

AI-Enabled Global Capability Center (GCC) Market Segmentation Overview

By Services Type

Information Technology (IT) services dominate the market with approximately 40% share, driven by the growing reliance on digital transformation, cloud computing, and cybersecurity, making it the most significant sector.

Business Process Management (BPM) follows, capturing around 25% of the market due to its ability to enhance efficiency, reduce costs, and improve customer service within organizations. Knowledge Process Outsourcing (KPO) accounts for 15% of the market, offering specialized services such as data analytics, financial research, and legal procedures to meet the nuanced needs of global markets. Engineering and R&D Services represent the smallest segment with a 20% market share, focusing on critical innovation and product development in sectors like automotive, healthcare, and aerospace. The substantial share of IT services reflects the global shift toward digital business operations, while the notable portion held by BPM emphasizes the growing need for operational efficiency and outsourcing. The smaller KPO segment highlights the demand for specialized knowledge and expertise, while engineering services underscore the importance of innovation in competitive industries.

By Organization Size

Large Enterprises dominate the market, holding 69% of the share, largely due to their capacity to invest significantly in infrastructure, technology, and talent. These corporations typically leverage Global Capability Centers (GCCs) to streamline complex business processes, manage costs, and centralize functions such as IT, HR, and finance. Given that large organizations often operate across borders, they require the sophisticated coordination and support that GCCs are designed to provide.

In contrast, Small and Medium Enterprises (SMEs) account for 32% of the market share. While this figure is smaller, the use of GCCs among SMEs is steadily increasing. At a macro level, SMEs benefit from access to specialized skills and improved efficiency, enabling them to reduce operational costs that would otherwise necessitate large in-house teams. As digital transformation and cloud services become more prevalent, SMEs are finding it easier to enter the GCC market, as these innovations lower the barriers to entry.

AI-Enabled Global Capability Center Market Regional Analysis

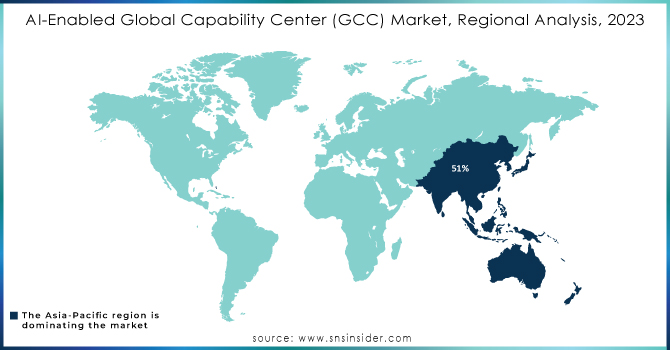
The Asia-Pacific region leads the market, holding a significant share, with India and the Philippines emerging as key growth drivers for Global Capability Centers (GCCs). These countries have captured a substantial market share due to their low labor costs and highly skilled workforce, coupled with favorable government policies that have positioned India to account for nearly 51% of global GCCs. As a result, many large American and European companies are expanding their capability centers in the Asia-Pacific to enhance operational efficiency and maintain strategic proximity to emerging markets.

North America follows as the second-largest market, representing about 14% of the global share. In this region, multinational companies aim to address operational inefficiencies through GCCs, with the increasing demand for advanced technologies such as AI, automation, and cloud services driving growth for innovation and research and development.

Europe holds around 15% of the market, with countries like Poland and Ireland becoming popular GCC destinations for organizations targeting the broader European market. Supportive regulatory environments and access to multilingual talent have bolstered Europe’s growth in this sector.

The remaining 20% of the market is made up of Latin America and the Middle East & Africa, which are gradually establishing themselves as emerging GCC hubs as more organizations explore opportunities in these untapped regions.

AI-Enabled-Global-Capability-Center-GCC-Market-Regional-Analysis-2023.

Need Any Customization Research On AI-Enabled Global Capability Center (GCC) market - Inquiry Now

Key Players in AI-Enabled Global Capability Center Market

Some Of Major Key Players in AI-Enabled Global Capability Center (GCC) market who provide product and offering:

  • Accenture (AI Consulting Services)

  • Tata Consultancy Services (TCS) (TCS Cognix)

  • Wipro (Wipro HOLMES)

  • Infosys (Infosys Nia)

  • Cognizant (Cognizant AI)

  • IBM (IBM Watson)

  • Deloitte (Deloitte AI Services)

  • Capgemini (Capgemini AI Solutions)

  • Tech Mahindra (Tech Mahindra AI)

  • HCL Technologies (HCL AI Services)

  • Genpact (Genpact AI Solutions)

  • LTI (Larsen & Toubro Infotech) (LTI Mindtree AI)

  • Zensar Technologies (Zensar AI)

  • Mphasis (Mphasis Digital Risk)

  • NTT Data (NTT Data AI Solutions)

  • Cimpress (Cimpress AI)

  • Syntel (Syntel AI Solutions)

  • Zebra Technologies (Zebra AI Solutions)

  • C3.ai (C3 AI Suite)

  • Qualcomm (Qualcomm AI Engine)

List of notable AI-enabled data suppliers in the GCC market without mentioning specific products:

  • Amazon Web Services (AWS)

  • Microsoft Azure

  • Google Cloud

  • IBM

  • Salesforce

  • SAP

  • Oracle

  • Cloudera

  • Teradata

  • Snowflake

  • Palantir Technologies

  • DataRobot

  • TIBCO Software

  • Alteryx

  • Qlik

  • Domo

  • Databricks

  • SAS

  • MicroStrategy

  • ThoughtSpot

Recent Development

  • Pfizer Establishes Global Capability Center: Pfizer has set up a Global Capability Center in India to enhance operational efficiency and access specialized talent.

  • Gatewai Launches AI-Powered Solutions: Gatewai introduced AI-powered solutions targeting India’s GCC market, emphasizing the growing trend of AI utilization.

  • Southeast Asia as a Data Center Hotspot: The region is increasingly recognized as a global data center hotspot due to the rising usage of AI technologies.

  • Microsoft and Amazon Investments: Major corporations like Microsoft and Amazon are investing billions in data infrastructure and technology to bolster the AI-enabled GCC market.

  • Economic Potential of Generative AI: According to McKinsey, generative AI could add an estimated $2.6 trillion to the global economy by enhancing productivity.

  • Growing Demand for Advanced Analytics: The adoption of AI-driven technologies in GCCs is expected to rise significantly, with a focus on advanced analytics and cloud infrastructure.

AI-Enabled Global Capability Center Market Report Scope:

Report Attributes Details
Market Size in 2023 USD 32.78 billion
Market Size by 2032 USD 211.08 Billion 
CAGR CAGR of 21.03% From 2024 to 2032
Base Year 2023
Forecast Period 2024-2032
Historical Data 2020-2022
Report Scope & Coverage Market Size, Segments Analysis, Competitive  Landscape, Regional Analysis, DROC & SWOT Analysis, Forecast Outlook
Key Segments • By Service Type (Information Technology (IT) Services, Business Process Management (BPM), Knowledge Process Outsourcing (KPO), Engineering and R&D Services)
• By Industry Vertical(Banking, Financial Services, and Insurance (BFSI), Healthcare and Life Sciences, Retail and Consumer Goods, Manufacturing and Automotive, Telecom & IT)
• By Organization Size (Large Enterprises, Small and Medium Enterprises (SMEs))
Regional Analysis/Coverage North America (US, Canada, Mexico), Europe (Eastern Europe [Poland, Romania, Hungary, Turkey, Rest of Eastern Europe] Western Europe [Germany, France, UK, Italy, Spain, Netherlands, Switzerland, Austria, Rest of Western Europe]), Asia-Pacific (China, India, Japan, South Korea, Vietnam, Singapore, Australia, Rest of Asia-Pacific), Middle East & Africa (Middle East [UAE, Egypt, Saudi Arabia, Qatar, Rest of Middle East], Africa [Nigeria, South Africa, Rest of Africa], Latin America (Brazil, Argentina, Colombia, Rest of Latin America)
Company Profiles Accenture, Tata Consultancy Services, Wipro, Infosys, Cognizant, IBM, Deloitte, Capgemini, Tech Mahindra, HCL Technologies, Genpact, LTI, Zensar Technologies, Mphasis, NTT Data, Cimpress, Syntel, Zebra Technologies, C3.ai, and Qualcomm.
Key Drivers The Role of Global AI-Enabled GCC in the Age of Generative AI
RESTRAINTS Overcoming Barriers in the AI-Enabled GCC Landscape

Frequently Asked Questions

Ans:  The AI-Enabled Global Capability Centers Market are expected to grow at a CAGR of 21.03% during 2024-2032.

Ans: The AI-Enabled Global Capability Center (GCC) Market size was valued at USD 32.78 billion in 2023

Ans: The major growth factor of the AI-Enabled Global Capability Centers Market is the increasing demand for advanced analytics and AI-driven solutions to enhance operational efficiency, drive innovation, and improve decision-making processes across various industries.

Ans: The large Enterprise segment dominated the AI-Enabled Global Capability Centers Market.

Ans: Asia-Pacific dominated the AI-Enabled Global Capability Centers Market in 2023.

Table of Content

1. Introduction

1.1 Market Definition

1.2 Scope (Inclusion and Exclusions)

1.3 Research Assumptions

2. Executive Summary

2.1 Market Overview

2.2 Regional Synopsis

2.3 Competitive Summary

3. Research Methodology

3.1 Top-Down Approach

3.2 Bottom-up Approach

3.3. Data Validation

3.4 Primary Interviews

4. Market Dynamics Impact Analysis

4.1 Market Driving Factors Analysis

4.1.1 Drivers

4.1.2 Restraints

4.1.3 Opportunities

4.1.4 Challenges

4.2 PESTLE Analysis

4.3 Porter’s Five Forces Model

5. Statistical Insights and Trends Reporting

5.1 AI Compliance and Regulatory Frameworks, by Region

5.2 AI Technology Adoption Rates, by Region

5.3 Consumer Preferences and Expectations, by Region

5.4 Market Trends and Aftermarket Dynamics (Data on GCC Services)

6. Competitive Landscape

6.1 List of Major Companies, By Region

6.2 Market Share Analysis, By Region

6.3 Product Benchmarking

6.3.1 Product specifications and features

6.3.2 Pricing

6.4 Strategic Initiatives

6.4.1 Marketing and promotional activities

6.4.2 Distribution and supply chain strategies

6.4.3 Expansion plans and new product launches

6.4.4 Strategic partnerships and collaborations

6.5 Technological Advancements

6.6 Market Positioning and Branding

7. AI-Enabled GCC Market Segmentation, by Services

7.1 Chapter Overview

7.2 Artificial Intelligence (AI) Services

7.2.1 Artificial Intelligence (AI) Services Market Trends Analysis (2020-2032)

7.2.2 Artificial Intelligence (AI) Services Market Size Estimates and Forecasts to 2032 (USD Billion)

7.3 Business Process Management (BPM)

7.3.1 Business Process Management (BPM) Market Trends Analysis (2020-2032)

7.3.2 Business Process Management (BPM) Market Size Estimates and Forecasts to 2032 (USD Billion)

7.4 knowledge Process Outsourcing (KPO)

7.4.1 knowledge Process Outsourcing (KPO) Market Trends Analysis (2020-2032)

7.4.2 Knowledge Process Outsourcing (KPO) Market Size Estimates and Forecasts to 2032 (USD Billion)

7.5 Engineering and R&D Services Powered by AI

7.5.1 Engineering and R&D Services Powered by AI Market Trends Analysis (2020-2032)

7.5.2 Engineering and R&D Services Powered by AI Market Size Estimates and Forecasts to 2032 (USD Billion)

8. AI-Enabled GCC Market Segmentation, by Industry

8.1 Chapter Overview

8.2 Banking, Financial Services, and Insurance (BFSI)

8.2.1 Banking, Financial Services, and Insurance (BFSI) Market Trends Analysis (2020-2032)

8.2.2 Banking, Financial Services, and Insurance (BFSI) Market Size Estimates and Forecasts to 2032 (USD Billion)

8.3 Healthcare and Life Sciences

8.3.1 Healthcare and Life Sciences Market Trends Analysis (2020-2032)

8.3.2 Healthcare and Life Sciences Market Size Estimates and Forecasts to 2032 (USD Billion)

8.4 Retail and Consumer Goods

8.4.1 Retail and Consumer Goods: Market Trends Analysis (2020-2032)

8.4.2 Retail and Consumer Goods: Market Size Estimates and Forecasts to 2032 (USD Billion)

8.5 Manufacturing and Automotive

8.5.1 Manufacturing and Automotive Market Trends Analysis (2020-2032)

8.5.2 Manufacturing and Automotive Market Size Estimates and Forecasts to 2032 (USD Billion)

8.6 Telecom & IT

8.6.1 Telecom & IT Market Trends Analysis (2020-2032)

8.6.2 Telecom & IT Market Size Estimates and Forecasts to 2032 (USD Billion)

9. AI-Enabled GCC Market Segmentation, by Organization Size

9.1 Chapter Overview

9.2 Large Enterprises 

9.2.1 Large Enterprises Market Trends Analysis (2020-2032)

9.2.2 Large Enterprises Market Size Estimates and Forecasts to 2032 (USD Billion)

9.3 Small and Medium Enterprises (SMEs)

9.3.1 Small and Medium Enterprises (SMEs) Market Trends Analysis (2020-2032)

9.3.2 Small and Medium Enterprises (SMEs) Market Size Estimates and Forecasts to 2032 (USD Billion)

10. Regional Analysis

10.1 Chapter Overview

10.2 North America

10.2.1 Trends Analysis

10.2.2 North America AI-Enabled GCC Market Estimates and Forecasts, by Country (2020-2032) (USD Billion)

10.2.3 North America AI-Enabled GCC Market Estimates and Forecasts, by Services (2020-2032) (USD Billion)  

10.2.4 North America AI-Enabled GCC Market Estimates and Forecasts, by Industry (2020-2032) (USD Billion)

10.2.5 North America AI-Enabled GCC Market Estimates and Forecasts, by Organization Size (2020-2032) (USD Billion)

10.2.6 USA

10.2.6.1 USA AI-Enabled GCC Market Estimates and Forecasts, by Services (2020-2032) (USD Billion)

10.2.6.2 USA AI-Enabled GCC Market Estimates and Forecasts, by Industry (2020-2032) (USD Billion)

10.2.6.3 USA AI-Enabled GCC Market Estimates and Forecasts, by Organization Size  (2020-2032) (USD Billion)

10.2.7 Canada

10.2.7.1 Canada AI-Enabled GCC Market Estimates and Forecasts, by Services (2020-2032) (USD Billion)

10.2.7.2 Canada AI-Enabled GCC Market Estimates and Forecasts, by Industry  (2020-2032) (USD Billion)

10.2.7.3 Canada AI-Enabled GCC Market Estimates and Forecasts, by  Organization Size  (2020-2032) (USD Billion)

10.2.8 Mexico

10.2.8.1 Mexico AI-Enabled GCC Market Estimates and Forecasts, by Services (2020-2032) (USD Billion)

10.2.8.2 Mexico AI-Enabled GCC Market Estimates and Forecasts, by Industry  (2020-2032) (USD Billion)

10.2.8.3 Mexico AI-Enabled GCC Market Estimates and Forecasts, by  Organization Size  (2020-2032) (USD Billion)

10.3 Europe

10.3.1 Eastern Europe

10.3.1.1 Trends Analysis

10.3.1.2 Eastern Europe AI-Enabled GCC Market Estimates and Forecasts, by Country (2020-2032) (USD Billion)

10.3.1.3 Eastern Europe AI-Enabled GCC Market Estimates and Forecasts, by Services (2020-2032) (USD Billion)  

10.3.1.4 Eastern Europe AI-Enabled GCC Market Estimates and Forecasts, by Industry  (2020-2032) (USD Billion)

10.3.1.5 Eastern Europe AI-Enabled GCC Market Estimates and Forecasts, by  Organization Size  (2020-2032) (USD Billion)

10.3.1.6 Poland

10.3.1.6.1 Poland AI-Enabled GCC Market Estimates and Forecasts, by Services (2020-2032) (USD Billion)

10.3.1.6.2 Poland AI-Enabled GCC Market Estimates and Forecasts, by Industry  (2020-2032) (USD Billion)

10.3.1.6.3 Poland AI-Enabled GCC Market Estimates and Forecasts, by  Organization Size  (2020-2032) (USD Billion)

10.3.1.7 Romania

10.3.1.7.1 Romania AI-Enabled GCC Market Estimates and Forecasts, by Services (2020-2032) (USD Billion)

10.3.1.7.2 Romania AI-Enabled GCC Market Estimates and Forecasts, by Industry (2020-2032) (USD Billion)

10.3.1.7.3 Romania AI-Enabled GCC Market Estimates and Forecasts, by Organization Size (2020-2032) (USD Billion)

10.3.1.8 Hungary

10.3.1.8.1 Hungary AI-Enabled GCC Market Estimates and Forecasts, by Services (2020-2032) (USD Billion)

10.3.1.8.2 Hungary AI-Enabled GCC Market Estimates and Forecasts, by Industry  (2020-2032) (USD Billion)

10.3.1.8.3 Hungary AI-Enabled GCC Market Estimates and Forecasts, by  Organization Size  (2020-2032) (USD Billion)

10.3.1.9 Turkey

10.3.1.9.1 Turkey AI-Enabled GCC Market Estimates and Forecasts, by Services (2020-2032) (USD Billion)

10.3.1.9.2 Turkey AI-Enabled GCC Market Estimates and Forecasts, by Industry  (2020-2032) (USD Billion)

10.3.1.9.3 Turkey AI-Enabled GCC Market Estimates and Forecasts, by  Organization Size  (2020-2032) (USD Billion)

10.3.1.10 Rest of Eastern Europe

10.3.1.10.1 Rest of Eastern Europe AI-Enabled GCC Market Estimates and Forecasts, by Services (2020-2032) (USD Billion)

10.3.1.10.2 Rest of Eastern Europe AI-Enabled GCC Market Estimates and Forecasts, by Industry  (2020-2032) (USD Billion)

10.3.1.10.3 Rest of Eastern Europe AI-Enabled GCC Market Estimates and Forecasts, by  Organization Size  (2020-2032) (USD Billion)

10.3.2 Western Europe

10.3.2.1 Trends Analysis

10.3.2.2 Western Europe AI-Enabled GCC Market Estimates and Forecasts, by Country (2020-2032) (USD Billion)

10.3.2.3 Western Europe AI-Enabled GCC Market Estimates and Forecasts, by Services (2020-2032) (USD Billion)  

10.3.2.4 Western Europe AI-Enabled GCC Market Estimates and Forecasts, by Industry  (2020-2032) (USD Billion)

10.3.2.5 Western Europe AI-Enabled GCC Market Estimates and Forecasts, by  Organization Size  (2020-2032) (USD Billion)

10.3.2.6 Germany

10.3.2.6.1 Germany AI-Enabled GCC Market Estimates and Forecasts, by Services (2020-2032) (USD Billion)

10.3.2.6.2 Germany AI-Enabled GCC Market Estimates and Forecasts, by Industry  (2020-2032) (USD Billion)

10.3.2.6.3 Germany AI-Enabled GCC Market Estimates and Forecasts, by  Organization Size  (2020-2032) (USD Billion)

10.3.2.7 France

10.3.2.7.1 France AI-Enabled GCC Market Estimates and Forecasts, by Services (2020-2032) (USD Billion)

10.3.2.7.2 France AI-Enabled GCC Market Estimates and Forecasts, by Industry  (2020-2032) (USD Billion)

10.3.2.7.3 France AI-Enabled GCC Market Estimates and Forecasts, by  Organization Size  (2020-2032) (USD Billion)

10.3.2.8 UK

10.3.2.8.1 UK AI-Enabled GCC Market Estimates and Forecasts, by Services (2020-2032) (USD Billion)

10.3.2.8.2 UK AI-Enabled GCC Market Estimates and Forecasts, by Industry  (2020-2032) (USD Billion)

10.3.2.8.3 UK AI-Enabled GCC Market Estimates and Forecasts, by  Organization Size  (2020-2032) (USD Billion)

10.3.2.9 Italy

10.3.2.9.1 Italy AI-Enabled GCC Market Estimates and Forecasts, by Services (2020-2032) (USD Billion)

10.3.2.9.2 Italy AI-Enabled GCC Market Estimates and Forecasts, by Industry  (2020-2032) (USD Billion)

10.3.2.9.3 Italy AI-Enabled GCC Market Estimates and Forecasts, by  Organization Size  (2020-2032) (USD Billion)

10.3.2.10 Spain

10.3.2.10.1 Spain AI-Enabled GCC Market Estimates and Forecasts, by Services (2020-2032) (USD Billion)

10.3.2.10.2 Spain AI-Enabled GCC Market Estimates and Forecasts, by Industry  (2020-2032) (USD Billion)

10.3.2.10.3 Spain AI-Enabled GCC Market Estimates and Forecasts, by  Organization Size  (2020-2032) (USD Billion)

10.3.2.11 Netherlands

10.3.2.11.1 Netherlands AI-Enabled GCC Market Estimates and Forecasts, by Services (2020-2032) (USD Billion)

10.3.2.11.2 Netherlands AI-Enabled GCC Market Estimates and Forecasts, by Industry  (2020-2032) (USD Billion)

10.3.2.11.3 Netherlands AI-Enabled GCC Market Estimates and Forecasts, by  Organization Size  (2020-2032) (USD Billion)

10.3.2.12 Switzerland

10.3.2.12.1 Switzerland AI-Enabled GCC Market Estimates and Forecasts, by Services (2020-2032) (USD Billion)

10.3.2.12.2 Switzerland AI-Enabled GCC Market Estimates and Forecasts, by Industry  (2020-2032) (USD Billion)

10.3.2.12.3 Switzerland AI-Enabled GCC Market Estimates and Forecasts, by  Organization Size  (2020-2032) (USD Billion)

10.3.2.13 Austria

10.3.2.13.1 Austria AI-Enabled GCC Market Estimates and Forecasts, by Services (2020-2032) (USD Billion)

10.3.2.13.2 Austria AI-Enabled GCC Market Estimates and Forecasts, by Industry  (2020-2032) (USD Billion)

10.3.2.13.3 Austria AI-Enabled GCC Market Estimates and Forecasts, by  Organization Size  (2020-2032) (USD Billion)

10.3.2.14 Rest of Western Europe

10.3.2.14.1 Rest of Western Europe AI-Enabled GCC Market Estimates and Forecasts, by Services (2020-2032) (USD Billion)

10.3.2.14.2 Rest of Western Europe AI-Enabled GCC Market Estimates and Forecasts, by Industry  (2020-2032) (USD Billion)

10.3.2.14.3 Rest of Western Europe AI-Enabled GCC Market Estimates and Forecasts, by  Organization Size  (2020-2032) (USD Billion)

10.4 Asia-Pacific

10.4.1 Trends Analysis

10.4.2 Asia-Pacific AI-Enabled GCC Market Estimates and Forecasts, by Country (2020-2032) (USD Billion)

10.4.3 Asia-Pacific AI-Enabled GCC Market Estimates and Forecasts, by Services (2020-2032) (USD Billion)  

10.4.4 Asia-Pacific AI-Enabled GCC Market Estimates and Forecasts, by Industry  (2020-2032) (USD Billion)

10.4.5 Asia-Pacific AI-Enabled GCC Market Estimates and Forecasts, by  Organization Size  (2020-2032) (USD Billion)

10.4.6 China

10.4.6.1 China AI-Enabled GCC Market Estimates and Forecasts, by Services (2020-2032) (USD Billion)

10.4.6.2 China AI-Enabled GCC Market Estimates and Forecasts, by Industry  (2020-2032) (USD Billion)

10.4.6.3 China AI-Enabled GCC Market Estimates and Forecasts, by  Organization Size  (2020-2032) (USD Billion)

10.4.7 India

10.4.7.1 India AI-Enabled GCC Market Estimates and Forecasts, by Services (2020-2032) (USD Billion)

10.4.7.2 India AI-Enabled GCC Market Estimates and Forecasts, by Industry  (2020-2032) (USD Billion)

10.4.7.3 India AI-Enabled GCC Market Estimates and Forecasts, by  Organization Size  (2020-2032) (USD Billion)

10.4.8 Japan

10.4.8.1 Japan AI-Enabled GCC Market Estimates and Forecasts, by Services (2020-2032) (USD Billion)

10.4.8.2 Japan AI-Enabled GCC Market Estimates and Forecasts, by Industry  (2020-2032) (USD Billion)

10.4.8.3 Japan AI-Enabled GCC Market Estimates and Forecasts, by  Organization Size  (2020-2032) (USD Billion)

10.4.9 South Korea

10.4.9.1 South Korea AI-Enabled GCC Market Estimates and Forecasts, by Services (2020-2032) (USD Billion)

10.4.9.2 South Korea AI-Enabled GCC Market Estimates and Forecasts, by Industry  (2020-2032) (USD Billion)

10.4.9.3 South Korea AI-Enabled GCC Market Estimates and Forecasts, by  Organization Size  (2020-2032) (USD Billion)

10.4.10 Vietnam

10.4.10.1 Vietnam AI-Enabled GCC Market Estimates and Forecasts, by Services (2020-2032) (USD Billion)

10.4.10.2 Vietnam AI-Enabled GCC Market Estimates and Forecasts, by Industry  (2020-2032) (USD Billion)

10.4.10.3 Vietnam AI-Enabled GCC Market Estimates and Forecasts, by  Organization Size  (2020-2032) (USD Billion)

10.4.11 Singapore

10.4.11.1 Singapore AI-Enabled GCC Market Estimates and Forecasts, by Services (2020-2032) (USD Billion)

10.4.11.2 Singapore AI-Enabled GCC Market Estimates and Forecasts, by Industry  (2020-2032) (USD Billion)

10.4.11.3 Singapore AI-Enabled GCC Market Estimates and Forecasts, by  Organization Size  (2020-2032) (USD Billion)

10.4.12 Australia

10.4.12.1 Australia AI-Enabled GCC Market Estimates and Forecasts, by Services (2020-2032) (USD Billion)

10.4.12.2 Australia AI-Enabled GCC Market Estimates and Forecasts, by Industry  (2020-2032) (USD Billion)

10.4.12.3 Australia AI-Enabled GCC Market Estimates and Forecasts, by  Organization Size  (2020-2032) (USD Billion)

10.4.13 Rest of Asia-Pacific

10.4.13.1 Rest of Asia-Pacific AI-Enabled GCC Market Estimates and Forecasts, by Services (2020-2032) (USD Billion)

10.4.13.2 Rest of Asia-Pacific AI-Enabled GCC Market Estimates and Forecasts, by Industry  (2020-2032) (USD Billion)

10.4.13.3 Rest of Asia-Pacific AI-Enabled GCC Market Estimates and Forecasts, by  Organization Size  (2020-2032) (USD Billion)

10.5 Middle East and Africa

10.5.1 Middle East

10.5.1.1 Trends Analysis

10.5.1.2 Middle East AI-Enabled GCC Market Estimates and Forecasts, by Country (2020-2032) (USD Billion)

10.5.1.3 Middle East AI-Enabled GCC Market Estimates and Forecasts, by Services (2020-2032) (USD Billion)  

10.5.1.4 Middle East AI-Enabled GCC Market Estimates and Forecasts, by Industry  (2020-2032) (USD Billion)

10.5.1.5 Middle East AI-Enabled GCC Market Estimates and Forecasts, by  Organization Size  (2020-2032) (USD Billion)

10.5.1.6 UAE

10.5.1.6.1 UAE AI-Enabled GCC Market Estimates and Forecasts, by Services (2020-2032) (USD Billion)

10.5.1.6.2 UAE AI-Enabled GCC Market Estimates and Forecasts, by Industry  (2020-2032) (USD Billion)

10.5.1.6.3 UAE AI-Enabled GCC Market Estimates and Forecasts, by  Organization Size  (2020-2032) (USD Billion)

10.5.1.7 Egypt

10.5.1.7.1 Egypt AI-Enabled GCC Market Estimates and Forecasts, by Services (2020-2032) (USD Billion)

10.5.1.7.2 Egypt AI-Enabled GCC Market Estimates and Forecasts, by Industry  (2020-2032) (USD Billion)

10.5.1.7.3 Egypt AI-Enabled GCC Market Estimates and Forecasts, by  Organization Size  (2020-2032) (USD Billion)

10.5.1.8 Saudi Arabia

10.5.1.8.1 Saudi Arabia AI-Enabled GCC Market Estimates and Forecasts, by Services (2020-2032) (USD Billion)

10.5.1.8.2 Saudi Arabia AI-Enabled GCC Market Estimates and Forecasts, by Industry  (2020-2032) (USD Billion)

10.5.1.8.3 Saudi Arabia AI-Enabled GCC Market Estimates and Forecasts, by  Organization Size  (2020-2032) (USD Billion)

10.5.1.9 Qatar

10.5.1.9.1 Qatar AI-Enabled GCC Market Estimates and Forecasts, by Services (2020-2032) (USD Billion)

10.5.1.9.2 Qatar AI-Enabled GCC Market Estimates and Forecasts, by Industry  (2020-2032) (USD Billion)

10.5.1.9.3 Qatar AI-Enabled GCC Market Estimates and Forecasts, by  Organization Size  (2020-2032) (USD Billion)

10.5.1.10 Rest of Middle East

10.5.1.10.1 Rest of Middle East AI-Enabled GCC Market Estimates and Forecasts, by Services (2020-2032) (USD Billion)

10.5.1.10.2 Rest of Middle East AI-Enabled GCC Market Estimates and Forecasts, by Industry  (2020-2032) (USD Billion)

10.5.1.10.3 Rest of Middle East AI-Enabled GCC Market Estimates and Forecasts, by  Organization Size  (2020-2032) (USD Billion)

10.5.2 Africa

10.5.2.1 Trends Analysis

10.5.2.2 Africa AI-Enabled GCC Market Estimates and Forecasts, by Country (2020-2032) (USD Billion)

10.5.2.3 Africa AI-Enabled GCC Market Estimates and Forecasts, by Services (2020-2032) (USD Billion)  

10.5.2.4 Africa AI-Enabled GCC Market Estimates and Forecasts, by Industry  (2020-2032) (USD Billion)

10.5.2.5 Africa AI-Enabled GCC Market Estimates and Forecasts, by  Organization Size  (2020-2032) (USD Billion)

10.5.2.6 South Africa

10.5.2.6.1 South Africa AI-Enabled GCC Market Estimates and Forecasts, by Services (2020-2032) (USD Billion)

10.5.2.6.2 South Africa AI-Enabled GCC Market Estimates and Forecasts, by Industry  (2020-2032) (USD Billion)

10.5.2.6.3 South Africa AI-Enabled GCC Market Estimates and Forecasts, by  Organization Size  (2020-2032) (USD Billion)

10.5.2.7 Nigeria

10.5.2.7.1 Nigeria AI-Enabled GCC Market Estimates and Forecasts, by Services (2020-2032) (USD Billion)

10.5.2.7.2 Nigeria AI-Enabled GCC Market Estimates and Forecasts, by Industry  (2020-2032) (USD Billion)

10.5.2.7.3 Nigeria AI-Enabled GCC Market Estimates and Forecasts, by  Organization Size  (2020-2032) (USD Billion)

10.5.2.8 Rest of Africa

10.5.2.8.1 Rest of Africa AI-Enabled GCC Market Estimates and Forecasts, by Services (2020-2032) (USD Billion)

10.5.2.8.2 Rest of Africa AI-Enabled GCC Market Estimates and Forecasts, by Industry  (2020-2032) (USD Billion)

10.5.2.8.3 Rest of Africa AI-Enabled GCC Market Estimates and Forecasts, by  Organization Size  (2020-2032) (USD Billion)

10.6 Latin America

10.6.1 Trends Analysis

10.6.2 Latin America AI-Enabled GCC Market Estimates and Forecasts, by Country (2020-2032) (USD Billion)

10.6.3 Latin America AI-Enabled GCC Market Estimates and Forecasts, by Services (2020-2032) (USD Billion)  

10.6.4 Latin America AI-Enabled GCC Market Estimates and Forecasts, by Industry  (2020-2032) (USD Billion)

10.6.5 Latin America AI-Enabled GCC Market Estimates and Forecasts, by  Organization Size  (2020-2032) (USD Billion)

10.6.6 Brazil

10.6.6.1 Brazil AI-Enabled GCC Market Estimates and Forecasts, by Services (2020-2032) (USD Billion)

10.6.6.2 Brazil AI-Enabled GCC Market Estimates and Forecasts, by Industry  (2020-2032) (USD Billion)

10.6.6.3 Brazil AI-Enabled GCC Market Estimates and Forecasts, by  Organization Size  (2020-2032) (USD Billion)

10.6.7 Argentina

10.6.7.1 Argentina AI-Enabled GCC Market Estimates and Forecasts, by Services (2020-2032) (USD Billion)

10.6.7.2 Argentina AI-Enabled GCC Market Estimates and Forecasts, by Industry  (2020-2032) (USD Billion)

10.6.7.3 Argentina AI-Enabled GCC Market Estimates and Forecasts, by  Organization Size  (2020-2032) (USD Billion)

10.6.8 Colombia

10.6.8.1 Colombia AI-Enabled GCC Market Estimates and Forecasts, by Services (2020-2032) (USD Billion)

10.6.8.2 Colombia AI-Enabled GCC Market Estimates and Forecasts, by Industry  (2020-2032) (USD Billion)

10.6.8.3 Colombia AI-Enabled GCC Market Estimates and Forecasts, by  Organization Size  (2020-2032) (USD Billion)

10.6.9 Rest of Latin America

10.6.9.1 Rest of Latin America AI-Enabled GCC Market Estimates and Forecasts, by Services (2020-2032) (USD Billion)

10.6.9.2 Rest of Latin America AI-Enabled GCC Market Estimates and Forecasts, by Industry  (2020-2032) (USD Billion)

10.6.9.3 Rest of Latin America AI-Enabled GCC Market Estimates and Forecasts, by  Organization Size  (2020-2032) (USD Billion)

11. Company Profiles

11.1 Accenture

11.1.1 Company Overview

11.1.2 Financial

11.1.3 Products/ Services Offered

11.1.4 SWOT Analysis

11.2 Tata Consultancy Services

11.2.1 Company Overview

11.2.2 Financial

11.2.3 Products/ Services Offered

11.2.4 SWOT Analysis

11.3 Wipro

11.3.1 Company Overview

11.3.2 Financial

11.3.3 Products/ Services Offered

11.3.4 SWOT Analysis

11.4 Infosys

11.4.1 Company Overview

11.4.2 Financial

11.4.3 Products/ Services Offered

11.4.4 SWOT Analysis

11.5 Cognizant

11.5.1 Company Overview

11.5.2 Financial

11.5.3 Products/ Services Offered

11.5.4 SWOT Analysis

11.6 IBM

11.6.1 Company Overview

11.6.2 Financial

11.6.3 Products/ Services Offered

11.6.4 SWOT Analysis

11.7 Deloitte

11.7.1 Company Overview

11.7.2 Financial

11.7.3 Products/ Services Offered

11.7.4 SWOT Analysis

11.8 Capgemini

11.8.1 Company Overview

11.8.2 Financial

11.8.3 Products/ Services Offered

11.8.4 SWOT Analysis

11.9 Tech Mahindra

11.9.1 Company Overview

11.9.2 Financial

11.9.3 Products/ Services Offered

11.9.4 SWOT Analysis

11.10 HCL Technologies

11.10.1 Company Overview

11.10.2 Financial

11.10.3 Products/ Services Offered

11.10.4 SWOT Analysis

12. Use Cases and Best Practices

13. Conclusion

An accurate research report requires proper strategizing as well as implementation. There are multiple factors involved in the completion of good and accurate research report and selecting the best methodology to compete the research is the toughest part. Since the research reports we provide play a crucial role in any company’s decision-making process, therefore we at SNS Insider always believe that we should choose the best method which gives us results closer to reality. This allows us to reach at a stage wherein we can provide our clients best and accurate investment to output ratio.

Each report that we prepare takes a timeframe of 350-400 business hours for production. Starting from the selection of titles through a couple of in-depth brain storming session to the final QC process before uploading our titles on our website we dedicate around 350 working hours. The titles are selected based on their current market cap and the foreseen CAGR and growth.


The 5 steps process:

Step 1: Secondary Research:

Secondary Research or Desk Research is as the name suggests is a research process wherein, we collect data through the readily available information. In this process we use various paid and unpaid databases which our team has access to and gather data through the same. This includes examining of listed companies’ annual reports, Journals, SEC filling etc. Apart from this our team has access to various associations across the globe across different industries. Lastly, we have exchange relationships with various university as well as individual libraries.

Secondary Research

Step 2: Primary Research

When we talk about primary research, it is a type of study in which the researchers collect relevant data samples directly, rather than relying on previously collected data.  This type of research is focused on gaining content specific facts that can be sued to solve specific problems. Since the collected data is fresh and first hand therefore it makes the study more accurate and genuine.

We at SNS Insider have divided Primary Research into 2 parts.

Part 1 wherein we interview the KOLs of major players as well as the upcoming ones across various geographic regions. This allows us to have their view over the market scenario and acts as an important tool to come closer to the accurate market numbers. As many as 45 paid and unpaid primary interviews are taken from both the demand and supply side of the industry to make sure we land at an accurate judgement and analysis of the market.

This step involves the triangulation of data wherein our team analyses the interview transcripts, online survey responses and observation of on filed participants. The below mentioned chart should give a better understanding of the part 1 of the primary interview.

Primary Research

Part 2: In this part of primary research the data collected via secondary research and the part 1 of the primary research is validated with the interviews from individual consultants and subject matter experts.

Consultants are those set of people who have at least 12 years of experience and expertise within the industry whereas Subject Matter Experts are those with at least 15 years of experience behind their back within the same space. The data with the help of two main processes i.e., FGDs (Focused Group Discussions) and IDs (Individual Discussions). This gives us a 3rd party nonbiased primary view of the market scenario making it a more dependable one while collation of the data pointers.

Step 3: Data Bank Validation

Once all the information is collected via primary and secondary sources, we run that information for data validation. At our intelligence centre our research heads track a lot of information related to the market which includes the quarterly reports, the daily stock prices, and other relevant information. Our data bank server gets updated every fortnight and that is how the information which we collected using our primary and secondary information is revalidated in real time.

Data Bank Validation

Step 4: QA/QC Process

After all the data collection and validation our team does a final level of quality check and quality assurance to get rid of any unwanted or undesired mistakes. This might include but not limited to getting rid of the any typos, duplication of numbers or missing of any important information. The people involved in this process include technical content writers, research heads and graphics people. Once this process is completed the title gets uploader on our platform for our clients to read it.

Step 5: Final QC/QA Process:

This is the last process and comes when the client has ordered the study. In this process a final QA/QC is done before the study is emailed to the client. Since we believe in giving our clients a good experience of our research studies, therefore, to make sure that we do not lack at our end in any way humanly possible we do a final round of quality check and then dispatch the study to the client.

Key Segments:

By Service Type:

  • Information Technology (IT) Services

  • Business Process Management (BPM)

  • Knowledge Process Outsourcing (KPO)

  • Engineering and R&D Services

By Industry Vertical:

  • Banking, Financial Services, and Insurance (BFSI)

  • Healthcare and Life Sciences

  • Retail and Consumer Goods

  • Manufacturing and Automotive

  • Telecom & IT

By Organization Size:

  • Large Enterprises 

  • Small and Medium Enterprises (SMEs)

Request for Segment Customization as per your Business Requirement: Segment Customization Request

REGIONAL COVERAGE:

North America

  • US

  • Canada

  • Mexico

Europe

  • Eastern Europe

    • Poland

    • Romania

    • Hungary

    • Turkey

    • Rest of Eastern Europe

  • Western Europe

    • Germany

    • France

    • UK

    • Italy

    • Spain

    • Netherlands

    • Switzerland

    • Austria

    • Rest of Western Europe

Asia-Pacific

  • China

  • India

  • Japan

  • South Korea

  • Vietnam

  • Singapore

  • Australia

  • Rest of Asia Pacific

Middle East & Africa

  • Middle East

    • UAE

    • Egypt

    • Saudi Arabia

    • Qatar

    • Rest of the Middle East

  • Africa

    • Nigeria

    • South Africa

    • Rest of Africa

Latin America

  • Brazil

  • Argentina

  • Colombia

  • Rest of Latin America

Request for Country Level Research Report: Country Level Customization Request

Available Customization

With the given market data, SNS Insider offers customization as per the company’s specific needs. The following customization options are available for the report:

  • Product Analysis

  • Criss-Cross segment analysis (e.g. Product X Application)

  • Product Matrix which gives a detailed comparison of the product portfolio of each company

  • Geographic Analysis

  • Additional countries in any of the regions

  • Company Information

  • Detailed analysis and profiling of additional market players (Up to five)


  •            5000 (33% Discount)


  •            8950 (40% Discount)


  •            3050 (23% Discount)

Start a Conversation

Hi! Click one of our member below to chat on Phone