image

AI CHIP MARKET REPORT SCOPE & OVERVIEW:

AI Chip Market,Revenue Analysis

Get More Information on AI Chip Market - Request Sample Report

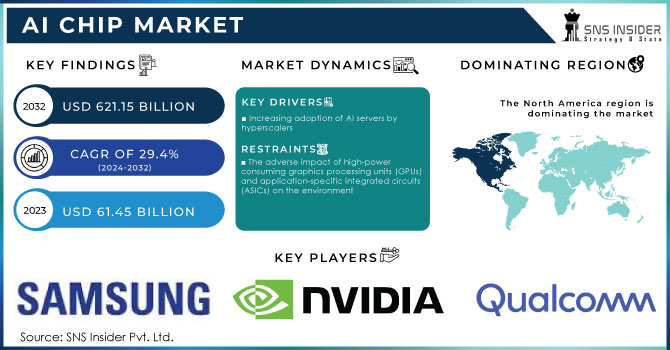
The AI Chip Market Size was valued at USD 61.45 Billion in 2023 and is expected to reach USD 621.15 Billion by 2032 and grow at a CAGR of 29.4% over the forecast period 2024-2032.

The growing consumption of AI servers by hyperscalers and the increasing demand for Generative AI technologies and applications, which include GenAI and AIoT, in BFSI, healthcare, retail & e-commerce, and media & entertainment are driving factors for this market of AI chips. by 2024, AI chips will find their way into the data centers alone, generating $21 billion in revenue this year and growing further at a compound annual rate of nearly 12% to $33 billion by 2028.

The company's fifth annual Global Technology Report, with the market for AI and its hardware continuing to expand, indicates that it will continue growing at 40-55% a year and lead to revenues of between US$780bn to US$990bn. The report looks at AI and its sweeping impact on industry structure, enterprise value, data centers, and business opportunities, among other areas.

AI servers host AI chips to leverage high-speed parallel processing to achieve high-performance efficiency and to effectively handle AI workloads in the cloud data center ecosystem. Other factors include the rising adoption of edge AI computing along with a focus on real-time data processing and strong government-led investments in AI infrastructure development predominantly in the Asia Pacific economies, contributing to the growth of the AI chip market.

AI Chip Market Dynamics

Key Drivers:

  • Increasing adoption of AI servers by hyperscalers

BFSI, healthcare, retail, media, and automotive among others, increased their deployment of AI servers; data centers and cloud providers upgraded infrastructures to support the growing applications of AI. AI server penetration was at 8.8% in 2023 and is expected to increase to 32% by 2030, mainly because of improved use of chatbots, AI of Things, predictive analytics, and NLPs. These all require strong servers to accommodate massive computations and data required in training the AI model.

A recent article stated that hyperscalers such as AWS, Google Cloud, and Microsoft Azure are investing heavily in the area of AI technologies to address this demand. These companies are pushing AI into their cloud platforms so more enterprises can harness the power of next-generation machine learning capabilities and high-performance infrastructure. Cloud spending continues to grow as enterprises need scalable AI-infused solutions. The investment by hyperscalers will fuel an even greater demand for AI servers and chips, furthering the power of AI for all industries. This integrates the original content from the article with other unique insights on hyperscalers investing in AI to fuel their growth in cloud infrastructure.

Restrain:

  • The adverse impact of high-power consuming graphics processing units (GPUs) and application-specific integrated circuits (ASICs) on the environment

Data centers and other infrastructure supporting AI workloads use GPUs and ASICs with parallel processing features. This makes them suitable for handling complex AI workloads; however, parallel processing in GPUs results in high power consumption. This increases energy costs for data centers and organizations deploying AI infrastructure. AI systems can handle large-scale AI operations; however, they also consume significant power to carry out these functions.

Datacenter processor shipments for AI acceleration were growing strongly in 2023, and this trend is expected to continue in 2024 and 2025. Yole Group expects the datacenter GPU market to grow to US$162 billion in 2029, representing an almost 26% CAGR between 2023 and 2029. Among these data center GPUs, the flagship segment with GPUs such as Nvidia H100, B100, and AMD MI300, which are mainly used for generative AI training and inferences, is expected to grow. AI ASICs are also growing strongly to a US$ 71 billion market in 2029, representing a 35% CAGR.

GPUs and ASICs work in parallel with thousands of cores. This requires immense computational power to carry out advanced AI workloads, including deep learning training and large-scale simulations. Hence, companies adopt network components with higher thermal design power (TDP) values. GPUs with higher TDP are in demand due to their better performance.

Therefore, AI chip manufacturers are focused on developing GPUs with a high TDP range. For example, in August 2022, Intel Corporation (US) launched the Flex140 data center GPU, followed by the Max 1450 GPU in October 2023, both with a TDP rating of around 600 watts compared to their older versions, such as Flex 140 GPU and Flex 170 GPU, both having TDP 150 watts. As data-intensive computing requirements continue to rise, manufacturers are developing chips with high processing power. However, the high energy consumption of GPUs and ASICs raises concerns about the environmental impact, particularly in terms of carbon emissions and sustainability. As governments push for greener practices, the environmental footprint of AI hardware could become a critical factor in decision-making, limiting the adoption of high-power-consuming chips.

AI Chip Market - Key Segments

By Chip Type

GPU segment is expected to record the largest market share of 34% during the forecast period. GPUs can effectively handle huge computational loads required to train and run deep learning models using complex matrix multiplications. This makes them vital in data centers and AI research, where the fast growth of AI applications calls for efficient hardware solutions.

New GPUs, which enhance AI capabilities not only for data centers but also at the edge, are constantly developed and released by major manufacturers such as NVIDIA Corporation (US), Intel Corporation (US), and Advanced Micro Devices, Inc. (US). For example, in November 2023, NVIDIA Corporation released an upgraded HGX H200 platform based on Hopper architecture featuring the H200 Tensor core GPU. The first GPU to pack HBM3e memory provides 141 GB of memory at a blazing speed of 4.8 terabytes per second.

Leading cloud service providers, including Amazon Web Services, Inc.; Google Cloud; Microsoft Azure; and Oracle Cloud Infrastructure, are committed to deploying H200-based GPUs to prove that GPUs are one of the critical components of the cloud computing ecosystem. Improvements in GPU memory capabilities and the growing adoption of highly advanced GPUs by cloud service providers will further accelerate market growth.

By Function

The inference segment dominated the AI chip market in the year 2023, and it is expected to grow at the highest CAGR of 30.38% during the forecast period. Inference utilizes pre-trained AI models and makes predictive or timely decisions based on new data. With the rise of AI, there is an added need for more potent inference capabilities within the data center, as businesses begin to focus more on AI integration in their efforts to speed up production efficiency, customer experience, and innovation requirements.

Data centers are scaling fast with AI capabilities. The demand for both efficiency and performance in inference processing further underscores this regard. Another critical factor supporting the expanding growth of the AI chip market is the progressively growing necessity for more energy-efficient and high-performing inference chips. For example, SEMIFIVE recently released its 14 nm AI Inference SoC Platform developed together with South Korea's Mobilint, Inc. This is an inference-focused platform that comes with a quad-core high-performance 64-bit CPU, PCIe Gen4 interfaces, and LPDDR4 memory channels.

The solution aims at custom AI chips, which include ASICs. Such a chip is made to power data center accelerators, AI vision processors, and big data analytics tools implemented for image and video recognition. Altogether, such tools rely a lot on efficient and scalable inference processing. Developing AI inference SoC platforms sets the foundation for the increased demand for special-purpose solutions for hardware, which will help enhance the work performance of inference workloads inside data centers.

By Technology

The Generative AI technology will most likely hold onto the AI chip market share, which is estimated at 24% in the forecast period. It seeks high-quality content generation models, whether texts, images, or codes.

As Generative AI models are becoming increasingly complex, requirements from data center service providers for AI chips in terms of higher processing capabilities and memory bandwidth will increase. GenAI applications have also penetrated at a considerably high rate across retail & e-commerce, BFSI, healthcare, media & entertainment enterprises, and dynamic applications such as NLP, content generation, and automated design generation and process. With the increasing demand for GenAI solutions in such industries, growth in the AI chip market is anticipated to be strong in the coming years.

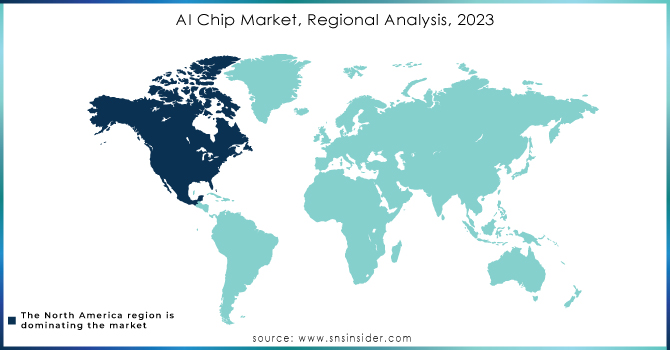
AI Chip Market Regional Analysis

The North American market is expected to grow at a CAGR of 31.78% over the next forecast period. This was mainly because many U.S.-based tech giants are very prevalent in the AI chipsets market and new emerging AI companies in the region. Rising demand for AI technology in the various end-user industries, such as healthcare, automotive, retail, agriculture, manufacturing, marketing, law, and fintech, are significant factors driving the market growth in North America. A large number of people having augmented buying power, continuous investments in infrastructure, and more concentration on having in-house AI applications production will impel the artificial intelligence chipset market growth in the coming years.

The Asia-Pacific dominated the AI Chip Market accounting for a market share of around 33% in 2023. The growing demand for artificial intelligence in end-user industries such as healthcare, manufacturing, and automotive in a country like China, Japan, South Korea, and Australia is said to drive this niche globally. India is likely to contribute the most to the same shortly. For instance, Mumbai-based Yotta Data Services, backed by Hiranandani Group, has already ordered 16,000 GPUs from Nvidia to capitalize on the increasing demand for cloud-based AI development and applications. The APAC market is experiencing growth, mainly because of the falling cost of AI hardware and its increasing adoption to enhance customer services.

AI-Chip-Market-Regional-Analysis-2023

Need any customization research on AI Chip Market - Enquiry Now

Key players 

Some of the major players in the AI Chip Market are:

  • NVIDIA Corporation (NVIDIA A100 Tensor Core GPU, NVIDIA Jetson AGX Xavier)

  • Intel Corporation (Intel Xeon Scalable Processors with AI Acceleration, Intel Nervana Neural Network Processor)

  • Xilinx Inc. (Versal AI Core, Kria SOMs)

  • Samsung Electronics Co., Ltd. (Exynos AI Processor, Samsung AI Accelerator)

  • Micron Technology (Micron AI Accelerator, Micron AI Memory)

  • Qualcomm Technologies (Snapdragon 8 Series Processors, Qualcomm AI Engine)

  • IBM Corporation (IBM Power Systems with AI, IBM TrueNorth)

  • Google Inc. (Tensor Processing Unit (TPU), Edge TPU)

  • Microsoft Corporation (Azure Machine Learning, Project Brainwave)

  • Apple Inc. (Apple Neural Engine, Apple Silicon)

  • Amazon Web Services (AWS) (AWS Inferentia, AWS Trainium)

  • Advanced Micro Devices, Inc. (AMD Radeon Instinct GPUs, AMD EPYC Processors with AI Acceleration)

  • Graphcore (Graphcore IPU, Graphcore Poplar SDK)

  • General Vision (GV1, GV2)

  • Mellanox Technologies (ConnectX-6, BlueField-2)

  • Huawei Technologies Co. Ltd. (Ascend AI Processor, MindSphere)

  • Fujitsu (Fujitsu A64FX, Fujitsu PRIMEHPC FX100)

  • Wave Computing (Wave Processor, Wave Computing Cloud)

  • Mythic Inc. (Mythic MCU, Mythic AI Platform)

  • Adapteva (Parallel Processing Unit (PPU), Adapteva Epiphany)

  • Koniku (Koniku Labs Neural Processor, Koniku Labs Neuro-AI Platform)

  • Tenstorrent (Tenstorrent Processor, Tenstorrent AI Platform)

Recent Trends

  • In June 2024, Advanced Micro Devices, Inc. (US) released AMD Ryzen AI 300 Series processors with strong NPUs offering 50 TOPS AI-processing power for the next-generation AI PCs. These processors are the first based on the new Zen5 architecture with 12 high-performance CPU cores that offer advanced AI architecture for gaming and productivity.

  • In May 2024, Google introduced its sixth-generation TPU in the US called Trillium that has improved upon training and serving times for AI workloads and an accelerated clock speed. While it also features a bigger matrix multiply units, it is said that Trillium TPU is going to fuel the next wave of AI models.

  • In April 2024Micron Technology, Inc. US) and Silvaco Group, Inc. US) expanded the cooperation to develop an AI-based offering: Fab Technology Co-Optimization FTCO. With FTCO, customers are enabled to perform machine learning software simulations using manufacturing data to create a computer model to simulate the entire wafer fabrication process. Micron Technology, Inc. has invested USD 5 million in the development of FTCO.

AI Chip Market Report Scope:

Report Attributes Details
Market Size in 2023 US$ 61.45 Billion
Market Size by 2032 US$ 621.15 Billion
CAGR CAGR of 29.4 % From 2024 to 2032
Base Year 2023
Forecast Period 2024-2032
Historical Data 2020-2022
Report Scope & Coverage Market Size, Segments Analysis, Competitive  Landscape, Regional Analysis, DROC & SWOT Analysis, Forecast Outlook
Key Segments •By Technology (Generative AI, Machine Learning, Natural Language Processing, Computer Vision)
•By Chip Type (CPU, GPU, ASIC, FPGA, Others)
•By Function (Training, Inference)
•By End-User (Consumer, Data Center, Government Organizations)
Regional Analysis/Coverage North America (US, Canada, Mexico), Europe (Eastern Europe [Poland, Romania, Hungary, Turkey, Rest of Eastern Europe] Western Europe] Germany, France, UK, Italy, Spain, Netherlands, Switzerland, Austria, Rest of Western Europe]), Asia Pacific (China, India, Japan, South Korea, Vietnam, Singapore, Australia, Rest of Asia Pacific), Middle East & Africa (Middle East [UAE, Egypt, Saudi Arabia, Qatar, Rest of Middle East], Africa [Nigeria, South Africa, Rest of Africa], Latin America (Brazil, Argentina, Colombia, Rest of Latin America)
Company Profiles NVIDIA Corporation, Intel Corporation, Xilinx Inc., Samsung Electronics Co., Ltd., Micron Technology, Qualcomm Technologies, IBM Corporation, Google Inc., Microsoft Corporation, Apple Inc., Amazon Web Services (AWS), Advanced Micro Devices, Inc., Graphcore, General Vision, Mellanox Technologies, Huawei Technologies Co. Ltd., Fujitsu, Wave Computing, Mythic Inc., Adapteva 
Key Drivers • Increasing adoption of AI servers by hyperscalers
Restraints • The adverse impact of high-power consuming graphics processing units (GPUs) and application-specific integrated circuits (ASICs) on the environment

Frequently Asked Questions

The AI Chip Market is expected to grow at a CAGR of 29.4% during 2024-2032.

AI Chip Market size was USD 61.45 billion in 2023 and is expected to Reach USD 621.15 billion by 2032.

The major growth factor of the AI chip market is the increasing demand for AI-powered applications across various industries, driven by advancements in AI algorithms, data availability, and cloud computing infrastructure.

Europe dominated the AI chip market in 2023.

The Generative AI segment dominated the AI chip market.

TABLE OF CONTENTS

1. Introduction

1.1 Market Definition

1.2 Scope (Inclusion and Exclusions)

1.3 Research Assumptions

2. Executive Summary

2.1 Market Overview

2.2 Regional Synopsis

2.3 Competitive Summary

3. Research Methodology

3.1 Top-Down Approach

3.2 Bottom-up Approach

3.3. Data Validation

3.4 Primary Interviews

4. Market Dynamics Impact Analysis

4.1 Market Driving Factors Analysis

4.1.1 Drivers

4.1.2 Restraints

4.1.3 Opportunities

4.1.4 Challenges

4.2 PESTLE Analysis

4.3 Porter’s Five Forces Model

5. Statistical Insights and Trends Reporting

       5.1 Wafer Production Volumes, by Region (2023)

       5.2Chip Design Trends (Historic and Future)

       5.3 Fab Capacity Utilization (2023)

       5.4 Supply Chain Metrics

6. Competitive Landscape

6.1 List of Major Companies, by Region

6.2 Market Share Analysis, by Region

6.3 Product Benchmarking

6.3.1 Product specifications and features

6.3.2 Pricing

6.4 Strategic Initiatives

6.4.1 Marketing and promotional activities

6.4.2 Distribution and supply chain strategies

6.4.3 Expansion plans and new product launches

6.4.4 Strategic partnerships and collaborations

6.5 Technological Advancements

6.6 Market Positioning and Branding

7. AI Chip Market Segmentation, by Chip Type

7.1 Chapter Overview

7.2 CPU

7.2.1 CPU Market Trends Analysis (2020-2032)

7.2.2 CPU Market Size Estimates and Forecasts to 2032 (USD Million)

7.3 GPU

        7.3.1 GPU Market Trends Analysis (2020-2032)

7.3.2 GPU Market Size Estimates and Forecasts to 2032 (USD Million)

7.4 ASIC

         7.4.1 ASIC Market Trends Analysis (2020-2032)

7.4.2 ASIC Market Size Estimates and Forecasts to 2032 (USD Million)

7.5 FPGA

7.5.1 FPGA Market Trends Analysis (2020-2032)

7.5.2 FPGA Market Size Estimates and Forecasts to 2032 (USD Million)

7.6 others

7.6.1 others Market Trends Analysis (2020-2032)

7.6.2 others Market Size Estimates and Forecasts to 2032 (USD Million)

8. AI Chip Market Segmentation, by Technology

8.1 Chapter Overview

8.2 Generative AI

        8.2.1 Generative AI Market Trends Analysis (2020-2032)

8.2.2 Generative AI Market Size Estimates and Forecasts to 2032 (USD Million)

8.3 Machine Learning

8.3.1 Machine Learning Market Trends Analysis (2020-2032)

8.3.2 Machine Learning Market Size Estimates and Forecasts to 2032 (USD Million)

8.4 Natural Language Processing

        8.4.1 Natural Language Processing Market Trends Analysis (2020-2032)

8.4.2 Natural Language Processing Market Size Estimates and Forecasts to 2032 (USD Million)

8.5 Computer Vision

8.5.1 Computer Vision Market Trends Analysis (2020-2032)

8.5.2 Computer Vision Market Size Estimates and Forecasts to 2032 (USD Million)

9. AI Chip Market Segmentation, by End User

9.1 Chapter Overview

9.2 Consumer

9.2.1 Consumer Market Trends Analysis (2020-2032)

9.2.2 Consumer Market Size Estimates and Forecasts to 2032 (USD Million)

9.3 Data Center

9.3.1 Data Center Market Trends Analysis (2020-2032)

9.3.2 Data Center Market Size Estimates and Forecasts to 2032 (USD Million)

9.4 Government Organizations

               9.4.1 Government Organizations Market Trends Analysis (2020-2032)

9.4.2 Government Organizations Market Size Estimates and Forecasts to 2032 (USD Million)

10. AI Chip Market Segmentation, by Function

10.1 Chapter Overview

10.2 Training

10.2.1 Training Market Trends Analysis (2020-2032)

10.2.2 Training Market Size Estimates and Forecasts to 2032 (USD Million)

10.3 Inference

10.3.1 Inference Market Trends Analysis (2020-2032)

10.3.2 Inference Market Size Estimates and Forecasts to 2032 (USD Million)

11. Regional Analysis

11.1 Chapter Overview

11.2 North America

11.2.1 Trends Analysis

11.2.2 North America AI Chip Market Estimates and Forecasts, by Country (2020-2032) (USD Million)

11.2.3 North America AI Chip Market Estimates and Forecasts, by Chip Type (2020-2032) (USD Million)  

11.2.4 North America AI Chip Market Estimates and Forecasts, by Technology (2020-2032) (USD Million)

11.2.5 North America AI Chip Market Estimates and Forecasts, by End User (2020-2032) (USD Million)

11.2.6 North America AI Chip Market Estimates and Forecasts, by Function (2020-2032) (USD Million)

11.2.7 USA

11.2.7.1 USA AI Chip Market Estimates and Forecasts, by Chip Type (2020-2032) (USD Million)

11.2.7.2 USA AI Chip Market Estimates and Forecasts, by Technology (2020-2032) (USD Million)

11.2.7.3 USA AI Chip Market Estimates and Forecasts, by End User (2020-2032) (USD Million)

11.2.7.4 USA AI Chip Market Estimates and Forecasts, by Function (2020-2032) (USD Million)

11.2.8 Canada

11.2.8.1 Canada AI Chip Market Estimates and Forecasts, by Chip Type (2020-2032) (USD Million)

11.2.8.2 Canada AI Chip Market Estimates and Forecasts, by Technology (2020-2032) (USD Million)

11.2.8.3 Canada AI Chip Market Estimates and Forecasts, by End User (2020-2032) (USD Million)

11.2.8.4 Canada AI Chip Market Estimates and Forecasts, by Function (2020-2032) (USD Million)

11.2.9 Mexico

11.2.9.1 Mexico AI Chip Market Estimates and Forecasts, by Chip Type (2020-2032) (USD Million)

11.2.9.2 Mexico AI Chip Market Estimates and Forecasts, by Technology (2020-2032) (USD Million)

11.2.9.3 Mexico AI Chip Market Estimates and Forecasts, by End User (2020-2032) (USD Million)

11.2.9.4 Mexico AI Chip Market Estimates and Forecasts, by Function (2020-2032) (USD Million)

11.3 Europe

11.3.1 Eastern Europe

11.3.1.1 Trends Analysis

11.3.1.2 Eastern Europe AI Chip Market Estimates and Forecasts, by Country (2020-2032) (USD Million)

11.3.1.3 Eastern Europe AI Chip Market Estimates and Forecasts, by Chip Type (2020-2032) (USD Million)  

11.3.1.4 Eastern Europe AI Chip Market Estimates and Forecasts, by Technology (2020-2032) (USD Million)

11.3.1.5 Eastern Europe AI Chip Market Estimates and Forecasts, by End User (2020-2032) (USD Million)

11.3.1.6 Eastern Europe AI Chip Market Estimates and Forecasts, by Function (2020-2032) (USD Million)

11.3.1.7 Poland

11.3.1.7.1 Poland AI Chip Market Estimates and Forecasts, by Chip Type (2020-2032) (USD Million)

11.3.1.7.2 Poland AI Chip Market Estimates and Forecasts, by Technology (2020-2032) (USD Million)

11.3.1.7.3 Poland AI Chip Market Estimates and Forecasts, by End User (2020-2032) (USD Million)

11.3.1.7.4 Poland AI Chip Market Estimates and Forecasts, by Function (2020-2032) (USD Million)

11.3.1.8 Romania

11.3.1.8.1 Romania AI Chip Market Estimates and Forecasts, by Chip Type (2020-2032) (USD Million)

11.3.1.8.2 Romania AI Chip Market Estimates and Forecasts, by Technology (2020-2032) (USD Million)

11.3.1.8.3 Romania AI Chip Market Estimates and Forecasts, by End User (2020-2032) (USD Million)

11.3.1.8.4 Romania AI Chip Market Estimates and Forecasts, by Function (2020-2032) (USD Million)

11.3.1.9 Hungary

11.3.1.9.1 Hungary AI Chip Market Estimates and Forecasts, by Chip Type (2020-2032) (USD Million)

11.3.1.9.2 Hungary AI Chip Market Estimates and Forecasts, by Technology (2020-2032) (USD Million)

11.3.1.9.3 Hungary AI Chip Market Estimates and Forecasts, by End User (2020-2032) (USD Million)

11.3.1.9.4 Hungary AI Chip Market Estimates and Forecasts, by Function (2020-2032) (USD Million)

11.3.1.10 Turkey

11.3.1.10.1 Turkey AI Chip Market Estimates and Forecasts, by Chip Type (2020-2032) (USD Million)

11.3.1.10.2 Turkey AI Chip Market Estimates and Forecasts, by Technology (2020-2032) (USD Million)

11.3.1.10.3 Turkey AI Chip Market Estimates and Forecasts, by End User (2020-2032) (USD Million)

11.3.1.10.4 Turkey AI Chip Market Estimates and Forecasts, by Function (2020-2032) (USD Million)

11.3.1.11 Rest of Eastern Europe

11.3.1.11.1 Rest of Eastern Europe AI Chip Market Estimates and Forecasts, by Chip Type (2020-2032) (USD Million)

11.3.1.11.2 Rest of Eastern Europe AI Chip Market Estimates and Forecasts, by Technology (2020-2032) (USD Million)

11.3.1.11.3 Rest of Eastern Europe AI Chip Market Estimates and Forecasts, by End User (2020-2032) (USD Million)

11.3.1.11.4 Rest of Eastern Europe AI Chip Market Estimates and Forecasts, by Function (2020-2032) (USD Million)

11.3.2 Western Europe

11.3.2.1 Trends Analysis

11.3.2.2 Western Europe AI Chip Market Estimates and Forecasts, by Country (2020-2032) (USD Million)

11.3.2.3 Western Europe AI Chip Market Estimates and Forecasts, by Chip Type (2020-2032) (USD Million)  

11.3.2.4 Western Europe AI Chip Market Estimates and Forecasts, by Technology (2020-2032) (USD Million)

11.3.2.5 Western Europe AI Chip Market Estimates and Forecasts, by End User (2020-2032) (USD Million)

11.3.2.6 Western Europe AI Chip Market Estimates and Forecasts, by Function (2020-2032) (USD Million)

11.3.2.7 Germany

11.3.2.7.1 Germany AI Chip Market Estimates and Forecasts, by Chip Type (2020-2032) (USD Million)

11.3.2.7.2 Germany AI Chip Market Estimates and Forecasts, by Technology (2020-2032) (USD Million)

11.3.2.7.3 Germany AI Chip Market Estimates and Forecasts, by End User (2020-2032) (USD Million)

11.3.2.7.4 Germany AI Chip Market Estimates and Forecasts, by Function (2020-2032) (USD Million)

11.3.2.8 France

11.3.2.8.1 France AI Chip Market Estimates and Forecasts, by Chip Type (2020-2032) (USD Million)

11.3.2.8.2 France AI Chip Market Estimates and Forecasts, by Technology (2020-2032) (USD Million)

11.3.2.8.3 France AI Chip Market Estimates and Forecasts, by End User (2020-2032) (USD Million)

11.3.2.8.4 France AI Chip Market Estimates and Forecasts, by Function (2020-2032) (USD Million)

11.3.2.9 UK

11.3.2.9.1 UK AI Chip Market Estimates and Forecasts, by Chip Type (2020-2032) (USD Million)

11.3.2.9.2 UK AI Chip Market Estimates and Forecasts, by Technology (2020-2032) (USD Million)

11.3.2.9.3 UK AI Chip Market Estimates and Forecasts, by End User (2020-2032) (USD Million)

11.3.2.9.4 UK AI Chip Market Estimates and Forecasts, by Function (2020-2032) (USD Million)

11.3.2.10 Italy

11.3.2.10.1 Italy AI Chip Market Estimates and Forecasts, by Chip Type (2020-2032) (USD Million)

11.3.2.10.2 Italy AI Chip Market Estimates and Forecasts, by Technology (2020-2032) (USD Million)

11.3.2.10.3 Italy AI Chip Market Estimates and Forecasts, by End User (2020-2032) (USD Million)

11.3.2.10.4 Italy AI Chip Market Estimates and Forecasts, by Function (2020-2032) (USD Million)

11.3.2.11 Spain

11.3.2.11.1 Spain AI Chip Market Estimates and Forecasts, by Chip Type (2020-2032) (USD Million)

11.3.2.11.2 Spain AI Chip Market Estimates and Forecasts, by Technology (2020-2032) (USD Million)

11.3.2.11.3 Spain AI Chip Market Estimates and Forecasts, by End User (2020-2032) (USD Million)

11.3.2.11.4 Spain AI Chip Market Estimates and Forecasts, by Function (2020-2032) (USD Million)

11.3.2.12 Netherlands

11.3.2.12.1 Netherlands AI Chip Market Estimates and Forecasts, by Chip Type (2020-2032) (USD Million)

11.3.2.12.2 Netherlands AI Chip Market Estimates and Forecasts, by Technology (2020-2032) (USD Million)

11.3.2.12.3 Netherlands AI Chip Market Estimates and Forecasts, by End User (2020-2032) (USD Million)

11.3.2.12.4 Netherlands AI Chip Market Estimates and Forecasts, by Function (2020-2032) (USD Million)

11.3.2.13 Switzerland

11.3.2.13.1 Switzerland AI Chip Market Estimates and Forecasts, by Chip Type (2020-2032) (USD Million)

11.3.2.13.2 Switzerland AI Chip Market Estimates and Forecasts, by Technology (2020-2032) (USD Million)

11.3.2.13.3 Switzerland AI Chip Market Estimates and Forecasts, by End User (2020-2032) (USD Million)

11.3.2.13.4 Switzerland AI Chip Market Estimates and Forecasts, by Function (2020-2032) (USD Million)

11.3.2.14 Austria

11.3.2.14.1 Austria AI Chip Market Estimates and Forecasts, by Chip Type (2020-2032) (USD Million)

11.3.2.14.2 Austria AI Chip Market Estimates and Forecasts, by Technology (2020-2032) (USD Million)

11.3.2.14.3 Austria AI Chip Market Estimates and Forecasts, by End User (2020-2032) (USD Million)

11.3.2.14.4 Austria AI Chip Market Estimates and Forecasts, by Function (2020-2032) (USD Million)

11.3.2.15 Rest of Western Europe

11.3.2.15.1 Rest of Western Europe AI Chip Market Estimates and Forecasts, by Chip Type (2020-2032) (USD Million)

11.3.2.15.2 Rest of Western Europe AI Chip Market Estimates and Forecasts, by Technology (2020-2032) (USD Million)

11.3.2.15.3 Rest of Western Europe AI Chip Market Estimates and Forecasts, by End User (2020-2032) (USD Million)

11.3.2.15.4 Rest of Western Europe AI Chip Market Estimates and Forecasts, by Function (2020-2032) (USD Million)

11.4 Asia Pacific

11.4.1 Trends Analysis

11.4.2 Asia Pacific AI Chip Market Estimates and Forecasts, by Country (2020-2032) (USD Million)

11.4.3 Asia Pacific AI Chip Market Estimates and Forecasts, by Chip Type (2020-2032) (USD Million)  

11.4.4 Asia Pacific AI Chip Market Estimates and Forecasts, by Technology (2020-2032) (USD Million)

11.4.5 Asia Pacific AI Chip Market Estimates and Forecasts, by End User (2020-2032) (USD Million)

11.4.6 Asia Pacific AI Chip Market Estimates and Forecasts, by Function (2020-2032) (USD Million)

11.4.7 China

11.4.7.1 China AI Chip Market Estimates and Forecasts, by Chip Type (2020-2032) (USD Million)

11.4.7.2 China AI Chip Market Estimates and Forecasts, by Technology (2020-2032) (USD Million)

11.4.7.3 China AI Chip Market Estimates and Forecasts, by End User (2020-2032) (USD Million)

11.4.7.4 China AI Chip Market Estimates and Forecasts, by Function (2020-2032) (USD Million)

11.4.8 India

11.4.8.1 India AI Chip Market Estimates and Forecasts, by Chip Type (2020-2032) (USD Million)

11.4.8.2 India AI Chip Market Estimates and Forecasts, by Technology (2020-2032) (USD Million)

11.4.8.3 India AI Chip Market Estimates and Forecasts, by End User (2020-2032) (USD Million)

11.4.8.4 India AI Chip Market Estimates and Forecasts, by Function (2020-2032) (USD Million)

11.4.9 Japan

11.4.9.1 Japan AI Chip Market Estimates and Forecasts, by Chip Type (2020-2032) (USD Million)

11.4.9.2 Japan AI Chip Market Estimates and Forecasts, by Technology (2020-2032) (USD Million)

11.4.9.3 Japan AI Chip Market Estimates and Forecasts, by End User (2020-2032) (USD Million)

11.4.9.4 Japan AI Chip Market Estimates and Forecasts, by Function (2020-2032) (USD Million)

11.4.10 South Korea

11.4.10.1 South Korea AI Chip Market Estimates and Forecasts, by Chip Type (2020-2032) (USD Million)

11.4.10.2 South Korea AI Chip Market Estimates and Forecasts, by Technology (2020-2032) (USD Million)

11.4.10.3 South Korea AI Chip Market Estimates and Forecasts, by End User (2020-2032) (USD Million)

11.4.10.4 South Korea AI Chip Market Estimates and Forecasts, by Function (2020-2032) (USD Million)

11.4.11 Vietnam

11.4.11.1 Vietnam AI Chip Market Estimates and Forecasts, by Chip Type (2020-2032) (USD Million)

11.4.11.2 Vietnam AI Chip Market Estimates and Forecasts, by Technology (2020-2032) (USD Million)

11.4.11.3 Vietnam AI Chip Market Estimates and Forecasts, by End User (2020-2032) (USD Million)

11.4.11.4 Vietnam AI Chip Market Estimates and Forecasts, by Function (2020-2032) (USD Million)

11.4.12 Singapore

11.4.12.1 Singapore AI Chip Market Estimates and Forecasts, by Chip Type (2020-2032) (USD Million)

11.4.12.2 Singapore AI Chip Market Estimates and Forecasts, by Technology (2020-2032) (USD Million)

11.4.12.3 Singapore AI Chip Market Estimates and Forecasts, by End User (2020-2032) (USD Million)

11.4.12.4 Singapore AI Chip Market Estimates and Forecasts, by Function (2020-2032) (USD Million)

11.4.13 Australia

11.4.13.1 Australia AI Chip Market Estimates and Forecasts, by Chip Type (2020-2032) (USD Million)

11.4.13.2 Australia AI Chip Market Estimates and Forecasts, by Technology (2020-2032) (USD Million)

11.4.13.3 Australia AI Chip Market Estimates and Forecasts, by End User (2020-2032) (USD Million)

11.4.13.4 Australia AI Chip Market Estimates and Forecasts, by Function (2020-2032) (USD Million)

11.4.14 Rest of Asia Pacific

11.4.14.1 Rest of Asia Pacific AI Chip Market Estimates and Forecasts, by Chip Type (2020-2032) (USD Million)

11.4.14.2 Rest of Asia Pacific AI Chip Market Estimates and Forecasts, by Technology (2020-2032) (USD Million)

11.4.14.3 Rest of Asia Pacific AI Chip Market Estimates and Forecasts, by End User (2020-2032) (USD Million)

11.4.14.4 Rest of Asia Pacific AI Chip Market Estimates and Forecasts, by Function (2020-2032) (USD Million)

11.5 Middle East and Africa

11.5.1 Middle East

11.5.1.1 Trends Analysis

11.5.1.2 Middle East AI Chip Market Estimates and Forecasts, by Country (2020-2032) (USD Million)

11.5.1.3 Middle East AI Chip Market Estimates and Forecasts, by Chip Type (2020-2032) (USD Million)  

11.5.1.4 Middle East AI Chip Market Estimates and Forecasts, by Technology (2020-2032) (USD Million)

11.5.1.5 Middle East AI Chip Market Estimates and Forecasts, by End User (2020-2032) (USD Million)

11.5.1.6 Middle East AI Chip Market Estimates and Forecasts, by Function (2020-2032) (USD Million)

11.5.1.7 UAE

11.5.1.7.1 UAE AI Chip Market Estimates and Forecasts, by Chip Type (2020-2032) (USD Million)

11.5.1.7.2 UAE AI Chip Market Estimates and Forecasts, by Technology (2020-2032) (USD Million)

11.5.1.7.3 UAE AI Chip Market Estimates and Forecasts, by End User (2020-2032) (USD Million)

11.5.1.7.4 UAE AI Chip Market Estimates and Forecasts, by Function  (2020-2032) (USD Million)

11.5.1.8 Egypt

11.5.1.8.1 Egypt AI Chip Market Estimates and Forecasts, by Chip Type (2020-2032) (USD Million)

11.5.1.8.2 Egypt AI Chip Market Estimates and Forecasts, by Technology (2020-2032) (USD Million)

11.5.1.8.3 Egypt AI Chip Market Estimates and Forecasts, by End User (2020-2032) (USD Million)

11.5.1.8.4 Egypt AI Chip Market Estimates and Forecasts, by Function (2020-2032) (USD Million)

11.5.1.9 Saudi Arabia

11.5.1.9.1 Saudi Arabia AI Chip Market Estimates and Forecasts, by Chip Type (2020-2032) (USD Million)

11.5.1.9.2 Saudi Arabia AI Chip Market Estimates and Forecasts, by Technology (2020-2032) (USD Million)

11.5.1.9.3 Saudi Arabia AI Chip Market Estimates and Forecasts, by End User (2020-2032) (USD Million)

11.5.1.9.4 Saudi Arabia AI Chip Market Estimates and Forecasts, by Function (2020-2032) (USD Million)

11.5.1.10 Qatar

11.5.1.10.1 Qatar AI Chip Market Estimates and Forecasts, by Chip Type (2020-2032) (USD Million)

11.5.1.10.2 Qatar AI Chip Market Estimates and Forecasts, by Technology (2020-2032) (USD Million)

11.5.1.10.3 Qatar AI Chip Market Estimates and Forecasts, by End User (2020-2032) (USD Million)

11.5.1.10.4 Qatar AI Chip Market Estimates and Forecasts, by Function (2020-2032) (USD Million)

11.5.1.11 Rest of Middle East

11.5.1.11.1 Rest of Middle East AI Chip Market Estimates and Forecasts, by Chip Type (2020-2032) (USD Million)

11.5.1.11.2 Rest of Middle East AI Chip Market Estimates and Forecasts, by Technology (2020-2032) (USD Million)

11.5.1.11.3 Rest of Middle East AI Chip Market Estimates and Forecasts, by End User (2020-2032) (USD Million)

11.5.1.11.4 Rest of Middle East AI Chip Market Estimates and Forecasts, by Function (2020-2032) (USD Million)

11.5.2 Africa

11.5.2.1 Trends Analysis

11.5.2.2 Africa AI Chip Market Estimates and Forecasts, by Country (2020-2032) (USD Million)

11.5.2.3 Africa AI Chip Market Estimates and Forecasts, by Chip Type (2020-2032) (USD Million)  

11.5.2.4 Africa AI Chip Market Estimates and Forecasts, by Technology (2020-2032) (USD Million)

11.5.2.5 Africa AI Chip Market Estimates and Forecasts, by End User (2020-2032) (USD Million)

11.5.2.6 Africa AI Chip Market Estimates and Forecasts, by Function (2020-2032) (USD Million)

11.5.2.7 South Africa

11.5.2.7.1 South Africa AI Chip Market Estimates and Forecasts, by Chip Type (2020-2032) (USD Million)

11.5.2.7.2 South Africa AI Chip Market Estimates and Forecasts, by Technology (2020-2032) (USD Million)

11.5.2.7.3 South Africa AI Chip Market Estimates and Forecasts, by End User (2020-2032) (USD Million)

11.5.2.7.4 South Africa AI Chip Market Estimates and Forecasts, by Function (2020-2032) (USD Million)

11.5.2.8 Nigeria

11.5.2.8.1 Nigeria AI Chip Market Estimates and Forecasts, by Chip Type (2020-2032) (USD Million)

11.5.2.8.2 Nigeria AI Chip Market Estimates and Forecasts, by Technology (2020-2032) (USD Million)

11.5.2.8.3 Nigeria AI Chip Market Estimates and Forecasts, by End User (2020-2032) (USD Million)

11.5.2.8.4 Nigeria AI Chip Market Estimates and Forecasts, by Function (2020-2032) (USD Million)

11.5.2.9 Rest of Africa

11.5.2.9.1 Rest of Africa AI Chip Market Estimates and Forecasts, by Chip Type (2020-2032) (USD Million)

11.5.2.9.2 Rest of Africa AI Chip Market Estimates and Forecasts, by Technology (2020-2032) (USD Million)

11.5.2.9.3 Rest of Africa AI Chip Market Estimates and Forecasts, by End User (2020-2032) (USD Million)

11.5.2.9.4 Rest of Africa AI Chip Market Estimates and Forecasts, by Function (2020-2032) (USD Million)

11.6 Latin America

11.6.1 Trends Analysis

11.6.2 Latin America AI Chip Market Estimates and Forecasts, by Country (2020-2032) (USD Million)

11.6.3 Latin America AI Chip Market Estimates and Forecasts, by Chip Type (2020-2032) (USD Million)  

11.6.4 Latin America AI Chip Market Estimates and Forecasts, by Technology (2020-2032) (USD Million)

11.6.5 Latin America AI Chip Market Estimates and Forecasts, by End User (2020-2032) (USD Million)

11.6.6 Latin America AI Chip Market Estimates and Forecasts, by Function (2020-2032) (USD Million)

11.6.7 Brazil

11.6.7.1 Brazil AI Chip Market Estimates and Forecasts, by Chip Type (2020-2032) (USD Million)

11.6.7.2 Brazil AI Chip Market Estimates and Forecasts, by Technology (2020-2032) (USD Million)

11.6.7.3 Brazil AI Chip Market Estimates and Forecasts, by End User (2020-2032) (USD Million)

11.6.7.4 Brazil AI Chip Market Estimates and Forecasts, by Function (2020-2032) (USD Million)

11.6.8 Argentina

11.6.8.1 Argentina AI Chip Market Estimates and Forecasts, by Chip Type (2020-2032) (USD Million)

11.6.8.2 Argentina AI Chip Market Estimates and Forecasts, by Technology (2020-2032) (USD Million)

11.6.8.3 Argentina AI Chip Market Estimates and Forecasts, by End User (2020-2032) (USD Million)

11.6.8.4 Argentina AI Chip Market Estimates and Forecasts, by Function (2020-2032) (USD Million)

11.6.9 Colombia

11.6.9.1 Colombia AI Chip Market Estimates and Forecasts, by Chip Type (2020-2032) (USD Million)

11.6.9.2 Colombia AI Chip Market Estimates and Forecasts, by Technology (2020-2032) (USD Million)

11.6.9.3 Colombia AI Chip Market Estimates and Forecasts, by End User (2020-2032) (USD Million)

11.6.9.4 Colombia AI Chip Market Estimates and Forecasts, by Function (2020-2032) (USD Million)

11.6.10 Rest of Latin America

11.6.10.1 Rest of Latin America AI Chip Market Estimates and Forecasts, by Chip Type (2020-2032) (USD Million)

11.6.10.2 Rest of Latin America AI Chip Market Estimates and Forecasts, by Technology (2020-2032) (USD Million)

11.6.10.3 Rest of Latin America AI Chip Market Estimates and Forecasts, by End User (2020-2032) (USD Million)

11.6.10.4 Rest of Latin America AI Chip Market Estimates and Forecasts, by Function (2020-2032) (USD Million)

12. Company Profiles

12.1 Nvidia Corporation

12.1.1 Company Overview

12.1.2 Financial

12.1.3 Products/ Services Offered

12.1.4 SWOT Analysis

12.2 Intel Corporation

              12.2.1 Company Overview

12.2.2 Financial

12.2.3 Products/ Services Offered

12.2.4 SWOT Analysis

12.3 Xilinx Inc.

12.3.1 Company Overview

12.3.2 Financial

12.3.3 Products/ Services Offered

12.3.4 SWOT Analysis

12.4 Samsung Electronics Co., Ltd

12.4.1 Company Overview

12.4.2 Financial

12.4.3 Products/ Services Offered

12.4.4 SWOT Analysis

12.5 Micron Technology

12.5.1 Company Overview

12.5.2 Financial

12.5.3 Products/ Services Offered

12.5.4 SWOT Analysis

12.6 Qualcomm Technologies

12.6.1 Company Overview

12.6.2 Financial

12.6.3 Products/ Services Offered

12.6.4 SWOT Analysis

12.7 IBM Corporation

12.7.1 Company Overview

12.7.2 Financial

12.7.3 Products/ Services Offered

12.7.4 SWOT Analysis

12.8 Google Inc.

12.8.1 Company Overview

12.8.2 Financial

12.8.3 Products/ Services Offered

12.8.4 SWOT Analysis

12.9 Apple Inc.

12.9.1 Company Overview

12.9.2 Financial

12.9.3 Products/ Services Offered

12.9.4 SWOT Analysis

12.10 Mellanox Technologies

12.10.1 Company Overview

12.10.2 Financial

12.10.3 Products/ Services Offered

12.10.4 SWOT Analysis

13. Use Cases and Best Practices

14. Conclusion

An accurate research report requires proper strategizing as well as implementation. There are multiple factors involved in the completion of good and accurate research report and selecting the best methodology to compete the research is the toughest part. Since the research reports we provide play a crucial role in any company’s decision-making process, therefore we at SNS Insider always believe that we should choose the best method which gives us results closer to reality. This allows us to reach at a stage wherein we can provide our clients best and accurate investment to output ratio.

Each report that we prepare takes a timeframe of 350-400 business hours for production. Starting from the selection of titles through a couple of in-depth brain storming session to the final QC process before uploading our titles on our website we dedicate around 350 working hours. The titles are selected based on their current market cap and the foreseen CAGR and growth.


The 5 steps process:

Step 1: Secondary Research:

Secondary Research or Desk Research is as the name suggests is a research process wherein, we collect data through the readily available information. In this process we use various paid and unpaid databases which our team has access to and gather data through the same. This includes examining of listed companies’ annual reports, Journals, SEC filling etc. Apart from this our team has access to various associations across the globe across different industries. Lastly, we have exchange relationships with various university as well as individual libraries.

Secondary Research

Step 2: Primary Research

When we talk about primary research, it is a type of study in which the researchers collect relevant data samples directly, rather than relying on previously collected data.  This type of research is focused on gaining content specific facts that can be sued to solve specific problems. Since the collected data is fresh and first hand therefore it makes the study more accurate and genuine.

We at SNS Insider have divided Primary Research into 2 parts.

Part 1 wherein we interview the KOLs of major players as well as the upcoming ones across various geographic regions. This allows us to have their view over the market scenario and acts as an important tool to come closer to the accurate market numbers. As many as 45 paid and unpaid primary interviews are taken from both the demand and supply side of the industry to make sure we land at an accurate judgement and analysis of the market.

This step involves the triangulation of data wherein our team analyses the interview transcripts, online survey responses and observation of on filed participants. The below mentioned chart should give a better understanding of the part 1 of the primary interview.

Primary Research

Part 2: In this part of primary research the data collected via secondary research and the part 1 of the primary research is validated with the interviews from individual consultants and subject matter experts.

Consultants are those set of people who have at least 12 years of experience and expertise within the industry whereas Subject Matter Experts are those with at least 15 years of experience behind their back within the same space. The data with the help of two main processes i.e., FGDs (Focused Group Discussions) and IDs (Individual Discussions). This gives us a 3rd party nonbiased primary view of the market scenario making it a more dependable one while collation of the data pointers.

Step 3: Data Bank Validation

Once all the information is collected via primary and secondary sources, we run that information for data validation. At our intelligence centre our research heads track a lot of information related to the market which includes the quarterly reports, the daily stock prices, and other relevant information. Our data bank server gets updated every fortnight and that is how the information which we collected using our primary and secondary information is revalidated in real time.

Data Bank Validation

Step 4: QA/QC Process

After all the data collection and validation our team does a final level of quality check and quality assurance to get rid of any unwanted or undesired mistakes. This might include but not limited to getting rid of the any typos, duplication of numbers or missing of any important information. The people involved in this process include technical content writers, research heads and graphics people. Once this process is completed the title gets uploader on our platform for our clients to read it.

Step 5: Final QC/QA Process:

This is the last process and comes when the client has ordered the study. In this process a final QA/QC is done before the study is emailed to the client. Since we believe in giving our clients a good experience of our research studies, therefore, to make sure that we do not lack at our end in any way humanly possible we do a final round of quality check and then dispatch the study to the client.

MARKET SEGMENTATION

BY TECHNOLOGY

  • Generative AI

  • Machine Learning

  • Natural Language Processing

  • Computer Vision

BY CHIP TYPE

  • CPU

  • GPU

  • ASIC

  • FPGA

  • Others

BY FUNCTION

  • Training

  • Inference

BY END-USER

  • Consumer

  • Data Center

  • Government Organizations

Request for Segment Customization as per your Business Requirement: Segment Customization Request

REGIONAL COVERAGE:

North America

  • US

  • Canada

  • Mexico

Europe

  • Eastern Europe

    • Poland

    • Romania

    • Hungary

    • Turkey

    • Rest of Eastern Europe

  • Western Europe

    • Germany

    • France

    • UK

    • Italy

    • Spain

    • Netherlands

    • Switzerland

    • Austria

    • Rest of Western Europe

Asia Pacific

  • China

  • India

  • Japan

  • South Korea

  • Vietnam

  • Singapore

  • Australia

  • Rest of Asia Pacific

Middle East & Africa

  • Middle East

    • UAE

    • Egypt

    • Saudi Arabia

    • Qatar

    • Rest of the Middle East

  • Africa

    • Nigeria

    • South Africa

    • Rest of Africa

Latin America

  • Brazil

  • Argentina

  • Colombia

Request for Country Level Research Report: Country Level Customization Request

Available Customization

With the given market data, SNS Insider offers customization as per the company’s specific needs. The following customization options are available for the report:

  • Product Analysis

  • Criss-Cross segment analysis (e.g. Product X Application)

  • Product Matrix which gives a detailed comparison of product portfolio of each company

  • Geographic Analysis

  • Additional countries in any of the regions

  • Company Information

  • Detailed analysis and profiling of additional market players (Up to five)


  •            5000 (33% Discount)


  •            8950 (40% Discount)


  •            3050 (23% Discount)

Start a Conversation

Hi! Click one of our member below to chat on Phone