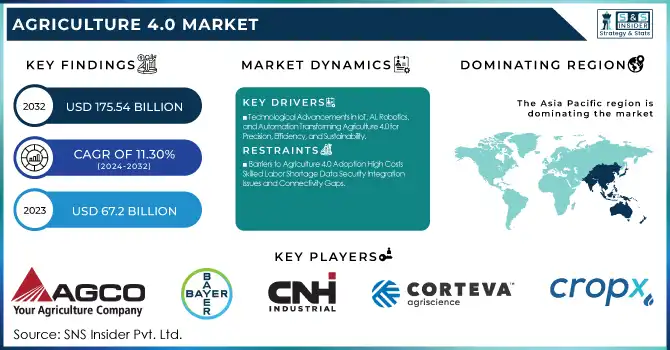
The Agriculture 4.0 Market Size was valued at USD 67.2 billion in 2023 and is expected to reach USD 175.54 billion by 2032, growing at a CAGR of 11.30% from 2024-2032. This report includes an in-depth analysis of key factors driving market growth, such as the adoption rate of advanced technologies, investment and funding trends in agricultural innovations, and the environmental impact metrics of modern farming practices.
Get more information on Agriculture 4.0 Market - Request Sample Report
Additionally, the report covers evolving consumer trends, including demand for sustainable and efficient farming solutions, and the transformation of supply chains through digitalization and automation. Agriculture 4.0 is poised to revolutionize the sector, driving sustainable practices while enhancing productivity across the global agricultural landscape.
Drivers
Technological Advancements in IoT, AI, Robotics, and Automation Transforming Agriculture 4.0 for Precision, Efficiency, and Sustainability
The widespread adoption of IoT, AI, robotics, and automation in agriculture is revolutionizing farm operations. These new technologies allow precision agriculture, with real-time data collection and analysis to optimize crop output and resource efficiency. Mechanized equipment and robots automate work such as sowing, reaping, and pest management, lessening the reliance on human labor and cutting down on errors. Furthermore, AI-based systems provide predictive insights that forecast crop health problems and climatic fluctuations, leading to improved decision-making. Consequently, these technologies are improving efficiency, sustainability, and profitability, propelling the farming industry towards a smarter, more integrated future, while mitigating issues such as climate change and labor shortages. This change is propelling the development and growth of Agriculture 4.0.
Restraints
Barriers to Agriculture 4.0 Adoption High Costs Skilled Labor Shortage Data Security Integration Issues and Connectivity Gaps
The high upfront cost of adopting sophisticated technologies such as AI, robotics, and IoT systems is a major barrier, especially for small farmers and agribusinesses. Most are unable to pay the initial fees of technology adoption, which hinders them from competing in a technology-based market. Furthermore, an insufficient number of skilled laborers who can manage and maintain these advanced systems makes widespread adoption even more challenging. Data security and privacy issues also become threats, as agricultural operations increasingly rely on cloud-based systems and data exchange. Integration issues with current infrastructure and regulatory risks in certain areas hold back market advancement. In addition, unequal availability of technology across rural areas, especially poor internet connectivity, slows down the acceptance of Agriculture 4.0 solutions.
Opportunities
Growth prospects for Agriculture 4.0 driven by big data, sustainability, innovation, government support, and advancements in AI, IoT, and robotics.
The growing use of Big Data and analytics is transforming decision-making in agriculture so that farmers can maximize the allocation of resources, forecast yields, and maximize overall productivity. Further, the demand for sustainable farming methods is boosting the requirement for technology that minimizes waste and environmental footprints. In developing economies, government incentives and increased awareness of smart farm methods hold considerable growth potential, and increasing technological innovation in AI, IoT, and robotics provides scope for ongoing innovation. Intersectoral collaboration between agricultural players and technology firms will additionally spur adoption. Additionally, the advent of livestock monitoring is creating new opportunities for enhancing animal welfare, health, and productivity, fueling market growth. These factors collectively offer significant growth prospects for Agriculture 4.0.
Challenges
Challenges to Agriculture 4.0 adoption include data security, high costs, lack of expertise, poor infrastructure, and regulatory inconsistencies.
As agriculture increasingly embraces data-driven technologies, ensuring the privacy and security of sensitive farming information becomes a critical concern. The complexity of implementing and maintaining advanced technologies like AI, IoT, and robotics presents challenges, especially for farmers with limited technical expertise. In addition, the expensive initial cost of these systems acts as a hindrance for limited-scale and resource-limited farmers. Poor infrastructure and inconsistent internet connectivity in most rural settlements limit the implementation of digital farming solutions. In addition, variable regulations across regions may hinder market growth. There is also change resistance, as conventional farming practices and reluctance to use new technologies are common. All these factors combined stifle the general uptake and development of Agriculture 4.0 technologies.
By Application
The farming segment led the Agriculture 4.0 market with the largest revenue share of approximately 25% in 2023. This is fueled by the growing use of sophisticated technologies like AI, IoT, and robotics for Smart agriculture. These technologies enable farmers to maximize the use of resources, improve productivity, and enhance crop yields, thereby boosting their operational efficiency. Increasing application of sustainable farm practices, complemented by requirement for data-led decision-making further supports the sector's market supremacy.
The Smart Greenhouse segment is expected to expand with the fastest CAGR of roughly 13.77% over the period from 2024-2032. This will be mainly triggered by increasing necessity for controlled environment agriculture that sustains maximum agricultural production with lower resource utilization. Smart greenhouses with automation, sensors, and data analytics enable real-time monitoring of conditions such as temperature, humidity, and soil conditions, enhancing crop health and yield. The growth of this segment is also driven by the growing emphasis on sustainable agriculture practices.
By Component
The hardware segment led the Agriculture 4.0 market with the largest revenue share of approximately 56% in 2023. This is fueled by the extensive use of sophisticated agricultural machinery, sensors, drones, and automated systems that are the core of Precision farming. These technologies allow farmers to enhance operational efficiency, lower costs, and enhance yields. The growing need for automation, IoT integration, and real-time data collection further reinforces the hardware segment's dominant position in the market.
The services segment is expected to expand at the fastest CAGR of around 13.37% between 2024-2032. This is because the increasing demand for data analytics, cloud services, and consulting that facilitate the adoption and optimization of cutting-edge agricultural technology is driving growth. With more farmers turning to data-driven insights for decision-making, the demand for services such as system integration, maintenance, and technical support is increasing quickly, helping the segment grow at a faster rate.
By End-use
The agro-forestry segment was the leader in the Agriculture 4.0 market with the largest revenue share of approximately 40% in 2023. This is mainly attributed to the increasing focus on sustainable land management and incorporating trees into farm systems. Agro-forestry activities improve soil health, increase biodiversity, and assist in climate change mitigation. Also, advances in technology such as precision agriculture and remote sensing are facilitating improved management of agro-forestry systems, hence more adoption and market dominance.
The fishing sector is expected to grow at the fastest CAGR of approximately 13.00% during 2024-2032. Growth is propelled by the growing requirement for sustainable and efficient aquaculture farming due to technological advances in aquaculture technology. IoT, AI, and robotic technologies allow water quality, health of fish, and feeding cycles to be tracked with high accuracy. With an increase in demand for seafood around the world, the use of smart technologies to carry out fishing operations is on the rise, driving market growth.
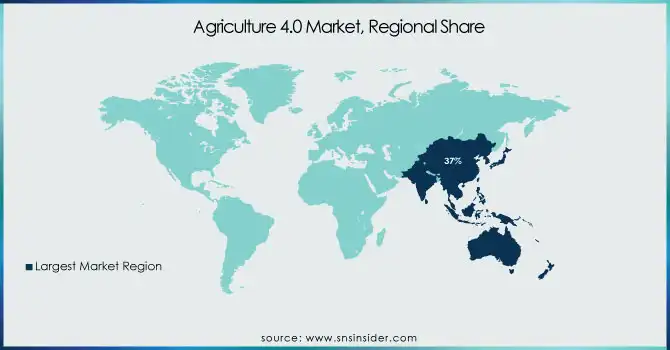
Asia Pacific dominated the Agriculture 4.0 market with the highest revenue share of about 37% in 2023. This dominance is attributed to the region's rapid adoption of advanced agricultural technologies, driven by large-scale farming operations and government initiatives supporting precision agriculture. The increasing need for food security, along with the rising awareness of sustainable farming practices, is further propelling the region's growth. Additionally, the widespread availability of affordable technology in countries like China and India boosts market expansion in the region.
Europe is expected to grow at the fastest CAGR of about 13.02% from 2024-2032. This growth is driven by the region's strong focus on sustainability and environmental protection, with governments pushing for digital agriculture and precision farming practices. Europe’s robust agricultural infrastructure, coupled with innovations in data analytics, IoT, and AI, is enabling more efficient farming operations. Furthermore, increasing consumer demand for traceability and sustainable food production is accelerating the adoption of Agriculture 4.0 technologies in the region.
Need any customization research on Agriculture 4.0 Market - Enquire Now
AGCO Corporation (Fendt 1000 Vario Tractor, Massey Ferguson MF 6700 S Tractor)
Bayer AG (Bayer CropScience Seeds, XtendiMax Herbicide)
CNH Industrial (Case IH Magnum Series Tractors, New Holland T7 Series Tractors)
Corteva Agriscience (Corteva Pioneer Seeds, Rynaxypyr Insecticide)
Cropx Inc. (CropX Soil Sensor, CropX Irrigation Management System)
Deere & Company (John Deere 8R Series Tractors, John Deere 2020 Planter)
IBM (IBM Watson Decision Platform for Agriculture, IBM Blockchain for Agriculture)
Kubota Corporation (Kubota M7 Series Tractors, Kubota SCL1000)
Saga Robotics AS (Thorvald Agricultural Robot, Thorvald Autonomous Weeding System)
Syngenta Crop Protection AG (Syngenta Vayego Insecticide, Syngenta Lumivia Insecticide)
Trimble Inc. (Trimble Ag Software, Trimble GFX-750 Display)
Yara International (YaraLiva Calcinit Fertilizer, YaraVita Trace Element Fertilizers)
AG Leader Technology (AgFiniti Cloud, InCommand 1200 Display)
BASF SE (BASF Fungicide, BASF Herbicide)
Monsanto (now part of Bayer) (Roundup Herbicide, Dekalb Seeds)
Raven Industries (Raven Viper 4+, Raven Omnistar GPS System)
Valmont Industries (Valmont Irrigation Systems, Valley Center Pivot)
Zymergen (Bio-based Crop Protection, Microbial Growth Stimulators)
Topcon Positioning Systems (Topcon X20 Field Computer, Topcon GNSS Receiver)
Lemken (Lemken Solitair Seed Drill, Lemken Rubin Disc Harrow)
Dole Food Company (Dole Organic Bananas, Dole Fresh Vegetables)
PrecisionHawk (PrecisionHawk Drone, PrecisionHawk Data Analytics)
In February 2025, AGCO Corporation and SDF entered a strategic partnership to enhance AGCO's global position in the low-mid horsepower tractor segment, with production of proprietary tractors up to 85 horsepower set to begin in mid-2025.
In June 2024, Bayer Vietnam expanded its ForwardFarming project in the Mekong Delta, promoting sustainable rice production and environmental sustainability in collaboration with the National Agricultural Extension Center (NAEC).
| Report Attributes | Details |
|---|---|
| Market Size in 2023 | USD 67.2 Billion |
| Market Size by 2032 | USD 175.54 Billion |
| CAGR | CAGR of 11.30% From 2024 to 2032 |
| Base Year | 2023 |
| Forecast Period | 2024-2032 |
| Historical Data | 2020-2022 |
| Report Scope & Coverage | Market Size, Segments Analysis, Competitive Landscape, Regional Analysis, DROC & SWOT Analysis, Forecast Outlook |
| Key Segments | • By Component (Hardware, Software, Services) • By Application (Farming, Forestry, Livestock Monitoring, Fish Farm Monitoring, Smart Green House, Others) • By End-use (Livestock, Agro-forestry, Fishing, Aquaculture) |
| Regional Analysis/Coverage | North America (US, Canada, Mexico), Europe (Eastern Europe [Poland, Romania, Hungary, Turkey, Rest of Eastern Europe] Western Europe] Germany, France, UK, Italy, Spain, Netherlands, Switzerland, Austria, Rest of Western Europe]), Asia Pacific (China, India, Japan, South Korea, Vietnam, Singapore, Australia, Rest of Asia Pacific), Middle East & Africa (Middle East [UAE, Egypt, Saudi Arabia, Qatar, Rest of Middle East], Africa [Nigeria, South Africa, Rest of Africa], Latin America (Brazil, Argentina, Colombia, Rest of Latin America) |
| Company Profiles | AGCO Corporation, Bayer AG, CNH Industrial, Corteva Agriscience, CropX Inc., Deere & Company, IBM, Kubota Corporation, Saga Robotics AS, Syngenta Crop Protection AG, Trimble Inc., Yara International, AG Leader Technology, BASF SE, Monsanto (now part of Bayer), Raven Industries, Valmont Industries, Zymergen, Topcon Positioning Systems, Lemken, Dole Food Company, PrecisionHawk. |
ANS: Agriculture 4.0 Market was valued at USD 67.2 billion in 2023 and is expected to reach USD 175.54 billion by 2032, growing at a CAGR of 11.30% from 2024-2032.
ANS: Agriculture 4.0 Market was valued at USD 67.2 billion in 2023 and is expected to reach USD 175.54 billion by 2032.
ANS: The Smart Greenhouse segment is expected to grow at the fastest CAGR of about 13.77% from 2024-2032.
ANS: The hardware segment dominated the Agriculture 4.0 Market with a revenue share of about 56% in 2023.
ANS: Europe is expected to grow at the fastest CAGR of about 13.02% from 2024-2032.
1. Introduction
1.1 Market Definition
1.2 Scope (Inclusion and Exclusions)
1.3 Research Assumptions
2. Executive Summary
2.1 Market Overview
2.2 Regional Synopsis
2.3 Competitive Summary
3. Research Methodology
3.1 Top-Down Approach
3.2 Bottom-up Approach
3.3. Data Validation
3.4 Primary Interviews
4. Market Dynamics Impact Analysis
4.1 Market Driving Factors Analysis
4.1.1 Drivers
4.1.2 Restraints
4.1.3 Opportunities
4.1.4 Challenges
4.2 PESTLE Analysis
4.3 Porter’s Five Forces Model
5. Statistical Insights and Trends Reporting
5.1 Adoption Rate
5.2 Investment and Funding Trends
5.3 Environmental Impact Metrics
5.4 Consumer Trends
5.5 Supply Chain Transformation
6. Competitive Landscape
6.1 List of Major Companies, By Region
6.2 Market Share Analysis, By Region
6.3 Product Benchmarking
6.3.1 Product specifications and features
6.3.2 Pricing
6.4 Strategic Initiatives
6.4.1 Marketing and promotional activities
6.4.2 Distribution and supply chain strategies
6.4.3 Expansion plans and new product launches
6.4.4 Strategic partnerships and collaborations
6.5 Technological Advancements
6.6 Market Positioning and Branding
7. Agriculture 4.0 Market Segmentation, By Component
7.1 Chapter Overview
7.2 Hardware
7.2.1 Hardware Market Trends Analysis (2020-2032)
7.2.2 Hardware Market Size Estimates and Forecasts to 2032 (USD Billion)
7.3 Software
7.3.1 Software Market Trends Analysis (2020-2032)
7.3.2 Software Market Size Estimates and Forecasts to 2032 (USD Billion)
7.4 Services
7.4.1 Services Market Trends Analysis (2020-2032)
7.4.2 Services Market Size Estimates and Forecasts to 2032 (USD Billion)
8. Agriculture 4.0 Market Segmentation, By Application
8.1 Chapter Overview
8.2 Farming
8.2.1 Farming Market Trends Analysis (2020-2032)
8.2.2 Farming Market Size Estimates and Forecasts to 2032 (USD Billion)
8.3 Forestry
8.3.1 Forestry Market Trends Analysis (2020-2032)
8.3.2 Forestry Market Size Estimates and Forecasts to 2032 (USD Billion)
8.4 Livestock Monitoring
8.4.1 Livestock Monitoring Market Trends Analysis (2020-2032)
8.4.2 Livestock Monitoring Market Size Estimates and Forecasts to 2032 (USD Billion)
8.5 Fish Farm Monitoring
8.5.1 Fish Farm Monitoring Market Trends Analysis (2020-2032)
8.5.2 Fish Farm Monitoring Market Size Estimates and Forecasts to 2032 (USD Billion)
8.6 Smart Green House
8.6.1 Smart Green House Market Trends Analysis (2020-2032)
8.6.2 Smart Green House Market Size Estimates and Forecasts to 2032 (USD Billion)
8.7 Others
8.7.1 Others Market Trends Analysis (2020-2032)
8.7.2 Others Market Size Estimates and Forecasts to 2032 (USD Billion)
9. Agriculture 4.0 Market Segmentation, By End-use
9.1 Chapter Overview
9.2 Livestock
9.2.1 Livestock Market Trends Analysis (2020-2032)
9.2.2 Livestock Market Size Estimates and Forecasts to 2032 (USD Billion)
9.3 Agro-forestry
9.3.1 Agro-forestry Market Trends Analysis (2020-2032)
9.3.2 Agro-forestry Market Size Estimates and Forecasts to 2032 (USD Billion)
9.4 Fishing
9.4.1 Fishing Market Trends Analysis (2020-2032)
9.4.2 Fishing Market Size Estimates and Forecasts to 2032 (USD Billion)
9.5 Aquaculture
9.5.1 Aquaculture Market Trends Analysis (2020-2032)
9.5.2 Aquaculture Market Size Estimates and Forecasts to 2032 (USD Billion)
10. Regional Analysis
10.1 Chapter Overview
10.2 North America
10.2.1 Trends Analysis
10.2.2 North America Agriculture 4.0 Market Estimates and Forecasts, by Country (2020-2032) (USD Billion)
10.2.3 North America Agriculture 4.0 Market Estimates and Forecasts, By Component (2020-2032) (USD Billion)
10.2.4 North America Agriculture 4.0 Market Estimates and Forecasts, By Application (2020-2032) (USD Billion)
10.2.5 North America Agriculture 4.0 Market Estimates and Forecasts, By End-use (2020-2032) (USD Billion)
10.2.6 USA
10.2.6.1 USA Agriculture 4.0 Market Estimates and Forecasts, By Component (2020-2032) (USD Billion)
10.2.6.2 USA Agriculture 4.0 Market Estimates and Forecasts, By Application (2020-2032) (USD Billion)
10.2.6.3 USA Agriculture 4.0 Market Estimates and Forecasts, By End-use (2020-2032) (USD Billion)
10.2.7 Canada
10.2.7.1 Canada Agriculture 4.0 Market Estimates and Forecasts, By Component (2020-2032) (USD Billion)
10.2.7.2 Canada Agriculture 4.0 Market Estimates and Forecasts, By Application (2020-2032) (USD Billion)
10.2.7.3 Canada Agriculture 4.0 Market Estimates and Forecasts, By End-use (2020-2032) (USD Billion)
10.2.8 Mexico
10.2.8.1 Mexico Agriculture 4.0 Market Estimates and Forecasts, By Component (2020-2032) (USD Billion)
10.2.8.2 Mexico Agriculture 4.0 Market Estimates and Forecasts, By Application (2020-2032) (USD Billion)
10.2.8.3 Mexico Agriculture 4.0 Market Estimates and Forecasts, By End-use (2020-2032) (USD Billion)
10.3 Europe
10.3.1 Eastern Europe
10.3.1.1 Trends Analysis
10.3.1.2 Eastern Europe Agriculture 4.0 Market Estimates and Forecasts, by Country (2020-2032) (USD Billion)
10.3.1.3 Eastern Europe Agriculture 4.0 Market Estimates and Forecasts, By Component (2020-2032) (USD Billion)
10.3.1.4 Eastern Europe Agriculture 4.0 Market Estimates and Forecasts, By Application (2020-2032) (USD Billion)
10.3.1.5 Eastern Europe Agriculture 4.0 Market Estimates and Forecasts, By End-use (2020-2032) (USD Billion)
10.3.1.6 Poland
10.3.1.6.1 Poland Agriculture 4.0 Market Estimates and Forecasts, By Component (2020-2032) (USD Billion)
10.3.1.6.2 Poland Agriculture 4.0 Market Estimates and Forecasts, By Application (2020-2032) (USD Billion)
10.3.1.6.3 Poland Agriculture 4.0 Market Estimates and Forecasts, By End-use (2020-2032) (USD Billion)
10.3.1.7 Romania
10.3.1.7.1 Romania Agriculture 4.0 Market Estimates and Forecasts, By Component (2020-2032) (USD Billion)
10.3.1.7.2 Romania Agriculture 4.0 Market Estimates and Forecasts, By Application (2020-2032) (USD Billion)
10.3.1.7.3 Romania Agriculture 4.0 Market Estimates and Forecasts, By End-use (2020-2032) (USD Billion)
10.3.1.8 Hungary
10.3.1.8.1 Hungary Agriculture 4.0 Market Estimates and Forecasts, By Component (2020-2032) (USD Billion)
10.3.1.8.2 Hungary Agriculture 4.0 Market Estimates and Forecasts, By Application (2020-2032) (USD Billion)
10.3.1.8.3 Hungary Agriculture 4.0 Market Estimates and Forecasts, By End-use (2020-2032) (USD Billion)
10.3.1.9 Turkey
10.3.1.9.1 Turkey Agriculture 4.0 Market Estimates and Forecasts, By Component (2020-2032) (USD Billion)
10.3.1.9.2 Turkey Agriculture 4.0 Market Estimates and Forecasts, By Application (2020-2032) (USD Billion)
10.3.1.9.3 Turkey Agriculture 4.0 Market Estimates and Forecasts, By End-use (2020-2032) (USD Billion)
10.3.1.10 Rest of Eastern Europe
10.3.1.10.1 Rest of Eastern Europe Agriculture 4.0 Market Estimates and Forecasts, By Component (2020-2032) (USD Billion)
10.3.1.10.2 Rest of Eastern Europe Agriculture 4.0 Market Estimates and Forecasts, By Application (2020-2032) (USD Billion)
10.3.1.10.3 Rest of Eastern Europe Agriculture 4.0 Market Estimates and Forecasts, By End-use (2020-2032) (USD Billion)
10.3.2 Western Europe
10.3.2.1 Trends Analysis
10.3.2.2 Western Europe Agriculture 4.0 Market Estimates and Forecasts, by Country (2020-2032) (USD Billion)
10.3.2.3 Western Europe Agriculture 4.0 Market Estimates and Forecasts, By Component (2020-2032) (USD Billion)
10.3.2.4 Western Europe Agriculture 4.0 Market Estimates and Forecasts, By Application (2020-2032) (USD Billion)
10.3.2.5 Western Europe Agriculture 4.0 Market Estimates and Forecasts, By End-use (2020-2032) (USD Billion)
10.3.2.6 Germany
10.3.2.6.1 Germany Agriculture 4.0 Market Estimates and Forecasts, By Component (2020-2032) (USD Billion)
10.3.2.6.2 Germany Agriculture 4.0 Market Estimates and Forecasts, By Application (2020-2032) (USD Billion)
10.3.2.6.3 Germany Agriculture 4.0 Market Estimates and Forecasts, By End-use (2020-2032) (USD Billion)
10.3.2.7 France
10.3.2.7.1 France Agriculture 4.0 Market Estimates and Forecasts, By Component (2020-2032) (USD Billion)
10.3.2.7.2 France Agriculture 4.0 Market Estimates and Forecasts, By Application (2020-2032) (USD Billion)
10.3.2.7.3 France Agriculture 4.0 Market Estimates and Forecasts, By End-use (2020-2032) (USD Billion)
10.3.2.8 UK
10.3.2.8.1 UK Agriculture 4.0 Market Estimates and Forecasts, By Component (2020-2032) (USD Billion)
10.3.2.8.2 UK Agriculture 4.0 Market Estimates and Forecasts, By Application (2020-2032) (USD Billion)
10.3.2.8.3 UK Agriculture 4.0 Market Estimates and Forecasts, By End-use (2020-2032) (USD Billion)
10.3.2.9 Italy
10.3.2.9.1 Italy Agriculture 4.0 Market Estimates and Forecasts, By Component (2020-2032) (USD Billion)
10.3.2.9.2 Italy Agriculture 4.0 Market Estimates and Forecasts, By Application (2020-2032) (USD Billion)
10.3.2.9.3 Italy Agriculture 4.0 Market Estimates and Forecasts, By End-use (2020-2032) (USD Billion)
10.3.2.10 Spain
10.3.2.10.1 Spain Agriculture 4.0 Market Estimates and Forecasts, By Component (2020-2032) (USD Billion)
10.3.2.10.2 Spain Agriculture 4.0 Market Estimates and Forecasts, By Application (2020-2032) (USD Billion)
10.3.2.10.3 Spain Agriculture 4.0 Market Estimates and Forecasts, By End-use (2020-2032) (USD Billion)
10.3.2.11 Netherlands
10.3.2.11.1 Netherlands Agriculture 4.0 Market Estimates and Forecasts, By Component (2020-2032) (USD Billion)
10.3.2.11.2 Netherlands Agriculture 4.0 Market Estimates and Forecasts, By Application (2020-2032) (USD Billion)
10.3.2.11.3 Netherlands Agriculture 4.0 Market Estimates and Forecasts, By End-use (2020-2032) (USD Billion)
10.3.2.12 Switzerland
10.3.2.12.1 Switzerland Agriculture 4.0 Market Estimates and Forecasts, By Component (2020-2032) (USD Billion)
10.3.2.12.2 Switzerland Agriculture 4.0 Market Estimates and Forecasts, By Application (2020-2032) (USD Billion)
10.3.2.12.3 Switzerland Agriculture 4.0 Market Estimates and Forecasts, By End-use (2020-2032) (USD Billion)
10.3.2.13 Austria
10.3.2.13.1 Austria Agriculture 4.0 Market Estimates and Forecasts, By Component (2020-2032) (USD Billion)
10.3.2.13.2 Austria Agriculture 4.0 Market Estimates and Forecasts, By Application (2020-2032) (USD Billion)
10.3.2.13.3 Austria Agriculture 4.0 Market Estimates and Forecasts, By End-use (2020-2032) (USD Billion)
10.3.2.14 Rest of Western Europe
10.3.2.14.1 Rest of Western Europe Agriculture 4.0 Market Estimates and Forecasts, By Component (2020-2032) (USD Billion)
10.3.2.14.2 Rest of Western Europe Agriculture 4.0 Market Estimates and Forecasts, By Application (2020-2032) (USD Billion)
10.3.2.14.3 Rest of Western Europe Agriculture 4.0 Market Estimates and Forecasts, By End-use (2020-2032) (USD Billion)
10.4 Asia Pacific
10.4.1 Trends Analysis
10.4.2 Asia Pacific Agriculture 4.0 Market Estimates and Forecasts, by Country (2020-2032) (USD Billion)
10.4.3 Asia Pacific Agriculture 4.0 Market Estimates and Forecasts, By Component (2020-2032) (USD Billion)
10.4.4 Asia Pacific Agriculture 4.0 Market Estimates and Forecasts, By Application (2020-2032) (USD Billion)
10.4.5 Asia Pacific Agriculture 4.0 Market Estimates and Forecasts, By End-use (2020-2032) (USD Billion)
10.4.6 China
10.4.6.1 China Agriculture 4.0 Market Estimates and Forecasts, By Component (2020-2032) (USD Billion)
10.4.6.2 China Agriculture 4.0 Market Estimates and Forecasts, By Application (2020-2032) (USD Billion)
10.4.6.3 China Agriculture 4.0 Market Estimates and Forecasts, By End-use (2020-2032) (USD Billion)
10.4.7 India
10.4.7.1 India Agriculture 4.0 Market Estimates and Forecasts, By Component (2020-2032) (USD Billion)
10.4.7.2 India Agriculture 4.0 Market Estimates and Forecasts, By Application (2020-2032) (USD Billion)
10.4.7.3 India Agriculture 4.0 Market Estimates and Forecasts, By End-use (2020-2032) (USD Billion)
10.4.8 Japan
10.4.8.1 Japan Agriculture 4.0 Market Estimates and Forecasts, By Component (2020-2032) (USD Billion)
10.4.8.2 Japan Agriculture 4.0 Market Estimates and Forecasts, By Application (2020-2032) (USD Billion)
10.4.8.3 Japan Agriculture 4.0 Market Estimates and Forecasts, By End-use (2020-2032) (USD Billion)
10.4.9 South Korea
10.4.9.1 South Korea Agriculture 4.0 Market Estimates and Forecasts, By Component (2020-2032) (USD Billion)
10.4.9.2 South Korea Agriculture 4.0 Market Estimates and Forecasts, By Application (2020-2032) (USD Billion)
10.4.9.3 South Korea Agriculture 4.0 Market Estimates and Forecasts, By End-use (2020-2032) (USD Billion)
10.4.10 Vietnam
10.4.10.1 Vietnam Agriculture 4.0 Market Estimates and Forecasts, By Component (2020-2032) (USD Billion)
10.4.10.2 Vietnam Agriculture 4.0 Market Estimates and Forecasts, By Application (2020-2032) (USD Billion)
10.4.10.3 Vietnam Agriculture 4.0 Market Estimates and Forecasts, By End-use (2020-2032) (USD Billion)
10.4.11 Singapore
10.4.11.1 Singapore Agriculture 4.0 Market Estimates and Forecasts, By Component (2020-2032) (USD Billion)
10.4.11.2 Singapore Agriculture 4.0 Market Estimates and Forecasts, By Application (2020-2032) (USD Billion)
10.4.11.3 Singapore Agriculture 4.0 Market Estimates and Forecasts, By End-use (2020-2032) (USD Billion)
10.4.12 Australia
10.4.12.1 Australia Agriculture 4.0 Market Estimates and Forecasts, By Component (2020-2032) (USD Billion)
10.4.12.2 Australia Agriculture 4.0 Market Estimates and Forecasts, By Application (2020-2032) (USD Billion)
10.4.12.3 Australia Agriculture 4.0 Market Estimates and Forecasts, By End-use (2020-2032) (USD Billion)
10.4.13 Rest of Asia Pacific
10.4.13.1 Rest of Asia Pacific Agriculture 4.0 Market Estimates and Forecasts, By Component (2020-2032) (USD Billion)
10.4.13.2 Rest of Asia Pacific Agriculture 4.0 Market Estimates and Forecasts, By Application (2020-2032) (USD Billion)
10.4.13.3 Rest of Asia Pacific Agriculture 4.0 Market Estimates and Forecasts, By End-use (2020-2032) (USD Billion)
10.5 Middle East and Africa
10.5.1 Middle East
10.5.1.1 Trends Analysis
10.5.1.2 Middle East Agriculture 4.0 Market Estimates and Forecasts, by Country (2020-2032) (USD Billion)
10.5.1.3 Middle East Agriculture 4.0 Market Estimates and Forecasts, By Component (2020-2032) (USD Billion)
10.5.1.4 Middle East Agriculture 4.0 Market Estimates and Forecasts, By Application (2020-2032) (USD Billion)
10.5.1.5 Middle East Agriculture 4.0 Market Estimates and Forecasts, By End-use (2020-2032) (USD Billion)
10.5.1.6 UAE
10.5.1.6.1 UAE Agriculture 4.0 Market Estimates and Forecasts, By Component (2020-2032) (USD Billion)
10.5.1.6.2 UAE Agriculture 4.0 Market Estimates and Forecasts, By Application (2020-2032) (USD Billion)
10.5.1.6.3 UAE Agriculture 4.0 Market Estimates and Forecasts, By End-use (2020-2032) (USD Billion)
10.5.1.7 Egypt
10.5.1.7.1 Egypt Agriculture 4.0 Market Estimates and Forecasts, By Component (2020-2032) (USD Billion)
10.5.1.7.2 Egypt Agriculture 4.0 Market Estimates and Forecasts, By Application (2020-2032) (USD Billion)
10.5.1.7.3 Egypt Agriculture 4.0 Market Estimates and Forecasts, By End-use (2020-2032) (USD Billion)
10.5.1.8 Saudi Arabia
10.5.1.8.1 Saudi Arabia Agriculture 4.0 Market Estimates and Forecasts, By Component (2020-2032) (USD Billion)
10.5.1.8.2 Saudi Arabia Agriculture 4.0 Market Estimates and Forecasts, By Application (2020-2032) (USD Billion)
10.5.1.8.3 Saudi Arabia Agriculture 4.0 Market Estimates and Forecasts, By End-use (2020-2032) (USD Billion)
10.5.1.9 Qatar
10.5.1.9.1 Qatar Agriculture 4.0 Market Estimates and Forecasts, By Component (2020-2032) (USD Billion)
10.5.1.9.2 Qatar Agriculture 4.0 Market Estimates and Forecasts, By Application (2020-2032) (USD Billion)
10.5.1.9.3 Qatar Agriculture 4.0 Market Estimates and Forecasts, By End-use (2020-2032) (USD Billion)
10.5.1.10 Rest of Middle East
10.5.1.10.1 Rest of Middle East Agriculture 4.0 Market Estimates and Forecasts, By Component (2020-2032) (USD Billion)
10.5.1.10.2 Rest of Middle East Agriculture 4.0 Market Estimates and Forecasts, By Application (2020-2032) (USD Billion)
10.5.1.10.3 Rest of Middle East Agriculture 4.0 Market Estimates and Forecasts, By End-use (2020-2032) (USD Billion)
10.5.2 Africa
10.5.2.1 Trends Analysis
10.5.2.2 Africa Agriculture 4.0 Market Estimates and Forecasts, by Country (2020-2032) (USD Billion)
10.5.2.3 Africa Agriculture 4.0 Market Estimates and Forecasts, By Component (2020-2032) (USD Billion)
10.5.2.4 Africa Agriculture 4.0 Market Estimates and Forecasts, By Application (2020-2032) (USD Billion)
10.5.2.5 Africa Agriculture 4.0 Market Estimates and Forecasts, By End-use (2020-2032) (USD Billion)
10.5.2.6 South Africa
10.5.2.6.1 South Africa Agriculture 4.0 Market Estimates and Forecasts, By Component (2020-2032) (USD Billion)
10.5.2.6.2 South Africa Agriculture 4.0 Market Estimates and Forecasts, By Application (2020-2032) (USD Billion)
10.5.2.6.3 South Africa Agriculture 4.0 Market Estimates and Forecasts, By End-use (2020-2032) (USD Billion)
10.5.2.7 Nigeria
10.5.2.7.1 Nigeria Agriculture 4.0 Market Estimates and Forecasts, By Component (2020-2032) (USD Billion)
10.5.2.7.2 Nigeria Agriculture 4.0 Market Estimates and Forecasts, By Application (2020-2032) (USD Billion)
10.5.2.7.3 Nigeria Agriculture 4.0 Market Estimates and Forecasts, By End-use (2020-2032) (USD Billion)
10.5.2.8 Rest of Africa
10.5.2.8.1 Rest of Africa Agriculture 4.0 Market Estimates and Forecasts, By Component (2020-2032) (USD Billion)
10.5.2.8.2 Rest of Africa Agriculture 4.0 Market Estimates and Forecasts, By Application (2020-2032) (USD Billion)
10.5.2.8.3 Rest of Africa Agriculture 4.0 Market Estimates and Forecasts, By End-use (2020-2032) (USD Billion)
10.6 Latin America
10.6.1 Trends Analysis
10.6.2 Latin America Agriculture 4.0 Market Estimates and Forecasts, by Country (2020-2032) (USD Billion)
10.6.3 Latin America Agriculture 4.0 Market Estimates and Forecasts, By Component (2020-2032) (USD Billion)
10.6.4 Latin America Agriculture 4.0 Market Estimates and Forecasts, By Application (2020-2032) (USD Billion)
10.6.5 Latin America Agriculture 4.0 Market Estimates and Forecasts, By End-use (2020-2032) (USD Billion)
10.6.6 Brazil
10.6.6.1 Brazil Agriculture 4.0 Market Estimates and Forecasts, By Component (2020-2032) (USD Billion)
10.6.6.2 Brazil Agriculture 4.0 Market Estimates and Forecasts, By Application (2020-2032) (USD Billion)
10.6.6.3 Brazil Agriculture 4.0 Market Estimates and Forecasts, By End-use (2020-2032) (USD Billion)
10.6.7 Argentina
10.6.7.1 Argentina Agriculture 4.0 Market Estimates and Forecasts, By Component (2020-2032) (USD Billion)
10.6.7.2 Argentina Agriculture 4.0 Market Estimates and Forecasts, By Application (2020-2032) (USD Billion)
10.6.7.3 Argentina Agriculture 4.0 Market Estimates and Forecasts, By End-use (2020-2032) (USD Billion)
10.6.8 Colombia
10.6.8.1 Colombia Agriculture 4.0 Market Estimates and Forecasts, By Component (2020-2032) (USD Billion)
10.6.8.2 Colombia Agriculture 4.0 Market Estimates and Forecasts, By Application (2020-2032) (USD Billion)
10.6.8.3 Colombia Agriculture 4.0 Market Estimates and Forecasts, By End-use (2020-2032) (USD Billion)
10.6.9 Rest of Latin America
10.6.9.1 Rest of Latin America Agriculture 4.0 Market Estimates and Forecasts, By Component (2020-2032) (USD Billion)
10.6.9.2 Rest of Latin America Agriculture 4.0 Market Estimates and Forecasts, By Application (2020-2032) (USD Billion)
10.6.9.3 Rest of Latin America Agriculture 4.0 Market Estimates and Forecasts, By End-use (2020-2032) (USD Billion)
11. Company Profiles
11.1 AGCO Corporation
11.1.1 Company Overview
11.1.2 Financial
11.1.3 Products/ Services Offered
11.1.4 SWOT Analysis
11.2 Bayer AG
11.2.1 Company Overview
11.2.2 Financial
11.2.3 Products/ Services Offered
11.2.4 SWOT Analysis
11.3 CNH Industrial
11.3.1 Company Overview
11.3.2 Financial
11.3.3 Products/ Services Offered
11.3.4 SWOT Analysis
11.4 Corteva Agriscience
11.4.1 Company Overview
11.4.2 Financial
11.4.3 Products/ Services Offered
11.4.4 SWOT Analysis
11.5 CropX Inc.
11.5.1 Company Overview
11.5.2 Financial
11.5.3 Products/ Services Offered
11.5.4 SWOT Analysis
11.6 Deere & Company
11.6.1 Company Overview
11.6.2 Financial
11.6.3 Products/ Services Offered
11.6.4 SWOT Analysis
11.7 IBM
11.7.1 Company Overview
11.7.2 Financial
11.7.3 Products/ Services Offered
11.7.4 SWOT Analysis
11.8 Kubota Corporation
11.8.1 Company Overview
11.8.2 Financial
11.8.3 Products/ Services Offered
11.8.4 SWOT Analysis
11.9 Saga Robotics AS
11.9.1 Company Overview
11.9.2 Financial
11.9.3 Products/ Services Offered
11.9.4 SWOT Analysis
11.10 Syngenta Crop Protection AG
11.10.1 Company Overview
11.10.2 Financial
11.10.3 Products/ Services Offered
11.10.4 SWOT Analysis
12. Use Cases and Best Practices
13. Conclusion
An accurate research report requires proper strategizing as well as implementation. There are multiple factors involved in the completion of good and accurate research report and selecting the best methodology to compete the research is the toughest part. Since the research reports we provide play a crucial role in any company’s decision-making process, therefore we at SNS Insider always believe that we should choose the best method which gives us results closer to reality. This allows us to reach at a stage wherein we can provide our clients best and accurate investment to output ratio.
Each report that we prepare takes a timeframe of 350-400 business hours for production. Starting from the selection of titles through a couple of in-depth brain storming session to the final QC process before uploading our titles on our website we dedicate around 350 working hours. The titles are selected based on their current market cap and the foreseen CAGR and growth.
The 5 steps process:
Step 1: Secondary Research:
Secondary Research or Desk Research is as the name suggests is a research process wherein, we collect data through the readily available information. In this process we use various paid and unpaid databases which our team has access to and gather data through the same. This includes examining of listed companies’ annual reports, Journals, SEC filling etc. Apart from this our team has access to various associations across the globe across different industries. Lastly, we have exchange relationships with various university as well as individual libraries.

Step 2: Primary Research
When we talk about primary research, it is a type of study in which the researchers collect relevant data samples directly, rather than relying on previously collected data. This type of research is focused on gaining content specific facts that can be sued to solve specific problems. Since the collected data is fresh and first hand therefore it makes the study more accurate and genuine.
We at SNS Insider have divided Primary Research into 2 parts.
Part 1 wherein we interview the KOLs of major players as well as the upcoming ones across various geographic regions. This allows us to have their view over the market scenario and acts as an important tool to come closer to the accurate market numbers. As many as 45 paid and unpaid primary interviews are taken from both the demand and supply side of the industry to make sure we land at an accurate judgement and analysis of the market.
This step involves the triangulation of data wherein our team analyses the interview transcripts, online survey responses and observation of on filed participants. The below mentioned chart should give a better understanding of the part 1 of the primary interview.

Part 2: In this part of primary research the data collected via secondary research and the part 1 of the primary research is validated with the interviews from individual consultants and subject matter experts.
Consultants are those set of people who have at least 12 years of experience and expertise within the industry whereas Subject Matter Experts are those with at least 15 years of experience behind their back within the same space. The data with the help of two main processes i.e., FGDs (Focused Group Discussions) and IDs (Individual Discussions). This gives us a 3rd party nonbiased primary view of the market scenario making it a more dependable one while collation of the data pointers.
Step 3: Data Bank Validation
Once all the information is collected via primary and secondary sources, we run that information for data validation. At our intelligence centre our research heads track a lot of information related to the market which includes the quarterly reports, the daily stock prices, and other relevant information. Our data bank server gets updated every fortnight and that is how the information which we collected using our primary and secondary information is revalidated in real time.

Step 4: QA/QC Process
After all the data collection and validation our team does a final level of quality check and quality assurance to get rid of any unwanted or undesired mistakes. This might include but not limited to getting rid of the any typos, duplication of numbers or missing of any important information. The people involved in this process include technical content writers, research heads and graphics people. Once this process is completed the title gets uploader on our platform for our clients to read it.
Step 5: Final QC/QA Process:
This is the last process and comes when the client has ordered the study. In this process a final QA/QC is done before the study is emailed to the client. Since we believe in giving our clients a good experience of our research studies, therefore, to make sure that we do not lack at our end in any way humanly possible we do a final round of quality check and then dispatch the study to the client.
By Component
Hardware
Software
Services
By Application
Farming
Forestry
Fish Farm Monitoring
Smart Green House
Others
By End-use
Livestock
Agro-forestry
Fishing
Aquaculture
Request for Segment Customization as per your Business Requirement: Segment Customization Request
Regional Coverage:
North America
US
Canada
Mexico
Europe
Eastern Europe
Poland
Romania
Hungary
Turkey
Rest of Eastern Europe
Western Europe
Germany
France
UK
Italy
Spain
Netherlands
Switzerland
Austria
Rest of Western Europe
Asia Pacific
China
India
Japan
South Korea
Vietnam
Singapore
Australia
Rest of Asia Pacific
Middle East & Africa
Middle East
UAE
Egypt
Saudi Arabia
Qatar
Rest of Middle East
Africa
Nigeria
South Africa
Rest of Africa
Latin America
Brazil
Argentina
Colombia
Rest of Latin America
Request for Country Level Research Report: Country Level Customization Request
Available Customization
With the given market data, SNS Insider offers customization as per the company’s specific needs. The following customization options are available for the report:
Detailed Volume Analysis
Criss-Cross segment analysis (e.g. Product X Application)
Competitive Product Benchmarking
Geographic Analysis
Additional countries in any of the regions
Customized Data Representation
Detailed analysis and profiling of additional market players
The Arbitrary Waveform Generator Market Size was valued at USD 444.98 Million in 2023 and is expected to grow at a CAGR of 8.79% During 2024-2032.
The Microcontroller Unit (MCU) Market Size was valued at USD 32.82 Billion in 2023 and is expected to grow at 9.2% CAGR to reach USD 72.31 Billion by 2032.
The All-Flash Array Market Size was valued at USD 14.59 billion in 2023 and is expected to grow at a CAGR of 19.93% to reach USD 74.62 billion by 2032.
The Hybrid Printing Market Size was valued at USD 5.18 Billion in 2023 and is expected to grow at a CAGR of 13.20% to reach USD 15.81 Billion by 2032.
The Occupancy Sensor Market Size was valued at USD 2.76 billion in 2023 and is expected to grow at a CAGR of 10.87% to reach USD 6.96 billion by 2032.
The Atomic Force Microscopy Market size is expected to be valued at USD 82.94 Billion in 2023. It is estimated to reach USD 146.18 Billion by 2032 with a growing CAGR of 6.5% over the forecast period 2024-2032.

Hi! Click one of our member below to chat on Phone
© 2025 All Rights Reserved by SNS Insider Pvt Ltd


