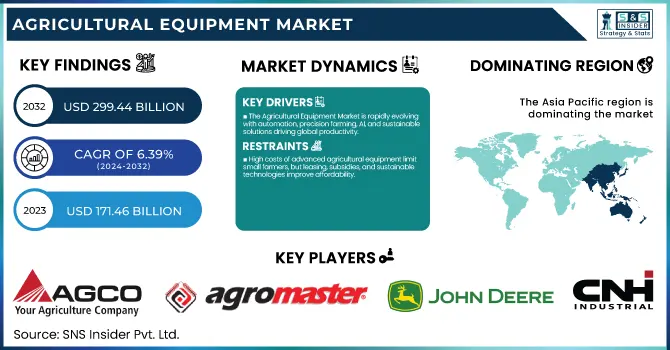
The Agricultural Equipment Market Size was estimated at USD 171.46 billion in 2023 and is expected to arrive at USD 299.44 billion by 2032 with a growing CAGR of 6.39% over the forecast period 2024-2032. This report provides a unique perspective on the Agricultural Equipment Market by analyzing production trends and market penetration across regions, highlighting shifts in adoption patterns. It evaluates equipment utilization efficiency by type and region, offering insights into operational performance. The study explores R&D and innovation trends, showcasing advancements in automation and smart farming. Additionally, it examines export/import dynamics, mapping global trade movements. To enhance the analysis, the report also covers supply chain disruptions and emerging technologies, such as AI-driven machinery and IoT-enabled solutions.
To Get more information on Agricultural Equipment Market - Request Free Sample Report
The U.S. agricultural equipment market is set to grow at a CAGR of 6.99% from 2023 to 2032, expanding from USD 27.16 billion in 2023 to USD 49.87 billion by 2032. This steady rise is driven by increasing mechanization, advancements in precision farming, and growing demand for high-efficiency equipment. With continuous innovation in automation, GPS-guided machinery, and sustainable farming practices, the U.S. remains the dominant player in North America’s agricultural equipment sector.
Drivers
The Agricultural Equipment Market is rapidly advancing with mechanization and automation, driven by precision farming, GPS-guided tractors, AI-powered machinery, and sustainable solutions, enhancing efficiency and productivity globally.
The Agricultural Equipment Market is witnessing a rapid shift towards mechanization and automation, driven by the need for higher efficiency, productivity, and sustainability. Precision farming technologies, including GPS-driven tractors, autonomous equipment, and AI-enabled solutions, are revolutionizing contemporary agriculture by maximizing resource use and minimizing reliance on labor. The use of advanced equipment including drones, robotic harvesters, and IoT-enabled sensors also makes it possible for real-time data feeding and monitoring, thus enhancing crop yield and reducing wastage. The automation of seeding, irrigation, and harvesting is increasing efficiency, resulting in higher adoption across large and small-scale farms. The agricultural sector is also witnessing an increased demand for electric and hybrid equipment, enabling reduction of carbon footprints aligned with global sustainability objectives. The North America and Europe is holding the market, on the other hand, Asia-Pacific and Latin America is witnessing good growth rate owing to surging mechanization in developing countries. The future of agricultural machinery will be led by smart farming and digitalization as innovation will keep on moving ahead.
Restraint
High initial investment in advanced agricultural equipment limits accessibility for small-scale farmers, but leasing models, subsidies, and emerging sustainable technologies are easing affordability challenges.
The Agricultural Equipment Market is witnessing significant transformation driven by automation, precision farming, and digitalization. However, initial investment costs are high, which represents an obstacle, especially for small-scale farmers. While advanced technologies like GPS-guided tractors, autonomous harvesters, and AI-integrated machinery can improve efficiency and productivity, they all require significant upfront investment and ongoing upkeep. But you often limit access to modern technology behind high paywalls, particularly in developing regions with low farm incomes. Even with this restraint, the market is booming, notably aided by government subsidies, financing programs, and leasing models that offer farmers solutions to affordability concerns. Also, the industry is heading toward sustainable and electric-powered equipment, which increases capital requirements but can save on costs in the longer term. Robotics, IoT-enabled smart farming, and drone technology are a few of the trends transforming agricultural operations and enhancing yield and resource optimization. With the adoption of technology increasing, partnerships between manufacturers and financial institutions should help address affordability issues.
Opportunities
The expansion of emerging markets in agriculture is driving growth through increased mechanization, supported by government incentives, technological adoption, and rising food demand.
The expansion of emerging markets presents a substantial growth opportunity in the Agricultural Equipment Market, driven by increasing mechanization in developing regions. Lands in Asia, Africa, and Latin America are quickly embracing new amenities that are reducing input, increasing output, and raising efficiency. This transition is driven by increasing food demand, sustainable agriculture practices and government regulations providing subsidies and financial support for mechanization. However, in these parts of the world, the advancement of precision farming using technologies like GPS, sensors, and AI is allowing them to improve yield and lower input costs. Moreover, the trend towards agricultural mechanization is being by increased access to rural infrastructure and sources of finance. With the development of these markets, the demand for tractors, harvesters and other advanced farming equipment is also expected to be an area of growth and therefore critical for investment and innovation in the coming years.
Challenges
Infrastructure limitations, such as poor rural connectivity and inadequate storage facilities, hinder the adoption of advanced agricultural technologies, slowing productivity growth.
Infrastructure limitations in rural areas significantly hinder the adoption of advanced agricultural technologies. Lack of internet access and transportation isolation also limits farmers’ access to real-time data, remote monitoring systems and cloud-based applications that enable the efficient use of modern farming equipment. Farmers cannot incorporate IoT-enabled machines, precision agriculture tools, and GPS-guided formats without reliable internet access. Poor storage facilities mean that harvested crops cannot be used efficiently, and they incur losses post-harvest as well. Inadequate storage infrastructure and facilities also restrict the usage of high-tech equipment that can raise yield and maintain quality. However, there is a growing movement to tackle these issues, with governments and private sectors investing in rural infrastructure improvements. Two of the most important trends that are helping bridge that gap: The surge of mobile connectivity and the growth in technology for low-cost, modular storage solutions are enabling farmers to adopt technology and increase productivity.
By Product
The tractors dominated with a market share of over 32% in 2023, due to their critical role in various fundamental farming tasks such as plowing, tilling, and harvesting. To fulfill these farming functions, tractors can be coupled with various types of implements. From traditional farming practices to modern precision agriculture, their high adoption rates across different regions and farming systems assure them in the marketplace. Moreover, innovations in tractor technology, like GPS systems, automation, and fuel-efficient engines, have improved their productivity, which has also aided in solidifying their market share. Tractors find extensive usage across several agriculture processes, and hence, the application as the leading product segment in agricultural equipment would continue, further propelled by the ceaseless demand.
By Application
The land Development & Seed Bed Preparation segment dominated with a market share of over 38% in 2023, owing to the critical function of preparing the land before farming, which facilitates suitable conditions for planting and enhanced production. The Harvesting & Threshing segment holds the largest share of the market, driven by increasing penetration of advanced harvesting technologies such as automated combines and harvesters, which improved efficiency and reduced labor costs over large-scale operations in economically developing countries. Technological innovation, along with demand for mechanized farming and a push for greater productivity in global agriculture, are resulting in rapid growth of these segments.
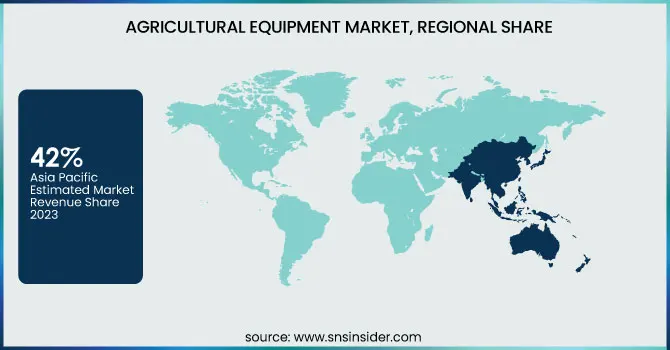
The Asia-Pacific region dominated with a market share of over 42% in 2023, due to its vast agricultural base and growing demand for mechanization. In developing countries such as China and India, where a substantial portion of the population is engaged in farming and agricultural sectors are continually growing, there is a broad trend towards modern farming techniques. To with the growing demand for labor to increase efficiency in production agriculture, such as tractors, harvesters and equipment. In addition, the government's subsidies and mechanization financial support policies significantly promote equipment adoption. Asia-Pacific dominates the market for agricultural equipment, mainly because of the focus of the region on increasing efficiency in agriculture and also due to distinct requirements for catering food to an increasing population.
North America is the fastest-growing region, owing to the growing adoption of advanced technologies like precision farming and automation. In recent times, the region has experienced a boom in GPS-guided machinery, automation of tractors, and the use of drones to make farming more efficient, reduce labor costs, and make other aspects of farming easier. Additionally, the government must support the effort through policies and subsidies or grants that promote sustainable farming practices and the purchase of environmentally friendly equipment. North America will be a potential Rapid growth in Agricultural Machinery with innovative and technology-led solutions for the farmers to increase their productivity with minimum impact on the environment.
Get Customized Report as per Your Business Requirement - Enquiry Now
AGCO Corporation (Tractors, Harvesters, Sprayers)
Fliegl Agro-Center GmbH (Trailers, Slurry Tankers)
Agromaster (Seed Drills, Fertilizer Spreaders)
Amazone Inc. (Plows, Sprayers, Fertilizer Spreaders)
APV GmbH (Seeder Technology, Crop Care Equipment)
Bellota Agrisolutions (Plow Discs, Harrow Tines)
CLAAS KGaA mbH (Combines, Forage Harvesters)
CNH Industrial N.V. (Tractors, Balers, Combine Harvesters)
Deere & Company (Tractors, Planters, Sprayers)
Escorts Limited (Tractors, Implements)
HORSCH Maschinen GmbH (Cultivators, Seeders, Sprayers)
ISEKI & Co., Ltd. (Compact Tractors, Mowers)
J C Bamford Excavators Ltd. (Backhoe Loaders, Telehandlers)
Quivogne CEE GmbH (Kiwon RUS LLC) (Harrows, Subsoilers)
Rostselmash (Combine Harvesters, Forage Equipment)
KUBOTA Corporation (Tractors, Rice Transplanters)
KUHN SAS (Balers, Hay and Forage Equipment)
Mahindra & Mahindra Ltd. (Tractors, Rotavators)
Maschio Gaspardo S.p.A. (Plows, Sprayers, Planters)
SDF S.p.A. (Tractors, Combine Harvesters)
Suppliers for (tractors, combines, precision agriculture technology, and construction equipment.) on Agricultural Equipment Market
John Deere
CNH Industrial
AGCO Corporation
Kubota Corporation
Mahindra & Mahindra
CLAAS KGaA mbH
Yanmar Co., Ltd.
Argo Tractors
Same Deutz-Fahr (SDF)
Kverneland Group
In June 2023: Mahindra Group’s Swaraj Tractors introduced the Swaraj Target, a lightweight compact tractor designed to deliver unmatched performance and first-in-class features, incorporating cutting-edge technology to meet the unique needs of Indian farmers.
In May 2023: AMAZONE unveiled new products within its precision seeders range, including the advanced trailed models Precea 12000-TCC and 9000-TCC, designed specifically for large-scale farms and contractors.
In June 2023: JCB revealed plans to launch its first electric wheeled loader, featuring zero-emission and low-noise capabilities. The loader offers options for wide or narrow wheels and tires, making it suitable for both agricultural and industrial use.
| Report Attributes | Details |
|---|---|
| Market Size in 2023 | USD 171.46 Million |
| Market Size by 2032 | USD 299.44 Million |
| CAGR | CAGR of 6.39% From 2024 to 2032 |
| Base Year | 2023 |
| Forecast Period | 2024-2032 |
| Historical Data | 2020-2022 |
| Report Scope & Coverage | Market Size, Segments Analysis, Competitive Landscape, Regional Analysis, DROC & SWOT Analysis, Forecast Outlook |
| Key Segments | • By Product (Tractors [Less than 40 HP, 41 to 100 HP, More than 100 HP], Harvesters, Combine Harvesters, Forage Harvesters, Planting Equipment [Row Crop Planters, Air Seeders, Grain Drills, Others], Irrigation & Crop Processing Equipment, Spraying Equipment, Hay & Forage Equipment, Others) • By Application (Land Development & Seed Bed Preparation, Sowing & Planting, Weed Cultivation, Plant Protection, Harvesting & Threshing, Post-harvest & Agro-processing) |
| Regional Analysis/Coverage | North America (US, Canada, Mexico), Europe (Eastern Europe [Poland, Romania, Hungary, Turkey, Rest of Eastern Europe] Western Europe] Germany, France, UK, Italy, Spain, Netherlands, Switzerland, Austria, Rest of Western Europe]), Asia Pacific (China, India, Japan, South Korea, Vietnam, Singapore, Australia, Rest of Asia Pacific), Middle East & Africa (Middle East [UAE, Egypt, Saudi Arabia, Qatar, Rest of Middle East], Africa [Nigeria, South Africa, Rest of Africa], Latin America (Brazil, Argentina, Colombia, Rest of Latin America) |
| Company Profiles | AGCO Corporation, Fliegl Agro-Center GmbH, Agromaster, Amazone Inc., APV GmbH, Bellota Agrisolutions, CLAAS KGaA mbH, CNH Industrial N.V., Deere & Company, Escorts Limited, HORSCH Maschinen GmbH, ISEKI & Co., Ltd., J C Bamford Excavators Ltd., Quivogne CEE GmbH (Kiwon RUS LLC), Rostselmash, KUBOTA Corporation, KUHN SAS, Mahindra & Mahindra Ltd., Maschio Gaspardo S.p.A., SDF S.p.A. |
Ans: The Agricultural Equipment Market is expected to grow at a CAGR of 6.39% during 2024-2032.
Ans: The Agricultural Equipment Market was USD 171.46 billion in 2023 and is expected to reach USD 299.44 billion by 2032.
Ans: The Agricultural Equipment Market is rapidly advancing with mechanization and automation, driven by precision farming, GPS-guided tractors, AI-powered machinery, and sustainable solutions, enhancing efficiency and productivity globally.
Ans: The “tractors” segment dominated the Agricultural Equipment Market.
Ans: Asia-Pacific dominated the Agricultural Equipment Market in 2023
Table of Contents
1. Introduction
1.1 Market Definition
1.2 Scope (Inclusion and Exclusions)
1.3 Research Assumptions
2. Executive Summary
2.1 Market Overview
2.2 Regional Synopsis
2.3 Competitive Summary
3. Research Methodology
3.1 Top-Down Approach
3.2 Bottom-up Approach
3.3. Data Validation
3.4 Primary Interviews
4. Market Dynamics Impact Analysis
4.1 Market Driving Factors Analysis
4.1.2 Drivers
4.1.2 Restraints
4.1.3 Opportunities
4.1.4 Challenges
4.2 PESTLE Analysis
4.3 Porter’s Five Forces Model
5. Statistical Insights and Trends Reporting
5.1 Production Volume, by Region (2020-2023)
5.2 Market Penetration Rates, by Region (2020-2023)
5.3 Equipment Utilization Efficiency, by Type and Region
5.4 R&D and Innovation Trends in Agricultural Equipment
5.5 Export/Import Trends, by Region (2023)
6. Competitive Landscape
6.1 List of Major Companies, By Region
6.2 Market Share Analysis, By Region
6.3 Product Benchmarking
6.3.1 Product specifications and features
6.3.2 Pricing
6.4 Strategic Initiatives
6.4.1 Marketing and promotional activities
6.4.2 Distribution and supply chain strategies
6.4.3 Expansion plans and new product launches
6.4.4 Strategic partnerships and collaborations
6.5 Technological Advancements
6.6 Market Positioning and Branding
7. Agricultural Equipment Market Segmentation, By Product
7.1 Chapter Overview
7.2 Tractors
7.2.1 Tractors Market Trends Analysis (2020-2032)
7.2.2 Tractors Market Size Estimates and Forecasts to 2032 (USD Billion)
7.2.3 Less than 40 HP
7.2.3.1 Less than 40 HP Market Trends Analysis (2020-2032)
7.2.3.2 Less than 40 HP Market Size Estimates and Forecasts to 2032 (USD Billion)
7.2.4 41 to 100 HP
7.2.4.1 41 to 100 HP Market Trends Analysis (2020-2032)
7.2.4.2 41 to 100 HP Market Size Estimates and Forecasts to 2032 (USD Billion)
7.2.5 More than 100 HP
7.2.5.1 More than 100 HP Market Trends Analysis (2020-2032)
7.2.5.2 More than 100 HP Market Size Estimates and Forecasts to 2032 (USD Billion)
7.3 Harvesters
7.3.1 Harvesters Market Trends Analysis (2020-2032)
7.3.2 Harvesters market Size Estimates and Forecasts to 2032 (USD Billion)
7.4 Combine Harvesters
7.4.1 Combine Harvesters Market Trends Analysis (2020-2032)
7.4.2 Combine Harvesters market Size Estimates and Forecasts to 2032 (USD Billion)
7.5 Forage Harvesters
7.5.1 Forage Harvesters Market Trends Analysis (2020-2032)
7.5.2 Forage Harvesters market Size Estimates and Forecasts to 2032 (USD Billion)
7.6 Planting Equipment
7.6.1 Planting Equipment Market Trends Analysis (2020-2032)
7.6.2 Planting Equipment market Size Estimates and Forecasts to 2032 (USD Billion)
7.6.3 Row Crop Planters
7.6.3.1 Row Crop Planters Market Trends Analysis (2020-2032)
7.6.3.2 Row Crop Planters market Size Estimates and Forecasts to 2032 (USD Billion)
7.6.4 Air Seeders
7.6.4.1 Air Seeders Market Trends Analysis (2020-2032)
7.6.4.2 Air Seeders market Size Estimates and Forecasts to 2032 (USD Billion)
7.6.5 Grain Drills
7.6.5.1 Grain Drills Market Trends Analysis (2020-2032)
7.6.5.2 Grain Drills market Size Estimates and Forecasts to 2032 (USD Billion)
7.6.6 Others
7.6.6.1 Others Market Trends Analysis (2020-2032)
7.6.6.2 Others market Size Estimates and Forecasts to 2032 (USD Billion)
7.7 Irrigation & Crop Processing Equipment
7.7.1 Irrigation & Crop Processing Equipment Market Trends Analysis (2020-2032)
7.7.2 Irrigation & Crop Processing Equipment market Size Estimates and Forecasts to 2032 (USD Billion)
7.8 Spraying Equipment
7.8.1 Spraying Equipment Market Trends Analysis (2020-2032)
7.8.2 Spraying Equipment market Size Estimates and Forecasts to 2032 (USD Billion)
7.9 Hay & Forage Equipment
7.9.1 Hay & Forage Equipment Market Trends Analysis (2020-2032)
7.9.2 Hay & Forage Equipment market Size Estimates and Forecasts to 2032 (USD Billion)
7.10 Others
7.10.1 Others Market Trends Analysis (2020-2032)
7.10.2 Others market Size Estimates and Forecasts to 2032 (USD Billion)
8. Agricultural Equipment Market Segmentation, By Application
8.1 Chapter Overview
8.2 Land Development & Seed Bed Preparation
8.2.1 Land Development & Seed Bed Preparation Market Trends Analysis (2020-2032)
8.2.2 Land Development & Seed Bed Preparation Market Size Estimates and Forecasts to 2032 (USD Billion)
8.3 Sowing & Planting
8.3.1 Sowing & Planting Market Trends Analysis (2020-2032)
8.3.2 Sowing & Planting Market Size Estimates and Forecasts to 2032 (USD Billion)
8.4 Weed Cultivation
8.4.1Weed Cultivation Market Trends Analysis (2020-2032)
8.4.2 Weed Cultivation Market Size Estimates and Forecasts to 2032 (USD Billion)
8.5 Plant Protection
8.5.1 Plant Protection Market Trends Analysis (2020-2032)
8.5.2 Plant Protection Market Size Estimates and Forecasts to 2032 (USD Billion)
8.6 Harvesting & Threshing
8.6.1 Harvesting & Threshing Market Trends Analysis (2020-2032)
8.6.2 Harvesting & Threshing Market Size Estimates and Forecasts to 2032 (USD Billion)
8.7 Post-harvest & Agro-processing
8.7.1 Post-harvest & Agro-processing Market Trends Analysis (2020-2032)
8.7.2 Post-harvest & Agro-processing Market Size Estimates and Forecasts to 2032 (USD Billion)
9. Regional Analysis
9.1 Chapter Overview
9.2 North America
9.2.1 Trends Analysis
9.2.2 North America Agricultural Equipment Market Estimates and Forecasts, by Country (2020-2032) (USD Million)
9.2.3 North America Agricultural Equipment Market Estimates and Forecasts, By Technology (2020-2032) (USD Million)
9.2.4 North America Agricultural Equipment Market Estimates and Forecasts, By End-Use (2020-2032) (USD Million)
9.2.5 USA
9.2.5.1 USA Agricultural Equipment Market Estimates and Forecasts, By Technology (2020-2032) (USD Million)
9.2.5.2 USA Agricultural Equipment Market Estimates and Forecasts, By End-Use (2020-2032) (USD Million)
9.2.6 Canada
9.2.6.1 Canada Agricultural Equipment Market Estimates and Forecasts, By Technology (2020-2032) (USD Million)
9.2.6.2 Canada Agricultural Equipment Market Estimates and Forecasts, By End-Use (2020-2032) (USD Million)
9.2.7 Mexico
9.2.7.1 Mexico Agricultural Equipment Market Estimates and Forecasts, By Technology (2020-2032) (USD Million)
9.2.7.2 Mexico Agricultural Equipment Market Estimates and Forecasts, By End-Use (2020-2032) (USD Million)
9.3 Europe
9.3.1 Eastern Europe
9.3.1.1 Trends Analysis
9.3.1.2 Eastern Europe Agricultural Equipment Market Estimates and Forecasts, by Country (2020-2032) (USD Million)
9.3.1.3 Eastern Europe Agricultural Equipment Market Estimates and Forecasts, By Technology (2020-2032) (USD Million)
9.3.1.4 Eastern Europe Agricultural Equipment Market Estimates and Forecasts, By End-Use (2020-2032) (USD Million)
9.3.1.5 Poland
9.3.1.5.1 Poland Agricultural Equipment Market Estimates and Forecasts, By Technology (2020-2032) (USD Million)
9.3.1.5.2 Poland Agricultural Equipment Market Estimates and Forecasts, By End-Use (2020-2032) (USD Million)
9.3.1.6 Romania
9.3.1.6.1 Romania Agricultural Equipment Market Estimates and Forecasts, By Technology (2020-2032) (USD Million)
9.3.1.6.2 Romania Agricultural Equipment Market Estimates and Forecasts, By End-Use (2020-2032) (USD Million)
9.3.1.7 Hungary
9.3.1.7.1 Hungary Agricultural Equipment Market Estimates and Forecasts, By Technology (2020-2032) (USD Million)
9.3.1.7.2 Hungary Agricultural Equipment Market Estimates and Forecasts, By End-Use (2020-2032) (USD Million)
9.3.1.8 Turkey
9.3.1.8.1 Turkey Agricultural Equipment Market Estimates and Forecasts, By Technology (2020-2032) (USD Million)
9.3.1.8.2 Turkey Agricultural Equipment Market Estimates and Forecasts, By End-Use (2020-2032) (USD Million)
9.3.1.9 Rest of Eastern Europe
9.3.1.9.1 Rest of Eastern Europe Agricultural Equipment Market Estimates and Forecasts, By Technology (2020-2032) (USD Million)
9.3.1.9.2 Rest of Eastern Europe Agricultural Equipment Market Estimates and Forecasts, By End-Use (2020-2032) (USD Million)
9.3.2 Western Europe
9.3.2.1 Trends Analysis
9.3.2.2 Western Europe Agricultural Equipment Market Estimates and Forecasts, by Country (2020-2032) (USD Million)
9.3.2.3 Western Europe Agricultural Equipment Market Estimates and Forecasts, By Technology (2020-2032) (USD Million)
9.3.2.4 Western Europe Agricultural Equipment Market Estimates and Forecasts, By End-Use (2020-2032) (USD Million)
9.3.2.5 Germany
9.3.2.5.1 Germany Agricultural Equipment Market Estimates and Forecasts, By Technology (2020-2032) (USD Million)
9.3.2.5.2 Germany Agricultural Equipment Market Estimates and Forecasts, By End-Use (2020-2032) (USD Million)
9.3.2.6 France
9.3.2.6.1 France Agricultural Equipment Market Estimates and Forecasts, By Technology (2020-2032) (USD Million)
9.3.2.6.2 France Agricultural Equipment Market Estimates and Forecasts, By End-Use (2020-2032) (USD Million)
9.3.2.7 UK
9.3.2.7.1 UK Agricultural Equipment Market Estimates and Forecasts, By Technology (2020-2032) (USD Million)
9.3.2.7.2 UK Agricultural Equipment Market Estimates and Forecasts, By End-Use (2020-2032) (USD Million)
9.3.2.8 Italy
9.3.2.8.1 Italy Agricultural Equipment Market Estimates and Forecasts, By Technology (2020-2032) (USD Million)
9.3.2.8.2 Italy Agricultural Equipment Market Estimates and Forecasts, By End-Use (2020-2032) (USD Million)
9.3.2.9 Spain
9.3.2.9.1 Spain Agricultural Equipment Market Estimates and Forecasts, By Technology (2020-2032) (USD Million)
9.3.2.9.2 Spain Agricultural Equipment Market Estimates and Forecasts, By End-Use (2020-2032) (USD Million)
9.3.2.10 Netherlands
9.3.2.10.1 Netherlands Agricultural Equipment Market Estimates and Forecasts, By Technology (2020-2032) (USD Million)
9.3.2.10.2 Netherlands Agricultural Equipment Market Estimates and Forecasts, By End-Use (2020-2032) (USD Million)
9.3.2.11 Switzerland
9.3.2.11.1 Switzerland Agricultural Equipment Market Estimates and Forecasts, By Technology (2020-2032) (USD Million)
9.3.2.11.2 Switzerland Agricultural Equipment Market Estimates and Forecasts, By End-Use (2020-2032) (USD Million)
9.3.2.12 Austria
9.3.2.12.1 Austria Agricultural Equipment Market Estimates and Forecasts, By Technology (2020-2032) (USD Million)
9.3.2.12.2 Austria Agricultural Equipment Market Estimates and Forecasts, By End-Use (2020-2032) (USD Million)
9.3.2.13 Rest of Western Europe
9.3.2.13.1 Rest of Western Europe Agricultural Equipment Market Estimates and Forecasts, By Technology (2020-2032) (USD Million)
9.3.2.13.2 Rest of Western Europe Agricultural Equipment Market Estimates and Forecasts, By End-Use (2020-2032) (USD Million)
9.4 Asia Pacific
9.4.1 Trends Analysis
9.4.2 Asia Pacific Agricultural Equipment Market Estimates and Forecasts, by Country (2020-2032) (USD Million)
9.4.3 Asia Pacific Agricultural Equipment Market Estimates and Forecasts, By Technology (2020-2032) (USD Million)
9.4.4 Asia Pacific Agricultural Equipment Market Estimates and Forecasts, By End-Use (2020-2032) (USD Million)
9.4.5 China
9.4.5.1 China Agricultural Equipment Market Estimates and Forecasts, By Technology (2020-2032) (USD Million)
9.4.5.2 China Agricultural Equipment Market Estimates and Forecasts, By End-Use (2020-2032) (USD Million)
9.4.6 India
9.4.5.1 India Agricultural Equipment Market Estimates and Forecasts, By Technology (2020-2032) (USD Million)
9.4.5.2 India Agricultural Equipment Market Estimates and Forecasts, By End-Use (2020-2032) (USD Million)
9.4.5 Japan
9.4.5.1 Japan Agricultural Equipment Market Estimates and Forecasts, By Technology (2020-2032) (USD Million)
9.4.5.2 Japan Agricultural Equipment Market Estimates and Forecasts, By End-Use (2020-2032) (USD Million)
9.4.6 South Korea
9.4.6.1 South Korea Agricultural Equipment Market Estimates and Forecasts, By Technology (2020-2032) (USD Million)
9.4.6.2 South Korea Agricultural Equipment Market Estimates and Forecasts, By End-Use (2020-2032) (USD Million)
9.4.7 Vietnam
9.4.7.1 Vietnam Agricultural Equipment Market Estimates and Forecasts, By Technology (2020-2032) (USD Million)
9.2.7.2 Vietnam Agricultural Equipment Market Estimates and Forecasts, By End-Use (2020-2032) (USD Million)
9.4.8 Singapore
9.4.8.1 Singapore Agricultural Equipment Market Estimates and Forecasts, By Technology (2020-2032) (USD Million)
9.4.8.2 Singapore Agricultural Equipment Market Estimates and Forecasts, By End-Use (2020-2032) (USD Million)
9.4.9 Australia
9.4.9.1 Australia Agricultural Equipment Market Estimates and Forecasts, By Technology (2020-2032) (USD Million)
9.4.9.2 Australia Agricultural Equipment Market Estimates and Forecasts, By End-Use (2020-2032) (USD Million)
9.4.10 Rest of Asia Pacific
9.4.10.1 Rest of Asia Pacific Agricultural Equipment Market Estimates and Forecasts, By Technology (2020-2032) (USD Million)
9.4.10.2 Rest of Asia Pacific Agricultural Equipment Market Estimates and Forecasts, By End-Use (2020-2032) (USD Million)
9.5 Middle East and Africa
9.5.1 Middle East
9.5.1.1 Trends Analysis
9.5.1.2 Middle East Agricultural Equipment Market Estimates and Forecasts, by Country (2020-2032) (USD Million)
9.5.1.3 Middle East Agricultural Equipment Market Estimates and Forecasts, By Technology (2020-2032) (USD Million)
9.5.1.4 Middle East Agricultural Equipment Market Estimates and Forecasts, By End-Use (2020-2032) (USD Million)
9.5.1.5 UAE
9.5.1.5.1 UAE Agricultural Equipment Market Estimates and Forecasts, By Technology (2020-2032) (USD Million)
9.5.1.5.2 UAE Agricultural Equipment Market Estimates and Forecasts, By End-Use (2020-2032) (USD Million)
9.5.1.6 Egypt
9.5.1.6.1 Egypt Agricultural Equipment Market Estimates and Forecasts, By Technology (2020-2032) (USD Million)
9.5.1.6.2 Egypt Agricultural Equipment Market Estimates and Forecasts, By End-Use (2020-2032) (USD Million)
9.5.1.7 Saudi Arabia
9.5.1.7.1 Saudi Arabia Agricultural Equipment Market Estimates and Forecasts, By Technology (2020-2032) (USD Million)
9.5.1.7.2 Saudi Arabia Agricultural Equipment Market Estimates and Forecasts, By End-Use (2020-2032) (USD Million)
9.5.1.8 Qatar
9.5.1.8.1 Qatar Agricultural Equipment Market Estimates and Forecasts, By Technology (2020-2032) (USD Million)
9.5.1.8.2 Qatar Agricultural Equipment Market Estimates and Forecasts, By End-Use (2020-2032) (USD Million)
9.5.1.9 Rest of Middle East
9.5.1.9.1 Rest of Middle East Agricultural Equipment Market Estimates and Forecasts, By Technology (2020-2032) (USD Million)
9.5.1.9.2 Rest of Middle East Agricultural Equipment Market Estimates and Forecasts, By End-Use (2020-2032) (USD Million)
9.5.2 Africa
9.5.2.1 Trends Analysis
9.5.2.2 Africa Agricultural Equipment Market Estimates and Forecasts, by Country (2020-2032) (USD Million)
9.5.2.3 Africa Agricultural Equipment Market Estimates and Forecasts, By Technology (2020-2032) (USD Million)
9.5.2.4 Africa Agricultural Equipment Market Estimates and Forecasts, By End-Use (2020-2032) (USD Million)
9.5.2.5 South Africa
9.5.2.5.1 South Africa Agricultural Equipment Market Estimates and Forecasts, By Technology (2020-2032) (USD Million)
9.5.2.5.2 South Africa Agricultural Equipment Market Estimates and Forecasts, By End-Use (2020-2032) (USD Million)
9.5.2.6 Nigeria
9.5.2.6.1 Nigeria Agricultural Equipment Market Estimates and Forecasts, By Technology (2020-2032) (USD Million)
9.5.2.6.2 Nigeria Agricultural Equipment Market Estimates and Forecasts, By End-Use (2020-2032) (USD Million)
9.5.2.7 Rest of Africa
9.5.2.7.1 Rest of Africa Agricultural Equipment Market Estimates and Forecasts, By Technology (2020-2032) (USD Million)
9.5.2.7.2 Rest of Africa Agricultural Equipment Market Estimates and Forecasts, By End-Use (2020-2032) (USD Million)
9.6 Latin America
9.6.1 Trends Analysis
9.6.2 Latin America Agricultural Equipment Market Estimates and Forecasts, by Country (2020-2032) (USD Million)
9.6.3 Latin America Agricultural Equipment Market Estimates and Forecasts, By Technology (2020-2032) (USD Million)
9.6.4 Latin America Agricultural Equipment Market Estimates and Forecasts, By End-Use (2020-2032) (USD Million)
9.6.5 Brazil
9.6.5.1 Brazil Agricultural Equipment Market Estimates and Forecasts, By Technology (2020-2032) (USD Million)
9.6.5.2 Brazil Agricultural Equipment Market Estimates and Forecasts, By End-Use (2020-2032) (USD Million)
9.6.6 Argentina
9.6.6.1 Argentina Agricultural Equipment Market Estimates and Forecasts, By Technology (2020-2032) (USD Million)
9.6.6.2 Argentina Agricultural Equipment Market Estimates and Forecasts, By End-Use (2020-2032) (USD Million)
9.6.7 Colombia
9.6.7.1 Colombia Agricultural Equipment Market Estimates and Forecasts, By Technology (2020-2032) (USD Million)
9.6.7.2 Colombia Agricultural Equipment Market Estimates and Forecasts, By End-Use (2020-2032) (USD Million)
9.6.8 Rest of Latin America
9.6.8.1 Rest of Latin America Agricultural Equipment Market Estimates and Forecasts, By Technology (2020-2032) (USD Million)
9.6.8.2 Rest of Latin America Agricultural Equipment Market Estimates and Forecasts, By End-Use (2020-2032) (USD Million)
10. Company Profiles
10.1 ISEKI & Co., Ltd.
10.1.1 Company Overview
10.1.2 Financial
10.1.3 Products/ Services Offered
110.1.4 SWOT Analysis
10.2 CLAAS KGaA mbH
10.2.1 Company Overview
10.2.2 Financial
10.2.3 Products/ Services Offered
10.2.4 SWOT Analysis
10.3 Escorts Limited
10.3.1 Company Overview
10.3.2 Financial
10.3.3 Products/ Services Offered
10.3.4 SWOT Analysis
10.4 Bellota Agrisolutions
10.4.1 Company Overview
10.4.2 Financial
10.4.3 Products/ Services Offered
10.4.4 SWOT Analysis
10.5 CNH Industrial N.V.
10.5.1 Company Overview
10.5.2 Financial
10.5.3 Products/ Services Offered
10.5.4 SWOT Analysis
10.6 HORSCH Maschinen GmbH
10.6.1 Company Overview
10.6.2 Financial
10.6.3 Products/ Services Offered
10.6.4 SWOT Analysis
10.7 AGCO Corporation
10.7.1 Company Overview
10.7.2 Financial
10.7.3 Products/ Services Offered
10.7.4 SWOT Analysis
10.8 APV GmbH
10.8.1 Company Overview
10.8.2 Financial
10.8.3 Products/ Services Offered
10.8.4 SWOT Analysis
10.9 Fliegl Agro-Center GmbH
10.9.1 Company Overview
10.9.2 Financial
10.9.3 Products/ Services Offered
10.9.4 SWOT Analysis
10.10 Deere & Company
10.9.1 Company Overview
10.9.2 Financial
10.9.3 Products/ Services Offered
10.9.4 SWOT Analysis
11. Use Cases and Best Practices
12. Conclusion
An accurate research report requires proper strategizing as well as implementation. There are multiple factors involved in the completion of good and accurate research report and selecting the best methodology to compete the research is the toughest part. Since the research reports we provide play a crucial role in any company’s decision-making process, therefore we at SNS Insider always believe that we should choose the best method which gives us results closer to reality. This allows us to reach at a stage wherein we can provide our clients best and accurate investment to output ratio.
Each report that we prepare takes a timeframe of 350-400 business hours for production. Starting from the selection of titles through a couple of in-depth brain storming session to the final QC process before uploading our titles on our website we dedicate around 350 working hours. The titles are selected based on their current market cap and the foreseen CAGR and growth.
The 5 steps process:
Step 1: Secondary Research:
Secondary Research or Desk Research is as the name suggests is a research process wherein, we collect data through the readily available information. In this process we use various paid and unpaid databases which our team has access to and gather data through the same. This includes examining of listed companies’ annual reports, Journals, SEC filling etc. Apart from this our team has access to various associations across the globe across different industries. Lastly, we have exchange relationships with various university as well as individual libraries.

Step 2: Primary Research
When we talk about primary research, it is a type of study in which the researchers collect relevant data samples directly, rather than relying on previously collected data. This type of research is focused on gaining content specific facts that can be sued to solve specific problems. Since the collected data is fresh and first hand therefore it makes the study more accurate and genuine.
We at SNS Insider have divided Primary Research into 2 parts.
Part 1 wherein we interview the KOLs of major players as well as the upcoming ones across various geographic regions. This allows us to have their view over the market scenario and acts as an important tool to come closer to the accurate market numbers. As many as 45 paid and unpaid primary interviews are taken from both the demand and supply side of the industry to make sure we land at an accurate judgement and analysis of the market.
This step involves the triangulation of data wherein our team analyses the interview transcripts, online survey responses and observation of on filed participants. The below mentioned chart should give a better understanding of the part 1 of the primary interview.

Part 2: In this part of primary research the data collected via secondary research and the part 1 of the primary research is validated with the interviews from individual consultants and subject matter experts.
Consultants are those set of people who have at least 12 years of experience and expertise within the industry whereas Subject Matter Experts are those with at least 15 years of experience behind their back within the same space. The data with the help of two main processes i.e., FGDs (Focused Group Discussions) and IDs (Individual Discussions). This gives us a 3rd party nonbiased primary view of the market scenario making it a more dependable one while collation of the data pointers.
Step 3: Data Bank Validation
Once all the information is collected via primary and secondary sources, we run that information for data validation. At our intelligence centre our research heads track a lot of information related to the market which includes the quarterly reports, the daily stock prices, and other relevant information. Our data bank server gets updated every fortnight and that is how the information which we collected using our primary and secondary information is revalidated in real time.

Step 4: QA/QC Process
After all the data collection and validation our team does a final level of quality check and quality assurance to get rid of any unwanted or undesired mistakes. This might include but not limited to getting rid of the any typos, duplication of numbers or missing of any important information. The people involved in this process include technical content writers, research heads and graphics people. Once this process is completed the title gets uploader on our platform for our clients to read it.
Step 5: Final QC/QA Process:
This is the last process and comes when the client has ordered the study. In this process a final QA/QC is done before the study is emailed to the client. Since we believe in giving our clients a good experience of our research studies, therefore, to make sure that we do not lack at our end in any way humanly possible we do a final round of quality check and then dispatch the study to the client.
By Product
Tractors
Less than 40 HP
41 to 100 HP
More than 100 HP
Harvesters
Combine Harvesters
Forage Harvesters
Planting Equipment
Row Crop Planters
Air Seeders
Grain Drills
Others
Irrigation & Crop Processing Equipment
Spraying Equipment
Hay & Forage Equipment
Others
By Application
Land Development & Seed Bed Preparation
Sowing & Planting
Weed Cultivation
Plant Protection
Harvesting & Threshing
Post-harvest & Agro-processing
Request for Segment Customization as per your Business Requirement: Segment Customization Request
North America
US
Canada
Mexico
Europe
Eastern Europe
Poland
Romania
Hungary
Turkey
Rest of Eastern Europe
Western Europe
Germany
France
UK
Italy
Spain
Netherlands
Switzerland
Austria
Rest of Western Europe
Asia Pacific
China
India
Japan
South Korea
Vietnam
Singapore
Australia
Rest of Asia Pacific
Middle East & Africa
Middle East
UAE
Egypt
Saudi Arabia
Qatar
Rest of Middle East
Africa
Nigeria
South Africa
Rest of Africa
Latin America
Brazil
Argentina
Colombia
Rest of Latin America
Request for Country Level Research Report: Country Level Customization Request
Available Customization
With the given market data, SNS Insider offers customization as per the company’s specific needs. The following customization options are available for the report:
Detailed Volume Analysis
Criss-Cross segment analysis (e.g. Product X Application)
Competitive Product Benchmarking
Geographic Analysis
Additional countries in any of the regions
Customized Data Representation
Detailed analysis and profiling of additional market players
The Elevator and Escalator Market size was estimated at USD 149.2 billion in 2023 and is expected to reach USD 265.2 billion by 2032 at a CAGR of 6.6% during the forecast period of 2024-2032.
The Woodworking Machinery Market size was estimated at USD 4.87 billion in 2023 and is expected to reach USD 7.42 billion by 2032 at a CAGR of 4.8% during the forecast period of 2024-2032.
The CNC Milling Machine Tools Market size was valued at USD 78.6 billion in 2023 and is expected to reach USD 105.92 billion by 2031 and grow at a CAGR of 3.8% over the forecast period 2024-2031.
The Mass Flow Controller Market Size was valued at USD 1.32 Billion in 2023 and will Reach to $2.16 Billion by 2031, displaying a CAGR of 5.61% by 2024-2031.
Industrial Vacuum Cleaner Market size was estimated at USD 1.06 Billion in 2023 and is expected to reach USD 1.78 Billion by 2032 at a CAGR of 5.95% during the forecast period of 2024-2032.
The Renting & Leasing Test and Measurement Equipment Market Size was esteemed at USD 6.35 billion in 2023 and is supposed to arrive at USD 9.61 billion by 2032 with a growing CAGR of 4.71% over the forecast period 2024-2032.

Hi! Click one of our member below to chat on Phone
© 2025 All Rights Reserved by SNS Insider Pvt Ltd


