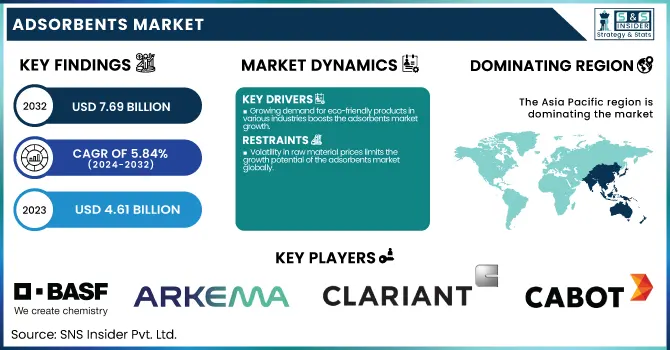
The Adsorbents Market size was USD 4.61 billion in 2023 and is expected to reach USD 7.69 billion by 2032 and grow at a CAGR of 5.84% over the forecast period of 2024-2032.
To Get more information on Adsorbents Market - Request Free Sample Report
The Statistical Insights and Trends Reporting for the Adsorbents Market provides an in-depth look at critical industry indicators. It includes data on production capacity and utilization rates by adsorbent type and key producing regions for 2023, helping to benchmark operational efficiency. The report also analyzes feedstock cost trends by adsorbent category, offering insight into pricing pressures. Additionally, it evaluates regulatory impacts across major markets, with emphasis on environmental compliance. The report presents emissions profiles, waste management practices, and sustainability initiatives by region, highlighting progress toward green manufacturing. Furthermore, it assesses innovation pipelines and R&D investments by type, alongside insights into software adoption for material performance modeling and regulatory tracking in the adsorbents value chain.
The United States held the largest share in the Adsorbents Market in 2023, with a market size of USD 0.83 billion, projected to reach USD 1.46 billion by 2032, growing at a CAGR of 6.45% during 2024–2032. It is due to its strong industrial base, particularly in sectors such as oil & gas, chemicals, water treatment, and air separation. The country is home to numerous refineries and petrochemical facilities, which are major consumers of adsorbents like molecular sieves, activated alumina, and activated carbon for drying, purification, and separation processes. Additionally, stringent environmental regulations enforced by agencies such as the EPA have driven the adoption of advanced adsorbents for emissions control and waste management. The presence of leading market players, robust R&D investments, and widespread adoption of innovative adsorbent technologies have further strengthened the U.S. market. Moreover, the increasing demand for clean water and industrial gas processing supports continued growth and dominant market positioning in the region.
Drivers
Growing demand for eco-friendly products in various industries boosts the adsorbents market growth.
The increasing global focus on sustainability and environmental protection is significantly driving the demand for eco-friendly adsorbents across various industries. Sectors such as oil & gas, water treatment, and food & beverages are actively adopting environmentally safe and biodegradable adsorbents like activated carbon and silica gel to comply with stringent environmental regulations. Regulatory bodies such as the U.S. Environmental Protection Agency (EPA) and the European Environment Agency (EEA) are implementing tighter emission standards and waste discharge limits, pushing industries to shift toward sustainable solutions. Additionally, industries are becoming more conscious of their carbon footprints and waste management practices, further accelerating the adoption of green adsorbents. This trend is not only boosting demand for natural and renewable adsorbent materials but also encouraging innovation in bio-based adsorbent development, thereby positively influencing market growth.
Restrain
Volatility in raw material prices limits the growth potential of the adsorbents market globally.
Fluctuating raw material prices present a significant restraint to the growth of the adsorbents market. Key materials used in the production of adsorbents, such as coal, alumina, and silica, are subject to price volatility due to changing supply-demand dynamics, geopolitical tensions, and trade regulations. These unpredictable cost variations can severely impact the profitability of manufacturers, especially those operating on thin margins. Moreover, the reliance on non-renewable sources for raw materials makes the supply chain more vulnerable to disruptions. This uncertainty often discourages long-term investments and expansion plans in the market. Smaller players, in particular, face challenges in absorbing high raw material costs, which can affect product pricing and competitiveness. As a result, such market fluctuations hinder consistent growth and pose challenges in meeting the increasing global demand for high-performance adsorbents.
Opportunity
Rising demand from emerging economies presents lucrative growth opportunities for adsorbents market players.
The growing industrialization and urbanization across emerging economies, particularly in Asia-Pacific, Latin America, and the Middle East, are opening up substantial growth opportunities for the adsorbents market. Rapid developments in sectors such as petroleum refining, chemical manufacturing, gas processing, and municipal water treatment in countries like India, China, Brazil, and Saudi Arabia are creating strong demand for adsorbents to enhance purification and separation processes. Moreover, these regions are increasingly implementing environmental regulations aligned with global standards, pushing industries to adopt advanced adsorbent technologies. Government investments in clean water initiatives, air quality improvement, and industrial waste reduction are also supporting market expansion. Furthermore, rising awareness about environmental protection and a shift toward sustainable industrial operations in these economies are expected to drive long-term demand, providing global players with untapped market potential and new revenue streams.
Challenge
Stringent environmental and disposal regulations create operational challenges for adsorbent manufacturers worldwide.
While environmental regulations drive demand, they also impose significant operational challenges for adsorbent manufacturers, particularly concerning production emissions and waste disposal. The manufacturing of certain types of adsorbents, such as activated carbon and alumina-based materials, can involve energy-intensive processes that generate carbon emissions and hazardous byproducts. Regulatory authorities in the U.S., European Union, and Japan have imposed strict norms on emissions, waste disposal, and environmental compliance, increasing the operational burden on producers. Complying with these regulations requires continuous investments in pollution control technologies, process upgrades, and certifications, which can escalate production costs and limit profit margins. Additionally, the disposal of spent adsorbents, especially those used in industrial gas and liquid purification, must follow hazardous waste protocols, further complicating logistics and increasing compliance overheads. These constraints challenge both scalability and innovation in the global adsorbents market.
By Type
Molecular Sieves held the largest market share at around 44% in 2023. It is owing to the presence of factors such as better adsorption characteristics, greater selectivity, and thermal stability, which make it suitable for different types of industrial applications. They are crucial for gas drying, air separation, petroleum refining, and chemical processing, as these synthetic zeolites are used for the effective separation of molecules on a size and polarity basis. Molecular sieves are widely used in oil & gas and petrochemical sectors for dehydration and purification, as they are highly effective adsorbents of both water and impurities from hydrocarbons and natural gas. Their reusability and long life make them even more cost-effective and appealing. In addition, increasing demand for energy-efficient and environmentally compliant separation technologies is fueling the demand for molecular sieves across major end-use industries, thereby bolstering their dominance among adsorbents in the global adsorbents market.
By Application
Petroleum refining held the largest market share, around 26%, in 2023. It is due to the high need for high-performance adsorbents in the purification and separation processes taking place in this sector. The use of adsorbents such as molecular sieves, activated alumina, and activated carbon for drying, desulfurization, and removal of impurities from feedstocks and final products is widespread in petroleum refining. They contribute to the enhancement of fuel quality, compliance with environmental regulations, and an increase in operational efficiencies. This sector will continue to stay in a dominant position as the average industrial demand for refined petroleum products such as gasoline, diesel, and jet fuel remains high globally, especially in emerging economies. Increasingly stringent government-mandated emissions and fuel quality standards, such as those from the U.S. EPA and the European Union, have raised the requirement for advanced adsorbents in refining. Such heavy dependency on industry bolsters petroleum refining to dominate the top on-demand application segment in the market.
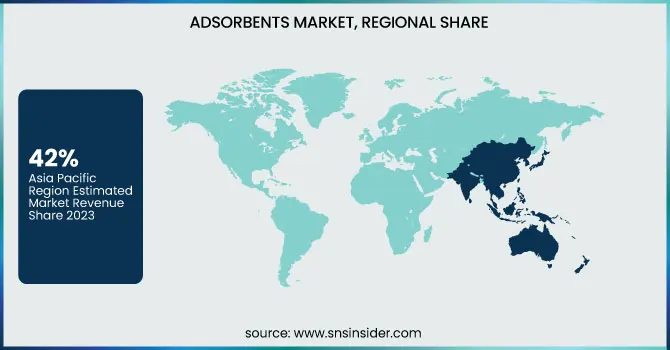
Asia Pacific held the largest market share, around 42%, in 2023. It is due to the high demand of adsorbents from the key end-use sectors, rapidly developing industrial base, and the positive government support in various countries present in the Asia Pacific region. In this region, the petroleum refining, chemical manufacturing, gas processing, and water treatment industries are growing rapidly, as these industries are important consumers of adsorbents (molecular sieves, activated carbon, and silica gel). Growing emphasis on environmental sustainability in the region and stringent regulations on emissions and wastewater disposal are other major factors fueling the advanced adsorbent technologies market. In addition, availability of inexpensive manufacturing facilities, raw materials availability and rising foreign investments in industrial as well as environmental sectors has positively facilitated growth of the market. An increase in population, urbanization, and industrialization in Asia Pacific region are expected to require clean water for municipal use, processed food and air purification, which will augment the demand for adsorbents for different applications.
North America held a significant market share. It is owing to the presence of a strong industrial base, high demand from end-use industries such as oil & gas, chemicals, and water treatment, and stringent environmental regulations. Adsorbents such as molecular sieves and activated alumina play a pivotal role in purification and separation of hydrocarbons and petrochemicals, especially in the United States, one of the largest centres for petroleum refining and petrochemical production. The introduction of stringent emission regulations and waste disposal standards by the regulatory authority, for instance, the U.S. Environmental Protection Agency (EPA) has prompted industries to deploy sophisticated adsorbent technologies to meet these standards. Moreover, the region exhibits high innovation potential, with players investing in the development of high-performance and environmentally sustainable adsorbent materials based on advanced functional composites and polymers. This means that the region will also continue to remain relevant at a global scale, owing to the continually growing demand for purification of clean water, industrial gases, and air.
Get Customized Report as per Your Business Requirement - Enquiry Now
BASF SE (Sorbead, Purmol)
Arkema S.A. (Siliporite, Orgalloy)
Clariant AG (Tonsil, Tri-Sorb)
Cabot Corporation (Darco, Norit)
Honeywell International Inc. (UOP Sorbent Guard, UOP Sorbplus)
W. R. Grace & Co. (SYLOBEAD, Davison)
Axens (AxSorb, AxTrap)
Zeochem (ZEOsphere, ZEOcat)
Merck KGaA (Supelco, Isolute)
Molecular Products Group (ProCarb, CarboSorb)
Kuraray Co., Ltd. (Eval, KURASPERSE)
AGC Chemicals (SunSpear, Sunsep)
Süd-Chemie (Sorbacal, Tonsil Optimum)
Calgon Carbon Corporation (Centaur, Filtrasorb)
Osaka Gas Chemicals Co., Ltd. (Shirasagi, Gasguard)
Sorbead India (Sorbead R, Silica Gel Blue)
Jalon (JLOX-100, JL-CMS)
Zhejiang Zhengguang Industrial Co., Ltd. (ZGG-13X, ZGG-4A)
Shandong Qilu Petrochemical Engineering Co., Ltd. (QL-13X, QL-5A)
Fujian Yuanli Active Carbon Co., Ltd. (YLCARB, YL-GAC)
In 2023, Clariant AG introduced Desi Pak Eco, moisture-absorbing packets made from bio-based paper, designed to safeguard packaged goods from moisture damage.
In 2023, Honeywell International Inc. partnered with India's DRDO and CSIR-IIP to boost oxygen production by reallocating adsorbent supplies to medical oxygen plants.
In 2023, Zeolyst International introduced a new product portfolio featuring Opal Renew, Opal Infinity, Opal Pure, and Opal Blue, aimed at enhancing innovations in zeolite catalysis and adsorption.
Report Attributes | Details |
---|---|
Market Size in 2023 | USD 4.61 Billion |
Market Size by 2032 | USD 7.69 Billion |
CAGR | CAGR of5.84 % From 2024 to 2032 |
Base Year | 2023 |
Forecast Period | 2024-2032 |
Historical Data | 2020-2022 |
Report Scope & Coverage | Market Size, Segments Analysis, Competitive Landscape, Regional Analysis, DROC & SWOT Analysis, Forecast Outlook |
Key Segments | • By Type (Molecular Sieves, Activated Carbon, Silica Gel, Activated Alumina, Others) • By Application (Petroleum refining, Chemicals/Petrochemicals, Gas refining, Water treatment, Air Separation & Drying, Packaging, Others) |
Regional Analysis/Coverage | North America (US, Canada, Mexico), Europe (Eastern Europe [Poland, Romania, Hungary, Turkey, Rest of Eastern Europe] Western Europe] Germany, France, UK, Italy, Spain, Netherlands, Switzerland, Austria, Rest of Western Europe]), Asia Pacific (China, India, Japan, South Korea, Vietnam, Singapore, Australia, Rest of Asia Pacific), Middle East & Africa (Middle East [UAE, Egypt, Saudi Arabia, Qatar, Rest of Middle East], Africa [Nigeria, South Africa, Rest of Africa], Latin America (Brazil, Argentina, Colombia, Rest of Latin America) |
Company Profiles | BASF SE, Arkema S.A., Clariant AG, Cabot Corporation, Honeywell International Inc., W. R. Grace & Co., Axens, Zeochem, Merck KGaA, Molecular Products Group, Kuraray Co., Ltd., AGC Chemicals, Süd-Chemie, Calgon Carbon Corporation, Osaka Gas Chemicals Co., Ltd., Sorbead India, Jalon, Zhejiang Zhengguang Industrial Co., Ltd., Shandong Qilu Petrochemical Engineering Co., Ltd., Fujian Yuanli Active Carbon Co., Ltd. |
Ans: The Adsorbents Market was valued at USD 4.61 billion in 2023.
Ans: The expected CAGR of the global Adsorbents Market during the forecast period is 5.84%
Ans: The Petroleum refining segment will grow rapidly in the Adsorbents Market from 2024 to 2032.
Ans: The growing demand for eco-friendly products in various industries boosts the adsorbents market growth.
Ans: Asia Pacific led the Adsorbents Market in the region with the highest revenue share in 2023.
Table of Contents
1. Introduction
1.1 Market Definition
1.2 Scope (Inclusion and Exclusions)
1.3 Research Assumptions
2. Executive Summary
2.1 Market Overview
2.2 Regional Synopsis
2.3 Competitive Summary
3. Research Methodology
3.1 Top-Down Approach
3.2 Bottom-up Approach
3.3. Data Validation
3.4 Primary Interviews
4. Market Dynamics Impact Analysis
4.1 Market Driving Factors Analysis
4.1.2 Drivers
4.1.2 Restraints
4.1.3 Opportunities
4.1.4 Challenges
4.2 PESTLE Analysis
4.3 Porter’s Five Forces Model
5. Statistical Insights and Trends Reporting
5.1 Production Capacity and Utilization by Country, By Type, 2023
5.2 Feedstock Prices by Country, and Type, 2023
5.3 Regulatory Impact by Country and By Type 2023.
5.4 Environmental Metrics: Emissions Data, Waste Management Practices, and Sustainability Initiatives by Region
5.5 Innovation and R&D, Type, 2023
6. Competitive Landscape
6.1 List of Major Companies By Region
6.2 Market Share Analysis By Region
6.3 Product Benchmarking
6.3.1 Product specifications and features
6.3.2 Pricing
6.4 Strategic Initiatives
6.4.1 Marketing and promotional activities
6.4.2 Distribution and Supply Chain Strategies
6.4.3 Expansion Plans and New Product Launches
6.4.4 Strategic partnerships and collaborations
6.5 Technological Advancements
6.6 Market Positioning and Branding
7. Adsorbents Market Segmentation By Type
7.1 Chapter Overview
7.2 Molecular Sieves
7.2.1 Molecular Sieves Trend Analysis (2020-2032)
7.2.2 Molecular Sieves Market Size Estimates and Forecasts to 2032 (USD Billion)
7.3 Activated Carbon
7.3.1 Activated Carbon Market Trends Analysis (2020-2032)
7.3.2 Activated Carbon Market Size Estimates and Forecasts to 2032 (USD Billion)
7.4 Silica Gel
7.4.1 Silica Gel Trend Analysis (2020-2032)
7.4.2 Silica Gel Market Size Estimates and Forecasts to 2032 (USD Billion)
7.5 Activated Alumina
7.5.1 Activated Alumina Market Trends Analysis (2020-2032)
7.5.2 Activated Alumina Market Size Estimates and Forecasts to 2032 (USD Billion)
7.6 Others
7.6.1 Others Market Trends Analysis (2020-2032)
7.6.2 Others Market Size Estimates and Forecasts to 2032 (USD Billion)
8. Adsorbents Market Segmentation By Application
8.1 Chapter Overview
8.2 Petroleum Refining
8.2.1 Petroleum Refining Market Trends Analysis (2020-2032)
8.2.2 Petroleum Refining Market Size Estimates and Forecasts to 2032 (USD Billion)
8.3 Chemicals/Petrochemicals
8.3.1 Chemicals/Petrochemicals Market Trends Analysis (2020-2032)
8.3.2 Chemicals/Petrochemicals Market Size Estimates and Forecasts to 2032 (USD Billion)
8.4 Gas Refining
8.4.1 Gas Refining Market Trends Analysis (2020-2032)
8.4.2 Gas Refining Market Size Estimates and Forecasts to 2032 (USD Billion)
8.5 Water treatment
8.5.1 Water Treatment Market Trends Analysis (2020-2032)
8.5.2 Water Treatment Market Size Estimates and Forecasts to 2032 (USD Billion)
8.6 Air Separation & Drying
8.6.1 Air Separation & Drying Market Trends Analysis (2020-2032)
8.6.2 Air Separation & Drying Market Size Estimates and Forecasts to 2032 (USD Billion)
8.7 Packaging
8.7.1 Packaging Market Trends Analysis (2020-2032)
8.7.2 Packaging Market Size Estimates and Forecasts to 2032 (USD Billion)
8.8 Others
8.8.1 Others Market Trends Analysis (2020-2032)
8.8.2 Others Market Size Estimates and Forecasts to 2032 (USD Billion)
9. Regional Analysis
9.1 Chapter Overview
9.2 North America
9.2.1 Trends Analysis
9.2.2 North America Adsorbents Market Estimates and Forecasts, by Country (2020-2032) (USD Billion)
9.2.3 North America Adsorbents Market Estimates and Forecasts, By Type (2020-2032) (USD Billion)
9.2.4 North America Adsorbents Market Estimates and Forecasts, By Application (2020-2032) (USD Billion)
9.2.5 USA
9.2.5.1 USA Adsorbents Market Estimates and Forecasts, By Type (2020-2032) (USD Billion)
9.2.5.2 USA Adsorbents Market Estimates and Forecasts, By Application (2020-2032) (USD Billion)
9.2.6 Canada
9.2.6.1 Canada Adsorbents Market Estimates and Forecasts, By Type (2020-2032) (USD Billion)
9.2.6.2 Canada Adsorbents Market Estimates and Forecasts, By Application (2020-2032) (USD Billion)
9.2.7 Mexico
9.2.7.1 Mexico Adsorbents Market Estimates and Forecasts, By Type (2020-2032) (USD Billion)
9.2.7.2 Mexico Adsorbents Market Estimates and Forecasts, By Application (2020-2032) (USD Billion)
9.3 Europe
9.3.1 Eastern Europe
9.3.1.1 Trends Analysis
9.3.1.2 Eastern Europe Adsorbents Market Estimates and Forecasts, by Country (2020-2032) (USD Billion)
9.3.1.3 Eastern Europe Adsorbents Market Estimates and Forecasts, By Type (2020-2032) (USD Billion)
9.3.1.4 Eastern Europe Adsorbents Market Estimates and Forecasts, By Application (2020-2032) (USD Billion)
9.3.1.5 Poland
9.3.1.5.1 Poland Adsorbents Market Estimates and Forecasts, By Type (2020-2032) (USD Billion)
9.3.1.5.2 Poland Adsorbents Market Estimates and Forecasts, By Application (2020-2032) (USD Billion)
9.3.1.6 Romania
9.3.1.6.1 Romania Adsorbents Market Estimates and Forecasts, By Type (2020-2032) (USD Billion)
9.3.1.6.2 Romania Adsorbents Market Estimates and Forecasts, By Application (2020-2032) (USD Billion)
9.3.1.7 Hungary
9.3.1.7.1 Hungary Adsorbents Market Estimates and Forecasts, By Type (2020-2032) (USD Billion)
9.3.1.7.2 Hungary Adsorbents Market Estimates and Forecasts, By Application (2020-2032) (USD Billion)
9.3.1.8 Turkey
9.3.1.8.1 Turkey Adsorbents Market Estimates and Forecasts, By Type (2020-2032) (USD Billion)
9.3.1.8.2 Turkey Adsorbents Market Estimates and Forecasts, By Application (2020-2032) (USD Billion)
9.3.1.9 Rest of Eastern Europe
9.3.1.9.1 Rest of Eastern Europe Adsorbents Market Estimates and Forecasts, By Type (2020-2032) (USD Billion)
9.3.1.9.2 Rest of Eastern Europe Adsorbents Market Estimates and Forecasts, By Application (2020-2032) (USD Billion)
9.3.2 Western Europe
9.3.2.1 Trends Analysis
9.3.2.2 Western Europe Adsorbents Market Estimates and Forecasts, by Country (2020-2032) (USD Billion)
9.3.2.3 Western Europe Adsorbents Market Estimates and Forecasts, By Type (2020-2032) (USD Billion)
9.3.2.4 Western Europe Adsorbents Market Estimates and Forecasts, By Application (2020-2032) (USD Billion)
9.3.2.5 Germany
9.3.2.5.1 Germany Adsorbents Market Estimates and Forecasts, By Type (2020-2032) (USD Billion)
9.3.2.5.2 Germany Adsorbents Market Estimates and Forecasts, By Application (2020-2032) (USD Billion)
9.3.2.6 France
9.3.2.6.1 France Adsorbents Market Estimates and Forecasts, By Type (2020-2032) (USD Billion)
9.3.2.6.2 France Adsorbents Market Estimates and Forecasts, By Application (2020-2032) (USD Billion)
9.3.2.7 UK
9.3.2.7.1 UK Adsorbents Market Estimates and Forecasts, By Type (2020-2032) (USD Billion)
9.3.2.7.2 UK Adsorbents Market Estimates and Forecasts, By Application (2020-2032) (USD Billion)
9.3.2.8 Italy
9.3.2.8.1 Italy Adsorbents Market Estimates and Forecasts, By Type (2020-2032) (USD Billion)
9.3.2.8.2 Italy Adsorbents Market Estimates and Forecasts, By Application (2020-2032) (USD Billion)
9.3.2.9 Spain
9.3.2.9.1 Spain Adsorbents Market Estimates and Forecasts, By Type (2020-2032) (USD Billion)
9.3.2.9.2 Spain Adsorbents Market Estimates and Forecasts, By Application (2020-2032) (USD Billion)
9.3.2.10 Netherlands
9.3.2.10.1 Netherlands Adsorbents Market Estimates and Forecasts, By Type (2020-2032) (USD Billion)
9.3.2.10.2 Netherlands Adsorbents Market Estimates and Forecasts, By Application (2020-2032) (USD Billion)
9.3.2.11 Switzerland
9.3.2.11.1 Switzerland Adsorbents Market Estimates and Forecasts, By Type (2020-2032) (USD Billion)
9.3.2.11.2 Switzerland Adsorbents Market Estimates and Forecasts, By Application (2020-2032) (USD Billion)
9.3.2.12 Austria
9.3.2.12.1 Austria Adsorbents Market Estimates and Forecasts, By Type (2020-2032) (USD Billion)
9.3.2.12.2 Austria Adsorbents Market Estimates and Forecasts, By Application (2020-2032) (USD Billion)
9.3.2.13 Rest of Western Europe
9.3.2.13.1 Rest of Western Europe Adsorbents Market Estimates and Forecasts, By Type (2020-2032) (USD Billion)
9.3.2.13.2 Rest of Western Europe Adsorbents Market Estimates and Forecasts, By Application (2020-2032) (USD Billion)
9.4 Asia Pacific
9.4.1 Trends Analysis
9.4.2 Asia Pacific Adsorbents Market Estimates and Forecasts, by Country (2020-2032) (USD Billion)
9.4.3 Asia Pacific Adsorbents Market Estimates and Forecasts, By Type (2020-2032) (USD Billion)
9.4.4 Asia Pacific Adsorbents Market Estimates and Forecasts, By Application (2020-2032) (USD Billion)
9.4.5 China
9.4.5.1 China Adsorbents Market Estimates and Forecasts, By Type (2020-2032) (USD Billion)
9.4.5.2 China Adsorbents Market Estimates and Forecasts, By Application (2020-2032) (USD Billion)
9.4.6 India
9.4.5.1 India Adsorbents Market Estimates and Forecasts, By Type (2020-2032) (USD Billion)
9.4.5.2 India Adsorbents Market Estimates and Forecasts, By Application (2020-2032) (USD Billion)
9.4.5 Japan
9.4.5.1 Japan Adsorbents Market Estimates and Forecasts, By Type (2020-2032) (USD Billion)
9.4.5.2 Japan Adsorbents Market Estimates and Forecasts, By Application (2020-2032) (USD Billion)
9.4.6 South Korea
9.4.6.1 South Korea Adsorbents Market Estimates and Forecasts, By Type (2020-2032) (USD Billion)
9.4.6.2 South Korea Adsorbents Market Estimates and Forecasts, By Application (2020-2032) (USD Billion)
9.4.7 Vietnam
9.4.7.1 Vietnam Adsorbents Market Estimates and Forecasts, By Type (2020-2032) (USD Billion)
9.2.7.2 Vietnam Adsorbents Market Estimates and Forecasts, By Application (2020-2032) (USD Billion)
9.4.8 Singapore
9.4.8.1 Singapore Adsorbents Market Estimates and Forecasts, By Type (2020-2032) (USD Billion)
9.4.8.2 Singapore Adsorbents Market Estimates and Forecasts, By Application (2020-2032) (USD Billion)
9.4.9 Australia
9.4.9.1 Australia Adsorbents Market Estimates and Forecasts, By Type (2020-2032) (USD Billion)
9.4.9.2 Australia Adsorbents Market Estimates and Forecasts, By Application (2020-2032) (USD Billion)
9.4.10 Rest of Asia Pacific
9.4.10.1 Rest of Asia Pacific Adsorbents Market Estimates and Forecasts, By Type (2020-2032) (USD Billion)
9.4.10.2 Rest of Asia Pacific Adsorbents Market Estimates and Forecasts, By Application (2020-2032) (USD Billion)
9.5 Middle East and Africa
9.5.1 Middle East
9.5.1.1 Trends Analysis
9.5.1.2 Middle East Adsorbents Market Estimates and Forecasts, by Country (2020-2032) (USD Billion)
9.5.1.3 Middle East Adsorbents Market Estimates and Forecasts, By Type (2020-2032) (USD Billion)
9.5.1.4 Middle East Adsorbents Market Estimates and Forecasts, By Application (2020-2032) (USD Billion)
9.5.1.5 UAE
9.5.1.5.1 UAE Adsorbents Market Estimates and Forecasts, By Type (2020-2032) (USD Billion)
9.5.1.5.2 UAE Adsorbents Market Estimates and Forecasts, By Application (2020-2032) (USD Billion)
9.5.1.6 Egypt
9.5.1.6.1 Egypt Adsorbents Market Estimates and Forecasts, By Type (2020-2032) (USD Billion)
9.5.1.6.2 Egypt Adsorbents Market Estimates and Forecasts, By Application (2020-2032) (USD Billion)
9.5.1.7 Saudi Arabia
9.5.1.7.1 Saudi Arabia Adsorbents Market Estimates and Forecasts, By Type (2020-2032) (USD Billion)
9.5.1.7.2 Saudi Arabia Adsorbents Market Estimates and Forecasts, By Application (2020-2032) (USD Billion)
9.5.1.8 Qatar
9.5.1.8.1 Qatar Adsorbents Market Estimates and Forecasts, By Type (2020-2032) (USD Billion)
9.5.1.8.2 Qatar Adsorbents Market Estimates and Forecasts, By Application (2020-2032) (USD Billion)
9.5.1.9 Rest of Middle East
9.5.1.9.1 Rest of Middle East Adsorbents Market Estimates and Forecasts, By Type (2020-2032) (USD Billion)
9.5.1.9.2 Rest of Middle East Adsorbents Market Estimates and Forecasts, By Application (2020-2032) (USD Billion)
9.5.2 Africa
9.5.2.1 Trends Analysis
9.5.2.2 Africa Adsorbents Market Estimates and Forecasts, by Country (2020-2032) (USD Billion)
9.5.2.3 Africa Adsorbents Market Estimates and Forecasts, By Type (2020-2032) (USD Billion)
9.5.2.4 Africa Adsorbents Market Estimates and Forecasts, By Application (2020-2032) (USD Billion)
9.5.2.5 South Africa
9.5.2.5.1 South Africa Adsorbents Market Estimates and Forecasts, By Type (2020-2032) (USD Billion)
9.5.2.5.2 South Africa Adsorbents Market Estimates and Forecasts, By Application (2020-2032) (USD Billion)
9.5.2.6 Nigeria
9.5.2.6.1 Nigeria Adsorbents Market Estimates and Forecasts, By Type (2020-2032) (USD Billion)
9.5.2.6.2 Nigeria Adsorbents Market Estimates and Forecasts, By Application (2020-2032) (USD Billion)
9.6 Latin America
9.6.1 Trends Analysis
9.6.2 Latin America Adsorbents Market Estimates and Forecasts, by Country (2020-2032) (USD Billion)
9.6.3 Latin America Adsorbents Market Estimates and Forecasts, By Type (2020-2032) (USD Billion)
9.6.4 Latin America Adsorbents Market Estimates and Forecasts, By Application (2020-2032) (USD Billion)
9.6.5 Brazil
9.6.5.1 Brazil Adsorbents Market Estimates and Forecasts, By Type (2020-2032) (USD Billion)
9.6.5.2 Brazil Adsorbents Market Estimates and Forecasts, By Application (2020-2032) (USD Billion)
9.6.6 Argentina
9.6.6.1 Argentina Adsorbents Market Estimates and Forecasts, By Type (2020-2032) (USD Billion)
9.6.6.2 Argentina Adsorbents Market Estimates and Forecasts, By Application (2020-2032) (USD Billion)
9.6.7 Colombia
9.6.7.1 Colombia Adsorbents Market Estimates and Forecasts, By Type (2020-2032) (USD Billion)
9.6.7.2 Colombia Adsorbents Market Estimates and Forecasts, By Application (2020-2032) (USD Billion)
9.6.8 Rest of Latin America
9.6.8.1 Rest of Latin America Adsorbents Market Estimates and Forecasts, By Type (2020-2032) (USD Billion)
9.6.8.2 Rest of Latin America Adsorbents Market Estimates and Forecasts, By Application (2020-2032) (USD Billion)
10. Company Profiles
10.1 BASF SE
10.1.1 Company Overview
10.1.2 Financial
10.1.3 Product / Services Offered
10.1.4 SWOT Analysis
10.2 Arkema S.A.
10.2.1 Company Overview
10.2.2 Financial
10.2.3 Product/ Services Offered
10.2.4 SWOT Analysis
10.3 Clariant AG
10.3.1 Company Overview
10.3.2 Financial
10.3.3 Product/ Services Offered
10.3.4 SWOT Analysis
10.4 Cabot Corporation
10.4.1 Company Overview
10.4.2 Financial
10.4.3 Product/ Services Offered
10.4.4 SWOT Analysis
10.5 Honeywell International Inc.
10.5.1 Company Overview
10.5.2 Financial
10.5.3 Product/ Services Offered
10.5.4 SWOT Analysis
10.6 W. R. Grace & Co.
10.6.1 Company Overview
10.6.2 Financial
10.6.3 Product/ Services Offered
10.6.4 SWOT Analysis
10.7 Axens
10.7.1 Company Overview
10.7.2 Financial
10.7.3 Product/ Services Offered
10.7.4 SWOT Analysis
10.8 Zeochem
10.8.1 Company Overview
10.8.2 Financial
10.8.3 Product/ Services Offered
10.8.4 SWOT Analysis
10.9 Merck KGaA
10.9.1 Company Overview
10.9.2 Financial
10.9.3 Product/ Services Offered
10.9.4 SWOT Analysis
10.10 Molecular Products Group
10.10.1 Company Overview
10.10.2 Financial
10.10.3 Product/ Services Offered
10.10.4 SWOT Analysis
11. Use Cases and Best Practices
12. Conclusion
An accurate research report requires proper strategizing as well as implementation. There are multiple factors involved in the completion of good and accurate research report and selecting the best methodology to compete the research is the toughest part. Since the research reports we provide play a crucial role in any company’s decision-making process, therefore we at SNS Insider always believe that we should choose the best method which gives us results closer to reality. This allows us to reach at a stage wherein we can provide our clients best and accurate investment to output ratio.
Each report that we prepare takes a timeframe of 350-400 business hours for production. Starting from the selection of titles through a couple of in-depth brain storming session to the final QC process before uploading our titles on our website we dedicate around 350 working hours. The titles are selected based on their current market cap and the foreseen CAGR and growth.
The 5 steps process:
Step 1: Secondary Research:
Secondary Research or Desk Research is as the name suggests is a research process wherein, we collect data through the readily available information. In this process we use various paid and unpaid databases which our team has access to and gather data through the same. This includes examining of listed companies’ annual reports, Journals, SEC filling etc. Apart from this our team has access to various associations across the globe across different industries. Lastly, we have exchange relationships with various university as well as individual libraries.
Step 2: Primary Research
When we talk about primary research, it is a type of study in which the researchers collect relevant data samples directly, rather than relying on previously collected data. This type of research is focused on gaining content specific facts that can be sued to solve specific problems. Since the collected data is fresh and first hand therefore it makes the study more accurate and genuine.
We at SNS Insider have divided Primary Research into 2 parts.
Part 1 wherein we interview the KOLs of major players as well as the upcoming ones across various geographic regions. This allows us to have their view over the market scenario and acts as an important tool to come closer to the accurate market numbers. As many as 45 paid and unpaid primary interviews are taken from both the demand and supply side of the industry to make sure we land at an accurate judgement and analysis of the market.
This step involves the triangulation of data wherein our team analyses the interview transcripts, online survey responses and observation of on filed participants. The below mentioned chart should give a better understanding of the part 1 of the primary interview.
Part 2: In this part of primary research the data collected via secondary research and the part 1 of the primary research is validated with the interviews from individual consultants and subject matter experts.
Consultants are those set of people who have at least 12 years of experience and expertise within the industry whereas Subject Matter Experts are those with at least 15 years of experience behind their back within the same space. The data with the help of two main processes i.e., FGDs (Focused Group Discussions) and IDs (Individual Discussions). This gives us a 3rd party nonbiased primary view of the market scenario making it a more dependable one while collation of the data pointers.
Step 3: Data Bank Validation
Once all the information is collected via primary and secondary sources, we run that information for data validation. At our intelligence centre our research heads track a lot of information related to the market which includes the quarterly reports, the daily stock prices, and other relevant information. Our data bank server gets updated every fortnight and that is how the information which we collected using our primary and secondary information is revalidated in real time.
Step 4: QA/QC Process
After all the data collection and validation our team does a final level of quality check and quality assurance to get rid of any unwanted or undesired mistakes. This might include but not limited to getting rid of the any typos, duplication of numbers or missing of any important information. The people involved in this process include technical content writers, research heads and graphics people. Once this process is completed the title gets uploader on our platform for our clients to read it.
Step 5: Final QC/QA Process:
This is the last process and comes when the client has ordered the study. In this process a final QA/QC is done before the study is emailed to the client. Since we believe in giving our clients a good experience of our research studies, therefore, to make sure that we do not lack at our end in any way humanly possible we do a final round of quality check and then dispatch the study to the client.
Key Segments
By Type
Molecular Sieves
Activated Carbon
Silica Gel
Activated Alumina
Others
By Application
Petroleum refining
Chemicals/Petrochemicals
Gas refining
Water treatment
Air Separation & Drying
Packaging
Others
Request for Segment Customization as per your Business Requirement: Segment Customization Request
Regional Coverage:
North America
US
Canada
Mexico
Europe
Eastern Europe
Poland
Romania
Hungary
Turkey
Rest of Eastern Europe
Western Europe
Germany
France
UK
Italy
Spain
Netherlands
Switzerland
Austria
Rest of Western Europe
Asia Pacific
China
India
Japan
South Korea
Vietnam
Singapore
Australia
Rest of Asia Pacific
Middle East & Africa
Middle East
UAE
Egypt
Saudi Arabia
Qatar
Rest of Middle East
Africa
Nigeria
South Africa
Rest of Africa
Latin America
Brazil
Argentina
Colombia
Rest of Latin America
Request for Country Level Research Report: Country Level Customization Request
Available Customization
With the given market data, SNS Insider offers customization as per the company’s specific needs. The following customization options are available for the report:
Detailed Volume Analysis
Criss-Cross segment analysis (e.g. Product X Application)
Competitive Product Benchmarking
Geographic Analysis
Additional countries in any of the regions
Customized Data Representation
Detailed analysis and profiling of additional market players
Carrageenan Market size was USD 912.4 Million in 2023 and is expected to reach USD 1477.6 Million by 2032, growing at a CAGR of 5.5% from 2024 to 2032.
The Aromatherapy Market Size was valued at USD 7.19 Billion in 2023 and is expected to reach USD 14.55 Bn by 2032, growing at a CAGR of 18.18% over the forecast period of 2024-2032.
The Eco-Friendly Plasticizers Market size was USD 4.29 billion in 2023 and is expected to reach USD 8.32 billion by 2032 and grow at a CAGR of 7.65% over the forecast period of 2024-2032.
The High-Performance Fibers Market Size was valued at USD 13.42 Billion in 2023 and is expected to reach USD 26.53 Billion by 2032 and grow at a CAGR of 7.90% over the forecast period 2024-2032.
The Guaiacol Market size was valued at USD 321.05 million in 2023 and is expected to reach USD 367.08 million by 2032 and grow at a CAGR of 1.50% over the forecast period of 2024-2032.
Catalyst Regeneration Market Size was USD 5.77 Billion in 2023 and is expected to reach USD 9.07 Billion by 2032, growing at a CAGR of 5.16 % from 2024-2032.
Hi! Click one of our member below to chat on Phone