Active Network Management Market Report Scope & Overview:
The Active Network Management Market is valued at USD 1.66 Billion in 2025E and is expected to reach USD 5.30 Billion by 2033, growing at a CAGR of 15.64% over 2026-2033.
The Active Network Management Market is growing rapidly as more renewable energy is being added to the grid, grid modernization projects are being started, and there is a growing need for real-time grid optimization solutions. Utilities and grid managers are using ANM systems to handle distributed energy resources (DERs), keep the grid from getting too full, and keep the voltage steady. The move toward smart grids and regulatory support for grid flexibility solutions speed up the adoption of these technologies around the world. Advanced ANM platforms help with the problems of decentralized power systems and electrifying transportation networks by allowing dynamic load balancing, predictive grid analytics, and automated control of renewable energy assets.
76% of utility operators deployed Active Network Management solutions increasing renewable hosting capacity by 42% and reducing grid congestion events by 58% while optimizing distributed energy resource integration across North America and Europe.
Active Network Management Market Size and Forecast
-
Market Size in 2025E: USD 1.66 Billion
-
Market Size by 2033: USD 5.30 Billion
-
CAGR: 15.64% from 2026 to 2033
-
Base Year: 2025E
-
Forecast Period: 2026–2033
-
Historical Data: 2022–2024

To Get more information on Active Network Management Market - Request Free Sample Report
Active Network Management Market Trends:
-
Increasing deployment of AI and machine learning algorithms for predictive grid analytics and automated network optimization in real-time.
-
Growing integration of distributed energy resources (DERs) management with ANM platforms for coordinated grid control and renewable energy hosting.
-
Rising adoption of cloud-based ANM solutions enabling scalable grid management and remote monitoring capabilities for utilities.
-
Expansion of dynamic voltage optimization and reactive power control solutions to enhance grid stability and power quality.
-
Increasing implementation of congestion management and capacity forecasting tools to prevent grid overloads and optimize asset utilization.
U.S. Active Network Management Market is valued at USD 0.58 billion in 2025E and is expected to reach USD 1.84 billion by 2033, growing at a CAGR of 15.52% over 2026-2033.
Investments in modernizing the grid, renewable portfolio standards, and more DER penetration are driving the growth of the U.S. Active Network Management Market. Regulatory efforts to make the grid more flexible, along with utility investments in advanced distribution management systems (ADMS), are driving the use of ANM solutions for voltage control, congestion management, and the smooth integration of solar and wind generation assets across transmission and distribution networks.

Active Network Management Market Growth Drivers:
-
Rapid Integration of Renewable Energy Sources and Distributed Generation is Propelling Market Expansion Globally
The shift toward renewable energy around the world has made it much harder to integrate solar and wind power into the grid because they produce power at different times. Utilities can use ANM systems to monitor, predict, and control power flows in real time. This helps them keep voltage levels stable and avoid network congestion. By dynamically managing generation, storage, and demand response resources, these systems let more renewable energy into the grid without having to pay for expensive upgrades. The goal of decarbonization and renewable energy in more than 150 nations is moving forward quickly. This is leading to big investments in ANM technologies, which are important instruments for modernizing the grid.
79% of transmission system operators implemented ANM platforms to increase renewable hosting capacity by 35-45% while reducing grid reinforcement costs by an average of 28% across European and North American markets.
Active Network Management Market Restraints:
-
High Implementation Costs and Complex Integration with Legacy Grid Infrastructure Limit Adoption, Particularly Among Smaller Utilities and Developing Regions
To fully use ANM systems, utilities need to spend a lot of money on hardware, software, and system integration. For medium-sized utilities, the average cost of installation is between USD 5 million and USD 20 million. It is hard and expensive to connect ANM platforms to older systems, such as energy management systems (EMS), distribution management systems (DMS), and other field equipment. Many utilities, especially in developing areas and smaller municipal systems, have budget problems and lack the technical skills needed to adopt ANM right away, even though it would clearly improve operations and save money in the long run.
68% of medium-sized utilities cited high upfront costs and integration complexity as primary adoption barriers, with 42% delaying ANM projects despite recognizing operational benefits and regulatory pressures.
Active Network Management Market Opportunities:
-
Expanding Electric Vehicle Charging Infrastructure and Electrification of Transportation Creates New Opportunities for Dynamic Load Management and Grid-responsive Charging Solutions
The fast rise in the number of electric vehicles on the road, with the worldwide EV fleet expected to reach more than 200 million by 2030, makes grid management harder than ever. ANM solutions have advanced load management features that can automatically change how EVs charge based on grid circumstances, the availability of renewable energy, and the price of power. Utilities may stop local transformer overloads, handle peak demand, and use EVs as distributed storage resources when smart charging is connected to ANM platforms. By 2030, this combination of electrifying mobility and managing the grid would provide a market opportunity worth USD 12.5 billion for ANM solutions.
In 2025, 55% of new ANM deployments included EV smart charging management modules, reducing grid upgrade requirements by 37% in high-EV penetration areas while enabling vehicle-to-grid (V2G) services.
Active Network Management Market Segment Highlights:
-
By Type: Solution led with 63.4% share, while Service is the fastest-growing segment with CAGR of 18.2%.
-
By Enterprise Size: Large Enterprises led with 71.8% share, while Small & Medium Enterprises (SMEs) is the fastest-growing segment with CAGR of 19.7%.
-
By Application: Energy & Utilities led with 67.3% share, while Transportation is the fastest-growing segment with CAGR of 22.4%.
Active Network Management Market Segment Analysis
By Type: Solution Segment Led the Market, while Service is the Fastest-growing Segment
Solutions dominate the Active Network Management (ANM) market, consisting of software platforms, hardware controllers, and integrated systems that deliver real-time grid monitoring, control, and optimization, including advanced applications for voltage control, congestion management, renewable integration, and demand response, driven by the critical need for reliable grid operations and regulatory stability, with vendors offering modular, scalable platforms and a growing shift toward cost-effective, analytics-rich cloud-based solutions.
Services represent the fastest-growing segment, fueled by demand for specialized system integration, consulting, managed services, and support due to the complexity of ANM implementations, leading utilities to increasingly outsource to providers offering 24/7 monitoring, performance optimization, and compliance management, with ANM-as-a-service models accelerating growth, particularly for smaller utilities and emerging markets, and managed services projected to capture 38% of the services market by 2028.

By Enterprise Size: Large Enterprises Segment Dominated the Market, while Small & Medium Enterprises (SMEs) is the Fastest-growing Segment Globally
Large Enterprises, primarily major utility companies and transmission system operators, dominate ANM adoption due to their extensive grid assets, regulatory obligations, and substantial capital, implementing enterprise-wide platforms integrated with SCADA and DMS systems to manage complex networks with high renewable penetration and achieving significant ROI through deferred grid upgrades and improved reliability with 3-5 year payback periods.
Small & Medium Enterprises (SMEs), including municipal utilities and renewable developers, represent the fastest-growing segment, driven by regulatory changes, falling technology costs, and modular, cloud-based ANM offerings that eliminate upfront hardware investment and provide access to advanced capabilities, with their specific challenges around distributed energy resource interconnection fueling demand for targeted solutions and propelling this segment's growth at a 19.7% CAGR.
By Application: Energy & Utilities Segment Led the Market, while Transportation is the Fastest-growing Segment Globally
The Energy & Utilities sector maintains market leadership with a 67.3% share, as ANM solutions are fundamentally designed for electric grid management by investor-owned and municipal utilities, focusing on voltage optimization, feeder automation, renewable integration, and outage management, driven by smart grid transitions, regulatory mandates, and distributed energy resources, with implementations characterized by high value, rigorous reliability, and deep IT/OT integration.
Transportation represents the fastest-growing application segment with a 22.4% CAGR, fueled by the electrification of rail, EV charging infrastructure, and smart transportation systems, which require specialized ANM capabilities for managing high-power loads, grid-responsive charging, and the unique convergence of energy and transport infrastructure for predictive corridor forecasting, dynamic pricing, and vehicle-to-grid coordination, a segment projected to triple in size by 2033.
Active Network Management Market Regional Analysis:
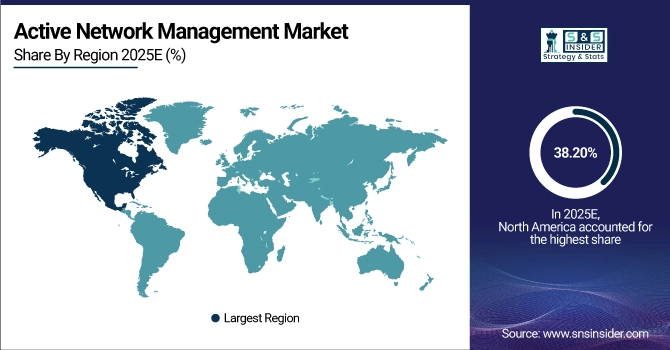
North America Active Network Management Market Insights:
In 2025, North America had the most share of the Active Network Management Market, with 38.20% due to large investments in modernizing the grid, a lot of renewable energy use, and regulations that helped. The area has modern utility infrastructure, a lot of smart grid installations, and a lot of top ANM technology companies. North America will be at the top of the market through 2033 thanks to ongoing investments in grid resilience, integrating distributed energy resources, and building infrastructure for electric vehicles.
Get Customized Report as per Your Business Requirement - Enquiry Now
Asia Pacific Active Network Management Market Insights:
From 2026 to 2033, Asia Pacific is predicted to expand the fastest, with a CAGR of 18.90% due to the rapid growth of renewable energy, efforts to modernize the system, and more money being put into smart grid infrastructure. China, India, Japan, and Australia are the leaders in regional adoption. This is because of government goals for integrating renewable energy, programs to electrify cities, and making the grid more reliable. The region's rising energy needs and ambitious targets for reducing carbon emissions present a lot of chances for ANM solutions that help keep the grid stable and make better use of renewable energy.
Europe Active Network Management Market Insights:
In 2025, Europe held 34.80% market share owing to the robust regulatory frameworks for grid flexibility, aggressive renewable energy goals, and modern distribution network infrastructure. The Clean Energy Package from the European Union and national grid rules require ANM capabilities for connecting distributed energy. Mature energy markets, high DER penetration rates, and cross-border grid coordination projects are all pushing for new ANM technology to be used more and more in transmission and distribution networks across the region.
Middle East & Africa and Latin America Active Network Management Market Insights:
In 2025, the Middle East & Africa and Latin America together held 12.50% of the market share due to grid expansion projects, more investments in renewable energy, and the upgrade of urban infrastructure. The regions are using ANM technologies to make the grid more stable, add utility-scale renewable projects, and make sure that electricity is always available when needed. Government programs, international development financing, and technology agreements with global vendors help the ANM industry grow in these regions' new electrical markets.
Active Network Management Market Competitive Landscape:
General Electric Company
Founded in 1892, General Electric is a global digital industrial company providing grid solutions through its GE Vernova portfolio. The company offers comprehensive Active Network Management solutions including grid optimization software, renewable integration systems, and advanced distribution management platforms. GE's ANM technologies leverage Predix analytics and industrial IoT capabilities for real-time grid control, voltage management, and distributed energy resource coordination across utility networks worldwide.
-
January 2025, GE Vernova launched its next-generation GridOS Active Network Management platform featuring AI-driven congestion forecasting and autonomous grid control capabilities for high-renewable penetration networks.
Siemens AG
Established in 1847, Siemens AG is a German technology conglomerate providing energy automation and smart grid solutions through its Siemens Smart Infrastructure division. The company offers SINANET active network management systems for voltage control, grid congestion management, and renewable integration. Siemens combines grid control technology with digital twin simulations and cloud-based analytics for optimized distribution network operations and enhanced grid resilience across global markets.
-
March 2025, Siemens introduced its Spectrum Power Active Network Management suite with enhanced distributed energy resource management capabilities and cyber-secure cloud connectivity for utility-scale deployments.
Schneider Electric SE
Founded in 1836, Schneider Electric is a French multinational specializing in energy management and automation solutions. The company provides EcoStruxure Grid Active Network Management solutions featuring advanced distribution management, microgrid control, and DERMS platforms. Schneider's ANM offerings integrate grid edge intelligence with centralized optimization for voltage regulation, peak shaving, and renewable energy integration across commercial, industrial, and utility applications globally.
-
November 2024, Schneider Electric enhanced its EcoStruxure DERMS platform with machine learning algorithms for predictive congestion management and automated voltage control in distribution networks with high photovoltaic penetration.
Active Network Management Market Key Players:
-
General Electric Company
-
Schneider Electric SE
-
ABB Ltd
-
Hitachi Energy Ltd
-
Itron Inc.
-
Landis+Gyr AG
-
Open Grid Systems Ltd
-
Smarter Grid Solutions Ltd
-
Enel X Global Retail
-
AutoGrid Systems Inc.
-
Uplight Inc.
-
mPrest Inc.
-
Trilliant Holdings Inc.
| Report Attributes | Details |
|---|---|
| Market Size in 2025E | USD 1.66 Billion |
| Market Size by 2033 | USD 5.30 Billion |
| CAGR | CAGR of 15.64% From 2026 to 2033 |
| Base Year | 2025 |
| Forecast Period | 2026-2033 |
| Historical Data | 2022-2024 |
| Report Scope & Coverage | Market Size, Segments Analysis, Competitive Landscape, Regional Analysis, DROC & SWOT Analysis, Forecast Outlook |
| Key Segments | • By Type (Solution, Service) • By Enterprise Size (Small & Medium Enterprises, Large Enterprises) • By Application (Transportation, Energy & Utilities, Others) |
| Regional Analysis/Coverage | North America (US, Canada, Mexico), Europe (Eastern Europe [Poland, Romania, Hungary, Turkey, Rest of Eastern Europe] Western Europe] Germany, France, UK, Italy, Spain, Netherlands, Switzerland, Austria, Rest of Western Europe]), Asia Pacific (China, India, Japan, South Korea, Vietnam, Singapore, Australia, Rest of Asia Pacific), Middle East & Africa (Middle East [UAE, Egypt, Saudi Arabia, Qatar, Rest of Middle East], Africa [Nigeria, South Africa, Rest of Africa], Latin America (Brazil, Argentina, Colombia, Rest of Latin America) |
| Company Profiles | General Electric Company, Siemens AG, Schneider Electric SE, ABB Ltd, Hitachi Energy Ltd, Oracle Corporation, Itron Inc., Landis+Gyr AG, Open Grid Systems Ltd, Smarter Grid Solutions Ltd, Enel X Global Retail, AutoGrid Systems Inc., Uplight Inc., mPrest Inc., Trilliant Holdings Inc. |
