Active Ingredients Market Report Scope & Overview:
Get More Information on Active Ingredients Market - Request Sample Report
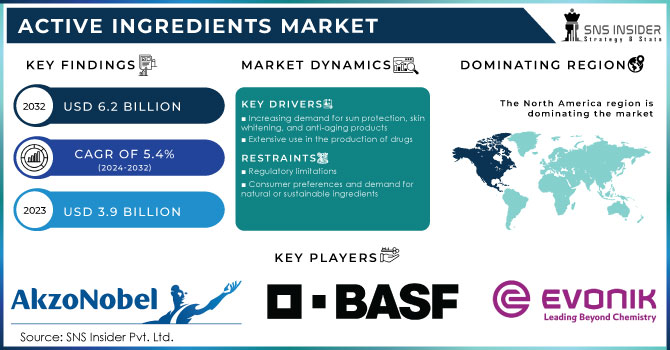
The Active Ingredients Market Size was valued at USD 3.9 billion in 2023 and is expected to reach USD 6.2 billion by 2032 and grow at a CAGR of 5.4% over the forecast period 2024-2032.
The active ingredients market is witnessing growth due to the advancements in pharmaceutical, cosmetic, and agricultural sectors. Companies are constantly innovating to meet the changing demands of consumers. The major drivers are the increasing preference for natural and sustainable ingredients, technological advancements, and increasing applications in end-use industries. Recent developments demonstrate this dynamism. For example, in November 2024, Dhanuka Agritech partnered with Bayer AG to acquire new crop protection active ingredients, which will help improve agricultural productivity. In the same way, the FDA proposed removing oral phenylephrine from the OTC monograph in November 2024, a move that may change the pharmaceutical industry by promoting alternatives in nasal decongestants. In addition, India's dependence on key pharmaceutical active ingredients is expected to decrease substantially due to local production initiatives and policies for enhancing domestic capabilities, as highlighted in November 2024.
Companies are emphasizing innovation and expansion of infrastructure for market position strengthening. Evonik has been particularly active in this regard. In March 2024, the company established the Evonik Skin Institute to strengthen research in active ingredients for cosmetics. Evonik has since furthered the expansion of its portfolio through fortification of actives business in early September 2024. Through such an enhancement, the group expresses its resolve towards pioneering beauty sector solutions. In December 2024, Adama took the landmark stride by its newly innovative active, Gilboa crop resilience activators. The two clearly emphasize the new developments on innovations in sustainability across the industry. Together, all these developments demonstrate the dynamic character of the Active Ingredients Market and how companies make use of new technological and regulatory developments to ensure competitive advantage.
Active Ingredients Market Dynamics:
Drivers:
-
Rising Consumer Preference for Natural and Organic Active Ingredients Fuels Demand in the Pharmaceuticals and Cosmetics Sectors
The growing consumer preference for natural and organic products has become a significant driver of the Active Ingredients Market, particularly in the pharmaceuticals and cosmetics sectors. In recent years, there has been an increasing awareness about the potential harmful effects of synthetic chemicals, driving consumers to seek products that use natural, plant-based, and organic ingredients. In cosmetics, this trend has led to the rise of clean beauty products, which often emphasize the use of active ingredients derived from nature. Similarly, in the pharmaceutical industry, consumers are seeking remedies that come from natural sources, such as herbs, botanicals, and minerals, instead of synthetic chemicals. The demand for safe, non-toxic, and environmentally friendly alternatives is prompting companies to innovate and invest in natural active ingredients that cater to the growing eco-conscious consumer base. As a result, companies are sourcing ingredients from sustainable sources and emphasizing transparency in labeling to appeal to this consumer demand. This shift toward natural and organic ingredients not only supports the growth of the Active Ingredients Market but also leads to the development of new formulations that prioritize safety and sustainability, which are crucial for meeting regulatory requirements and consumer expectations.
-
Increasing Health and Wellness Trends Drive Growth in Active Ingredients for Dietary Supplements and Functional Foods
-
Government Regulations and Standards Encourage the Adoption of Safe and Effective Active Ingredients in Consumer Products
Government regulations and standards are crucial drivers of the Active Ingredients Market, as they ensure the safety and efficacy of ingredients used in consumer products, particularly in the pharmaceutical, cosmetic, and food sectors. Regulatory bodies such as the FDA (U.S. Food and Drug Administration), EMA (European Medicines Agency), and other regional authorities impose strict guidelines on the formulation and testing of active ingredients, which promotes transparency and consumer confidence. These regulations require companies to thoroughly test and prove the safety and effectiveness of active ingredients before they are used in products available on the market. As regulatory frameworks evolve, there is a growing emphasis on the use of sustainable, eco-friendly, and non-toxic ingredients, which aligns with shifting consumer expectations for safer products. Additionally, compliance with these regulations ensures that companies maintain a competitive edge by meeting consumer demands for high-quality, trustworthy products. The increasing complexity of regulations around active ingredients also drives innovation in ingredient sourcing, formulation techniques, and production processes, encouraging companies to adopt cutting-edge technologies that adhere to safety standards. This regulatory push not only fosters consumer trust but also supports the development of safer, more effective active ingredients, thereby fueling market growth and enhancing brand reputation.
Restraint:
-
High Production Costs and Complex Manufacturing Processes of Active Ingredients Limit Market Growth and Profitability
The high production cost and complicated production process, mainly for active ingredients from natural origins, is the biggest challenge facing the Active Ingredients Market. Operations such as solvent extraction and fermentation are costly due to the methods used to obtain high-quality active ingredients from rare or organic plants. Moreover, the energy-intensive chemical process required to manufacture synthetic ingredients elevates the costs of production. In addition, maintaining consistency during production is complicated because raw material variability exists. The costs can be so expensive that small-scale companies find it hard to match them, particularly since they have fewer resources available for high tech facilities and equipment. Manufacturers must increase production efficiency with reduced waste while still ensuring ingredient quality remains the best if they are going to remain in this increasingly fast-paced market.
Opportunity:
-
Increasing Popularity of Personalized Healthcare and Cosmetics Opens New Avenues for Active Ingredients Innovation
-
Global Expansion of Health and Beauty Markets Offers Entry Points for Active Ingredients Manufacturers
The global expansion of health and beauty markets presents significant opportunities for active ingredient manufacturers, particularly in emerging economies. As disposable incomes rise and consumers in developing regions gain access to new products, there is an increasing demand for high-quality health and beauty items. The rise in consumer awareness regarding personal care and wellness is fueling the demand for products that contain effective active ingredients, including skincare, haircare, and health supplements. Regions such as Asia-Pacific, Latin America, and the Middle East are witnessing significant growth in the beauty and health sectors, driven by a growing middle class and changing lifestyles. Manufacturers have the opportunity to tap into these markets by offering products that cater to local preferences, cultural nuances, and unique consumer needs. Furthermore, expanding digital platforms in these regions allow for greater product visibility and access, offering companies new entry points to reach untapped markets. This expansion presents a substantial opportunity for active ingredient manufacturers to grow their market share and establish a stronger presence in global markets.
Consumer Safety & Sustainability in the Active Ingredients Market
| Aspect | Description | Example |
|---|---|---|
| Sustainability Certifications | Active ingredients are increasingly subject to sustainability certifications, ensuring ethical sourcing. | Fair Trade, Organic, Ecocert certifications for plant-based extracts in cosmetics and pharma. |
| Safety Testing Protocols | Stringent safety tests ensure the efficacy and safety of ingredients in products, particularly for skin care. | Dermatological testing, clinical trials for anti-aging ingredients and moisturizers. |
| Eco-friendly Manufacturing | Manufacturers are shifting to environmentally responsible production methods, reducing waste and emissions. | Green chemistry in plant-based ingredient production; zero-waste facilities in Europe. |
| Non-toxic Ingredients | Growing demand for non-toxic, safe ingredients that do not harm the consumer or the environment. | Use of natural preservatives and colorants that are free from harmful chemicals. |
| Animal Welfare | Ethical sourcing and cruelty-free ingredients ensure no animal testing in product development. | Vegan-certified ingredients used in cosmetics and skincare products. |
In the Active Ingredients Market, consumer safety and sustainability are paramount concerns driving product development and industry growth. Companies are increasingly prioritizing certifications such as Fair Trade and Organic to assure customers of ethically sourced, environmentally friendly ingredients. Additionally, rigorous safety testing, including dermatological assessments and clinical trials, ensures the efficacy and safety of ingredients, particularly in the cosmetics and pharmaceutical sectors. Sustainable manufacturing processes, such as the adoption of green chemistry and eco-friendly production methods, are reducing the environmental impact. Furthermore, the demand for non-toxic, cruelty-free ingredients is reshaping the market, aligning with rising consumer awareness of both health and ethical considerations.
Active Ingredients Market Segments
By Source
In 2023, the plant-based source segment dominated the Active Ingredients Market with a market share of 45%. Plant-based active ingredients are increasingly popular due to their natural origins, making them a preferred choice across various industries, including cosmetics, pharmaceuticals, and food & beverages. The rising demand for sustainable and eco-friendly products has led consumers to seek ingredients that are derived from plants rather than synthetic sources. For example, plant oils, extracts, and essential oils are commonly used in skincare and haircare products, offering moisturizing, anti-aging, and antioxidant properties. Companies such as BASF and Croda International Plc have invested heavily in developing plant-based active ingredients to meet this growing demand. These ingredients are not only safer but also align with the rising consumer awareness about the environmental impact of synthetic chemicals. Additionally, the use of plant-based ingredients is perceived as more ethical, as it supports biodiversity and avoids animal testing, further driving their adoption in the market.
By Type
The natural segment dominated the Active Ingredients Market in 2023, capturing a 60% of the market share. Natural ingredients have gained significant traction across multiple industries due to their perceived safety, effectiveness, and sustainability. As consumers become more health-conscious, the demand for products free from harmful chemicals has grown substantially. In sectors such as cosmetics, pharmaceuticals, and food, natural ingredients are increasingly preferred because they are considered less likely to cause skin irritation or side effects. Companies like Evonik and Ashland are at the forefront of developing and offering natural active ingredients, which are derived from plants, minerals, and other organic sources. These ingredients are used for a variety of benefits, including hydration, anti-aging, and soothing properties. Moreover, natural products are often marketed as clean label items, appealing to consumers who are more discerning about the ingredients in their personal care and health products. The shift towards natural ingredients is also in response to increasing regulations and consumer demand for transparency in product formulations.
By Form
The solid form segment dominated the Active Ingredients Market in 2023, with a revenue share of 50%. Solid active ingredients are widely utilized in pharmaceuticals, cosmetics, and food products due to their stability, ease of transport, and longer shelf life compared to liquids and gases. In the pharmaceutical industry, solid ingredients, such as tablets, capsules, and powders, are preferred for their precise dosage and longer shelf life. In cosmetics, solid forms are commonly found in products like bar soaps, powders, and solid deodorants, where they offer convenience and improved shelf stability. Additionally, solid active ingredients are easier to handle and store, reducing the risk of contamination that might occur with liquid or gas forms. Their solid state also provides controlled release mechanisms, making them ideal for sustained or slow-release formulations, particularly in pharmaceuticals and personal care. Companies are increasingly focusing on the development of new solid formulations that enhance the effectiveness and ease of use of active ingredients in various applications.
By Functionality
Conditioning agents dominated the Active Ingredients Market in 2023, accounting for 40% of the market share. These ingredients are essential in personal care products such as shampoos, conditioners, and moisturizers, as they help to improve the texture, appearance, and manageability of hair and skin. The growing demand for high-performance haircare and skincare products has driven the need for advanced conditioning agents that offer a range of benefits, including hydration, smoothness, and repair. Conditioning agents are often derived from both natural and synthetic sources, with key examples including silicones, proteins, and fatty alcohols. Companies like Dow and Croda International have developed conditioning agents that enhance the feel and appearance of hair, promoting shine, detangling, and frizz control. These ingredients are especially valued in the beauty and personal care industry, as consumers increasingly look for products that provide long-lasting, visible improvements to hair and skin health. The ability of conditioning agents to provide multifunctional benefits, such as anti-aging or UV protection, has also contributed to their dominance in the market.
Get Customized Report as per your Business Requirement - Request For Customized Report
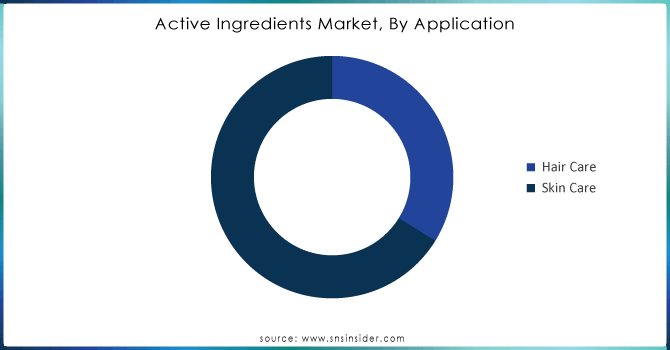
By Application
Cosmetics and personal care products dominated the application segment in the Active Ingredients Market in 2023, with a 50% market share. The sector continues to experience robust growth due to increasing consumer interest in beauty, skincare, and wellness products. Active ingredients play a crucial role in enhancing the efficacy of these products, providing benefits such as moisturizing, anti-aging, and sun protection. In skincare, active ingredients such as peptides, antioxidants, and vitamins are frequently used to address specific concerns like fine lines, wrinkles, and pigmentation. Similarly, in haircare, ingredients like proteins and botanical extracts help strengthen and nourish hair. The rising consumer demand for clean, natural, and sustainable beauty products has also contributed to the shift towards natural active ingredients in cosmetics and personal care. Companies such as L'Oréal and Johnson & Johnson have capitalized on this trend by formulating products with active ingredients that promote healthy skin and hair, meeting the growing consumer preference for high-quality, effective, and safe personal care solutions.
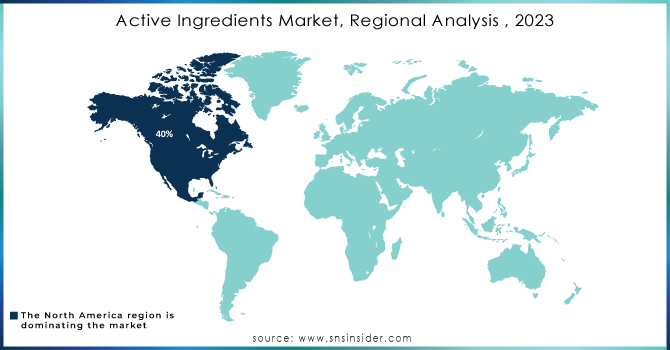
Active Ingredients Market Regional Analysis
In 2023, North America dominated the Active Ingredients Market, accounting for a market share of 35%. This dominance can be attributed to the presence of established pharmaceutical and cosmetics industries, along with a strong focus on research and development (R&D) in active ingredient formulation. The United States, as the leading country in this region, contributes significantly to this market due to its large consumer base and high demand for personal care products. The U.S. skincare market, for instance, was valued at approximately $16 billion in 2023, with active ingredients playing a crucial role in product formulations. Notable companies such as BASF, Evonik, and Dow are investing in innovative active ingredients to cater to the growing consumer preferences for clean and effective products. Additionally, stringent regulatory standards and a rising awareness of product safety further fuel the demand for high-quality active ingredients in the region. Canada and Mexico also contribute to the North American market, with increasing investments in cosmetic and pharmaceutical manufacturing, enhancing the region's overall market presence. The established distribution networks and robust retail presence of major brands allow for easy accessibility of products containing active ingredients, further solidifying North America's market leadership.
On the other hand, the Asia-Pacific region emerged as the fastest-growing market for active ingredients in 2023, with a CAGR of 8%. This growth is primarily driven by the rapid expansion of the cosmetics and personal care sector, particularly in emerging markets such as China, India, and Southeast Asia. China, as the largest beauty market in the world, generated over $65 billion in sales for cosmetics in 2023, with an increasing demand for innovative active ingredients to cater to a growing middle-class population interested in high-quality skincare and beauty products. Companies like Unilever and L'Oréal are investing heavily in R&D and localizing their product offerings to meet the unique preferences of Asian consumers. India is witnessing a significant rise in demand for herbal and natural active ingredients, with an estimated market size of $2.5 billion in 2023 for herbal cosmetics, indicating a shift toward traditional remedies and sustainability. Furthermore, the rise of e-commerce in the region has enabled easier access to a variety of active ingredient-based products, thereby driving market growth. In Southeast Asia, countries like Indonesia and Thailand are seeing increased consumer interest in skincare and beauty products infused with natural active ingredients, leading to a burgeoning market for active ingredients in these countries. This rapid expansion in the Asia-Pacific region reflects a broader global trend toward personal care and wellness, positioning it as a key area of growth for active ingredients.
Key Players
-
AkzoNobel N.V. (Ampholak, Armeen)
-
Ashland (Captivates, Natrosol)
-
BASF SE (Irganox, Uvinul)
-
Clariant (Genapol, Aristoflex)
-
Croda International Plc (Crodarom, Crodamol)
-
Dow Inc. (Carbopol, DOWSIL)
-
DuPont (Delrin, Tyvek)
-
Eastman Chemical Company (Aminox, Tamisolve)
-
Evonik Industries AG (Tegosoft, Aerosil)
-
FMC Corporation (Talstar, Capture)
-
Givaudan (Vetivyne, Yogurtene)
-
International Flavors & Fragrances Inc. (IFF) (RonaCare, Neutrazen)
-
Johnson Matthey (Methoxo-catalysts, PGMs)
-
Lanxess AG (Preventol, Bayferrox)
-
Lonza (Geogard, Proxel)
-
Merck KGaA (RonaFlair, Eusolex)
-
Royal DSM (Panthenol, All-Q)
-
Solvay (Rhodoline, Mackam)
-
Sumitomo Corporation (Valent products, Kenja)
-
Symrise AG (SymSave, SymRepair)
Recent Developments
-
December 2024: Adama introduced Gilboa, a new active ingredient aimed at enhancing pest control solutions with improved performance and sustainability in agriculture.
-
November 2024: The FDA proposed ending the use of oral phenylephrine in OTC nasal decongestants, citing a lack of effectiveness based on clinical evidence.
-
November 2024: Dhanuka Agritech signed an agreement with Bayer to acquire crop protection active ingredients, strengthening its position in the agricultural sector.
-
July 2023: Evonik acquired Novachem, a leading Argentine company specializing in sustainable and innovative cosmetic active ingredients, to enhance its System Solutions portfolio.
-
March 2023: BASF launched Axalion Active, a new insecticide with a unique mode of action that controls resistant pests while preserving beneficial insects, initially introduced in Asia Pacific
| Report Attributes | Details |
|---|---|
| Market Size in 2023 | US$ 3.9 Billion |
| Market Size by 2032 | US$ 6.2 Billion |
| CAGR | CAGR of 5.4% From 2024 to 2032 |
| Base Year | 2023 |
| Forecast Period | 2024-2032 |
| Historical Data | 2020-2022 |
| Report Scope & Coverage | Market Size, Segments Analysis, Competitive Landscape, Regional Analysis, DROC & SWOT Analysis, Forecast Outlook |
| Key Segments | •By Source (Plant-Based, Animal-Based, Microbial-Based) •By Type (Natural, Synthetic) •By Form (Solid, Liquid, Gas) •By Functionality (Conditioning Agents, Anti-ageing Agents, Skin-lightening Agents, UV Filters) •By Application (Pharmaceuticals, Cosmetics & Personal Care, Food & Beverages, Agricultural Chemicals, Others) |
| Regional Analysis/Coverage | North America (US, Canada, Mexico), Europe (Eastern Europe [Poland, Romania, Hungary, Turkey, Rest of Eastern Europe] Western Europe] Germany, France, UK, Italy, Spain, Netherlands, Switzerland, Austria, Rest of Western Europe]), Asia Pacific (China, India, Japan, South Korea, Vietnam, Singapore, Australia, Rest of Asia Pacific), Middle East & Africa (Middle East [UAE, Egypt, Saudi Arabia, Qatar, Rest of Middle East], Africa [Nigeria, South Africa, Rest of Africa], Latin America (Brazil, Argentina, Colombia, Rest of Latin America) |
| Company Profiles | AkzoNobel N.V., Evonik Industries AG, Ashland, Clariant, BASF SE, Lonza, DuPont, Sumitomo Corp, FMC Corporation, Croda International Plc, Eastman Chemical Company and other key players |
| Key Drivers | •Increasing Health and Wellness Trends Drive Growth in Active Ingredients for Dietary Supplements and Functional Foods •Government Regulations and Standards Encourage the Adoption of Safe and Effective Active Ingredients in Consumer Products |
| Restraints | •High Production Costs and Complex Manufacturing Processes of Active Ingredients Limit Market Growth and Profitability |
