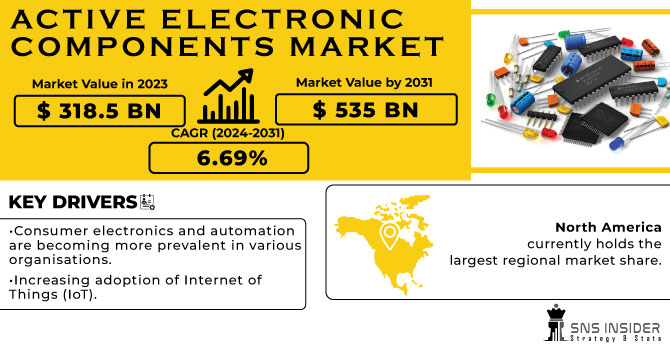
Active Electronic Components Market was valued at USD 323.50 billion in 2023 and is expected to reach USD 635.52 billion by 2032, growing at a CAGR of 7.81% from 2024-2032. This report includes an in-depth analysis of supply chain insights, investment and funding trends, regulatory and standards impact, and technology trends shaping the market. It examines product segments, including semiconductors, diodes, and ICs, and highlights end-user industries such as automotive, healthcare, and telecommunications. The report also addresses future demand forecasts, market share distribution, and the influence of emerging technologies like 5G and IoT on the market's growth trajectory.
Get more information on Active Electronic Components Market - Request Sample Report
Drivers
Rising Demand for Smartphones, Laptops, and Wearables Boosts Growth in Active Electronic Components Market
The fast growth of consumer electronics, especially smartphones, laptops, wearables, and smart home devices, is hugely influencing the active electronic components market. These products need high-level semiconductors, transistors, capacitors, and integrated circuit to enable their constantly increasing performance and functionality requirements. As customers increasingly embrace new technologies and require faster processing, greater energy efficiency, and more features, producers are emphasizing the creation of more powerful and smaller active components. This ongoing need for high-performance electronics in numerous industries, such as personal entertainment, healthcare, and communication, is driving innovation and leading to the mass use of active electronic components, and thus it is a primary driver of market growth.
Restraints
High Manufacturing Costs of Active Electronic Components Limit Market Growth and Affordability for Companies
The complicated manufacturing processes required to produce active electronic components, including semiconductors, capacitors, and integrated circuits, necessitate advanced technology and skilled personnel. This contributes to high manufacturing costs, which are likely to limit the ability of many companies, especially small firms, to effectively compete in the market. Moreover, the requirement for superior materials and sophisticated equipment also increases costs. Consequently, production costs can restrict affordability, particularly for companies that conduct business in price-sensitive markets. This issue can slow down market growth overall by limiting access to these critical components, causing production delays and decreased profitability for manufacturers.
Opportunities
5G Network Expansion Drives Increased Demand for Active Electronic Components in Communication, Mobile Devices, and IoT
The continued growth of 5G technology is fueling tremendous demand for active electronic components, particularly in communications infrastructure, mobile, and IoT. With 5G networks providing higher speeds, lower latency, and more connectivity, there is a demand for more sophisticated semiconductors, processors, and integrated circuits to enable these advancements. Mobile phones and wearables need high-performance active components to maximize 5G capabilities, and the IoT ecosystem, fueled by smart homes and industrial use cases, also relies on these components for increased connectivity and data processing. With the acceleration of 5G adoption worldwide, the demand for active electronic components will increase, offering long-term opportunities for manufacturers across industries, ranging from telecommunications to consumer electronics.
Challenges
Supply Chain Instability and Semiconductor Shortages Disrupt Production and Affect Stability in the Active Electronic Components Market
Disruptions in the global supply chain, particularly shortages of critical components like semiconductors, can severely impact the production of active electronic components. These shortages, often caused by factors such as geopolitical tensions, natural disasters, or logistical challenges, lead to delays in manufacturing and fulfillment of orders. As the demand for advanced electronics rises, the strain on the supply chain intensifies, resulting in longer lead times, increased costs, and reduced product availability. This instability can create uncertainty in the market, affecting not only manufacturers but also end-users who depend on a steady supply of components. As such, supply chain disruptions remain a significant challenge for companies striving to maintain operational efficiency and meet growing consumer and industry demand.
By Product Type
The Semiconductor Devices segment led the Active Electronic Components Market with the largest revenue share of approximately 50% in 2023 because they are extensively used across multiple industries. Semiconductors play a crucial role in electronic products such as smartphones, computers, and car systems, which are still in high demand. The increasing requirement for processing capability, energy efficiency, and small form factors in these products has made semiconductors the central technology fueling the market.
The Display Devices segment is anticipated to register the fastest CAGR of approximately 9.12% during 2024-2032 on account of the rising use of advanced display technology in consumer electronics, auto systems, and smart devices. With growing demand for quality screens for mobile phones, television sets, and wearables, the trend towards OLED, QLED, and flexible displays is driving growth. Moreover, the growing applications of display technology in AR/VR and smart home products also increase its growth prospect.
By End-use
The Consumer Electronics business led the Active Electronic Components Market with the largest revenue percentage share of around 29% in 2023 as a result of sustained demand growth for smartphones, laptops, wearables, and other personal devices. Growing consumer demand for high-end, high-performance electronics with enhanced processing power, energy efficiency, and connectivity leads to the demand for active electronic components such as semiconductors, capacitors, and microchips, making the largest contribution to the market dominance.
The Automotive segment will have the fastest growth rate of around 9.64% during 2024-2032 based on increasing the use of electric vehicles and autonomous vehicle technologies. Advanced active electronic components play a vital role in EVs' battery management systems, power electronics, and in-vehicle communication systems. In addition, increased emphasis on vehicle safety, automation, and infotainment systems is influencing demand for advanced electronic components used in advanced automobiles, which is fueling the fast growth of the market.
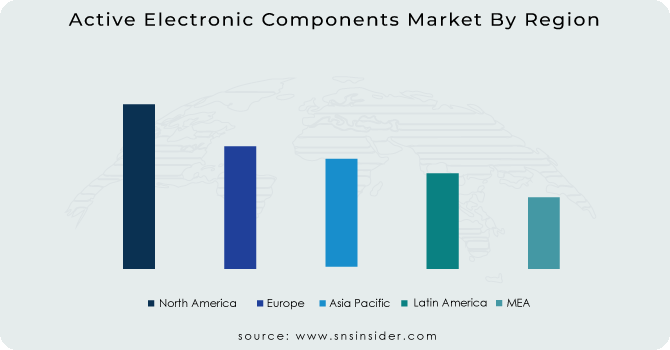
The Asia Pacific segment dominated the Active Electronic Components Market with the highest revenue share of about 40% in 2023 due to the region's strong manufacturing base and high demand for electronic products. Countries like China, Japan, and South Korea are major hubs for electronics production and export. Additionally, the rapid adoption of consumer electronics, automotive innovations, and industrial automation in the region further drives the demand for active electronic components, cementing Asia Pacific's dominance.
The North America segment is expected to grow at the fastest CAGR of about 9.35% from 2024-2032 due to the increasing focus on technological advancements, particularly in sectors like automotive, healthcare, and consumer electronics. The region is also a leader in the development of 5G, AI, and IoT technologies, which require high-performance active electronic components. Furthermore, the growing shift toward electric vehicles and renewable energy systems boosts demand for these components in North America.
Need any customization research on Active Electronic Components Market - Enquiry Now
Infineon Technologies AG (Power Semiconductors, Microcontrollers)
Advanced Micro Devices, Inc. (Processors, Graphics Cards)
STMicroelectronics N.V. (Microcontrollers, Power MOSFETs)
Microchip Technology, Inc. (Microcontrollers, Analog-to-Digital Converters)
Analog Devices, Inc. (Operational Amplifiers, Voltage Regulators)
Broadcom Inc. (Network Interface Controllers, Wireless Chipsets)
NXP Semiconductors N.V. (Microcontrollers, RF Amplifiers)
Intel Corporation (Processors, Memory Modules)
Monolithic Power Systems, Inc. (Power Management ICs, LED Drivers)
Texas Instruments Incorporated (Voltage Regulators, Op-Amps)
Qualcomm Inc. (Processors, Modem Chips)
Renesas Electronics Corporation (Microcontrollers, Analog ICs)
Semiconductor Components Industries, LLC (Rectifiers, Transistors)
Toshiba Corporation (Power Semiconductors, Microcontrollers)
Hitachi AIC Inc. (Power Supplies, Inverters)
Panasonic Corporation (Capacitors, Semiconductor Devices)
Everlight Electronics Co., Ltd. (LED Modules, Opto Semiconductors)
Vishay Intertechnology, Inc. (Resistors, Capacitors)
Diotec Semiconductor AG (Rectifiers, Zener Diodes)
ON Semiconductor (Voltage Regulators, Power MOSFETs)
Maxim Integrated Products Inc. (Voltage Regulators, Data Converters)
Fairchild Semiconductor International, Inc. (Power MOSFETs, Diodes)
Recent Developments:
In November 2024, Infineon introduced the AURIX TC4Dx, a high-performance microcontroller designed for automotive applications, featuring advanced multi-core architecture and enhanced cybersecurity features
In October 2024, Qualcomm unveiled its AI innovations for mobile and automotive applications at the Snapdragon Summit, showcasing its leadership in on-device AI and introducing new models and collaborations
In February 2024, Texas Instruments introduced two new power conversion device portfolios that push the limits of power design, offering industry-leading power density with enhanced efficiency and a 40% reduction in solution size.
| Report Attributes | Details |
| Market Size in 2023 | USD 323.50 Billion |
| Market Size by 2032 | USD 635.52 Billion |
| CAGR | CAGR of 7.81% From 2024 to 2032 |
| Base Year | 2023 |
| Forecast Period | 2024-2032 |
| Historical Data | 2020-2022 |
| Report Scope & Coverage | Market Size, Segments Analysis, Competitive Landscape, Regional Analysis, DROC & SWOT Analysis, Forecast Outlook |
| Key Segments | • By Product Type (Semiconductor Devices, Vacuum Tube, Display Devices, Others) • By End-use (Consumer Electronics, Networking & Telecommunication, Automotive, Manufacturing, Aerospace & Defense, Healthcare, Others) |
| Regional Analysis/Coverage | North America (US, Canada, Mexico), Europe (Eastern Europe [Poland, Romania, Hungary, Turkey, Rest of Eastern Europe] Western Europe] Germany, France, UK, Italy, Spain, Netherlands, Switzerland, Austria, Rest of Western Europe]), Asia Pacific (China, India, Japan, South Korea, Vietnam, Singapore, Australia, Rest of Asia Pacific), Middle East & Africa (Middle East [UAE, Egypt, Saudi Arabia, Qatar, Rest of Middle East], Africa [Nigeria, South Africa, Rest of Africa], Latin America (Brazil, Argentina, Colombia, Rest of Latin America) |
| Company Profiles | Infineon Technologies AG, Advanced Micro Devices, Inc., STMicroelectronics N.V., Microchip Technology, Inc., Analog Devices, Inc., Broadcom Inc., NXP Semiconductors N.V., Intel Corporation, Monolithic Power Systems, Inc., Texas Instruments Incorporated, Qualcomm Inc., Renesas Electronics Corporation, Semiconductor Components Industries, LLC, Toshiba Corporation, Hitachi AIC Inc., Panasonic Corporation, Everlight Electronics Co., Ltd., Vishay Intertechnology, Inc., Diotec Semiconductor AG, ON Semiconductor, Maxim Integrated Products Inc., Fairchild Semiconductor International, Inc. |
ANS: Active Electronic Components Market was valued at USD 323.50 billion in 2023 and is expected to reach USD 635.52 billion by 2032, growing at a CAGR of 7.81% from 2024-2032.
ANS: The Semiconductor Devices segment dominated with a revenue share of about 50% in 2023.
ANS: The Consumer Electronics segment dominated with a revenue share of about 29% in 2023.
ANS: The Asia Pacific region dominated with a revenue share of about 40% in 2023.
ANS: The rising demand for smartphones, laptops, and wearables is a major driver of the market.
Table of Content
1. Introduction
1.1 Market Definition
1.2 Scope (Inclusion and Exclusions)
1.3 Research Assumptions
2. Executive Summary
2.1 Market Overview
2.2 Regional Synopsis
2.3 Competitive Summary
3. Research Methodology
3.1 Top-Down Approach
3.2 Bottom-up Approach
3.3. Data Validation
3.4 Primary Interviews
4. Market Dynamics Impact Analysis
4.1 Market Driving Factors Analysis
4.1.2 Drivers
4.1.2 Restraints
4.1.3 Opportunities
4.1.4 Challenges
4.2 PESTLE Analysis
4.3 Porter’s Five Forces Model
5. Statistical Insights and Trends Reporting
5.1 Supply Chain Insights
5.2 Investment and Funding Trends
5.3 Regulatory and Standards Impact
5.4 Technology Trends
6. Competitive Landscape
6.1 List of Major Companies, By Region
6.2 Market Share Analysis, By Region
6.3 Product Benchmarking
6.3.1 Product specifications and features
6.3.2 Pricing
6.4 Strategic Initiatives
6.4.1 Marketing and promotional activities
6.4.2 Distribution and supply chain strategies
6.4.3 Expansion plans and new product launches
6.4.4 Strategic partnerships and collaborations
6.5 Technological Advancements
6.6 Market Positioning and Branding
7. Active Electronic Components Market Segmentation, By Product Type
7.1 Chapter Overview
7.2 Semiconductor Devices
7.2.1 Semiconductor Devices Market Trends Analysis (2020-2032)
7.2.2 Semiconductor Devices Market Size Estimates and Forecasts to 2032 (USD Billion)
7.2.3 Diode
7.2.3.1 Diode Market Trends Analysis (2020-2032)
7.2.3.2 Diode Market Size Estimates and Forecasts to 2032 (USD Billion)
7.2.4 Transistors
7.2.4.1 Transistors Market Trends Analysis (2020-2032)
7.2.4.2 Transistors Market Size Estimates and Forecasts to 2032 (USD Billion)
7.2.5 Integrated Circuits (ICs)
7.2.5.1 Integrated Circuits (ICs) Market Trends Analysis (2020-2032)
7.2.5.2 Integrated Circuits (ICs) Market Size Estimates and Forecasts to 2032 (USD Billion)
7.2.6 Optoelectronics
7.2.6.1 Optoelectronics Devices Market Trends Analysis (2020-2032)
7.2.6.2 Optoelectronics Devices Market Size Estimates and Forecasts to 2032 (USD Billion)
7.3 Vacuum Tube
7.3.1 Vacuum Tube Market Trends Analysis (2020-2032)
7.3.2 Vacuum Tube Market Size Estimates and Forecasts to 2032 (USD Billion)
7.4 Display Devices
7.4.1 Display Devices Market Trends Analysis (2020-2032)
7.4.2 Display Devices Market Size Estimates and Forecasts to 2032 (USD Billion)
7.5 Others
7.5.1 Others Market Trends Analysis (2020-2032)
7.5.2 Others Market Size Estimates and Forecasts to 2032 (USD Billion)
8. Active Electronic Components Market Segmentation, By End-use
8.1 Chapter Overview
8.2 Consumer Electronics
8.2.1 Consumer Electronics Market Trends Analysis (2020-2032)
8.2.2 Consumer Electronics Market Size Estimates and Forecasts to 2032 (USD Billion)
8.3 Networking & Telecommunication
8.3.1 Networking & Telecommunication Market Trends Analysis (2020-2032)
8.3.2 Networking & Telecommunication Market Size Estimates and Forecasts to 2032 (USD Billion)
8.4 Automotive
8.4.1 Automotive Market Trends Analysis (2020-2032)
8.4.2 Automotive Market Size Estimates and Forecasts to 2032 (USD Billion)
8.5 Manufacturing
8.5.1 Manufacturing Market Trends Analysis (2020-2032)
8.5.2 Manufacturing Market Size Estimates and Forecasts to 2032 (USD Billion)
8.6 Aerospace & Defense
8.6.1 Aerospace & Defense Market Trends Analysis (2020-2032)
8.6.2 Aerospace & Defense Market Size Estimates and Forecasts to 2032 (USD Billion)
8.7 Healthcare
8.7.1 Healthcare Market Trends Analysis (2020-2032)
8.7.2 Healthcare Market Size Estimates and Forecasts to 2032 (USD Billion)
8.8 Others
8.8.1 Others Market Trends Analysis (2020-2032)
8.8.2 Others Market Size Estimates and Forecasts to 2032 (USD Billion)
9. Regional Analysis
9.1 Chapter Overview
9.2 North America
9.2.1 Trends Analysis
9.2.2 North America Active Electronic Components Market Estimates and Forecasts, by Country (2020-2032) (USD Billion)
9.2.3 North America Active Electronic Components Market Estimates and Forecasts, By Product Type (2020-2032) (USD Billion)
9.2.4 North America Active Electronic Components Market Estimates and Forecasts, By End-use (2020-2032) (USD Billion)
9.2.5 USA
9.2.5.1 USA Active Electronic Components Market Estimates and Forecasts, By Product Type (2020-2032) (USD Billion)
9.2.5.2 USA Active Electronic Components Market Estimates and Forecasts, By End-use (2020-2032) (USD Billion)
9.2.6 Canada
9.2.6.1 Canada Active Electronic Components Market Estimates and Forecasts, By Product Type (2020-2032) (USD Billion)
9.2.6.2 Canada Active Electronic Components Market Estimates and Forecasts, By End-use (2020-2032) (USD Billion)
9.2.7 Mexico
9.2.7.1 Mexico Active Electronic Components Market Estimates and Forecasts, By Product Type (2020-2032) (USD Billion)
9.2.7.2 Mexico Active Electronic Components Market Estimates and Forecasts, By End-use (2020-2032) (USD Billion)
9.3 Europe
9.3.1 Eastern Europe
9.3.1.1 Trends Analysis
9.3.1.2 Eastern Europe Active Electronic Components Market Estimates and Forecasts, by Country (2020-2032) (USD Billion)
9.3.1.3 Eastern Europe Active Electronic Components Market Estimates and Forecasts, By Product Type (2020-2032) (USD Billion)
9.3.1.4 Eastern Europe Active Electronic Components Market Estimates and Forecasts, By End-use (2020-2032) (USD Billion)
9.3.1.5 Poland
9.3.1.5.1 Poland Active Electronic Components Market Estimates and Forecasts, By Product Type (2020-2032) (USD Billion)
9.3.1.5.2 Poland Active Electronic Components Market Estimates and Forecasts, By End-use (2020-2032) (USD Billion)
9.3.1.6 Romania
9.3.1.6.1 Romania Active Electronic Components Market Estimates and Forecasts, By Product Type (2020-2032) (USD Billion)
9.3.1.6.2 Romania Active Electronic Components Market Estimates and Forecasts, By End-use (2020-2032) (USD Billion)
9.3.1.7 Hungary
9.3.1.7.1 Hungary Active Electronic Components Market Estimates and Forecasts, By Product Type (2020-2032) (USD Billion)
9.3.1.7.2 Hungary Active Electronic Components Market Estimates and Forecasts, By End-use (2020-2032) (USD Billion)
9.3.1.8 Turkey
9.3.1.8.1 Turkey Active Electronic Components Market Estimates and Forecasts, By Product Type (2020-2032) (USD Billion)
9.3.1.8.2 Turkey Active Electronic Components Market Estimates and Forecasts, By End-use (2020-2032) (USD Billion)
9.3.1.9 Rest of Eastern Europe
9.3.1.9.1 Rest of Eastern Europe Active Electronic Components Market Estimates and Forecasts, By Product Type (2020-2032) (USD Billion)
9.3.1.9.2 Rest of Eastern Europe Active Electronic Components Market Estimates and Forecasts, By End-use (2020-2032) (USD Billion)
9.3.2 Western Europe
9.3.2.1 Trends Analysis
9.3.2.2 Western Europe Active Electronic Components Market Estimates and Forecasts, by Country (2020-2032) (USD Billion)
9.3.2.3 Western Europe Active Electronic Components Market Estimates and Forecasts, By Product Type (2020-2032) (USD Billion)
9.3.2.4 Western Europe Active Electronic Components Market Estimates and Forecasts, By End-use (2020-2032) (USD Billion)
9.3.2.5 Germany
9.3.2.5.1 Germany Active Electronic Components Market Estimates and Forecasts, By Product Type (2020-2032) (USD Billion)
9.3.2.5.2 Germany Active Electronic Components Market Estimates and Forecasts, By End-use (2020-2032) (USD Billion)
9.3.2.6 France
9.3.2.6.1 France Active Electronic Components Market Estimates and Forecasts, By Product Type (2020-2032) (USD Billion)
9.3.2.6.2 France Active Electronic Components Market Estimates and Forecasts, By End-use (2020-2032) (USD Billion)
9.3.2.7 UK
9.3.2.7.1 UK Active Electronic Components Market Estimates and Forecasts, By Product Type (2020-2032) (USD Billion)
9.3.2.7.2 UK Active Electronic Components Market Estimates and Forecasts, By End-use (2020-2032) (USD Billion)
9.3.2.8 Italy
9.3.2.8.1 Italy Active Electronic Components Market Estimates and Forecasts, By Product Type (2020-2032) (USD Billion)
9.3.2.8.2 Italy Active Electronic Components Market Estimates and Forecasts, By End-use (2020-2032) (USD Billion)
9.3.2.9 Spain
9.3.2.9.1 Spain Active Electronic Components Market Estimates and Forecasts, By Product Type (2020-2032) (USD Billion)
9.3.2.9.2 Spain Active Electronic Components Market Estimates and Forecasts, By End-use (2020-2032) (USD Billion)
9.3.2.10 Netherlands
9.3.2.10.1 Netherlands Active Electronic Components Market Estimates and Forecasts, By Product Type (2020-2032) (USD Billion)
9.3.2.10.2 Netherlands Active Electronic Components Market Estimates and Forecasts, By End-use (2020-2032) (USD Billion)
9.3.2.11 Switzerland
9.3.2.11.1 Switzerland Active Electronic Components Market Estimates and Forecasts, By Product Type (2020-2032) (USD Billion)
9.3.2.11.2 Switzerland Active Electronic Components Market Estimates and Forecasts, By End-use (2020-2032) (USD Billion)
9.3.2.12 Austria
9.3.2.12.1 Austria Active Electronic Components Market Estimates and Forecasts, By Product Type (2020-2032) (USD Billion)
9.3.2.12.2 Austria Active Electronic Components Market Estimates and Forecasts, By End-use (2020-2032) (USD Billion)
9.3.2.13 Rest of Western Europe
9.3.2.13.1 Rest of Western Europe Active Electronic Components Market Estimates and Forecasts, By Product Type (2020-2032) (USD Billion)
9.3.2.13.2 Rest of Western Europe Active Electronic Components Market Estimates and Forecasts, By End-use (2020-2032) (USD Billion)
9.4 Asia Pacific
9.4.1 Trends Analysis
9.4.2 Asia Pacific Active Electronic Components Market Estimates and Forecasts, by Country (2020-2032) (USD Billion)
9.4.3 Asia Pacific Active Electronic Components Market Estimates and Forecasts, By Product Type (2020-2032) (USD Billion)
9.4.4 Asia Pacific Active Electronic Components Market Estimates and Forecasts, By End-use (2020-2032) (USD Billion)
9.4.5 China
9.4.5.1 China Active Electronic Components Market Estimates and Forecasts, By Product Type (2020-2032) (USD Billion)
9.4.5.2 China Active Electronic Components Market Estimates and Forecasts, By End-use (2020-2032) (USD Billion)
9.4.6 India
9.4.5.1 India Active Electronic Components Market Estimates and Forecasts, By Product Type (2020-2032) (USD Billion)
9.4.5.2 India Active Electronic Components Market Estimates and Forecasts, By End-use (2020-2032) (USD Billion)
9.4.5 Japan
9.4.5.1 Japan Active Electronic Components Market Estimates and Forecasts, By Product Type (2020-2032) (USD Billion)
9.4.5.2 Japan Active Electronic Components Market Estimates and Forecasts, By End-use (2020-2032) (USD Billion)
9.4.6 South Korea
9.4.6.1 South Korea Active Electronic Components Market Estimates and Forecasts, By Product Type (2020-2032) (USD Billion)
9.4.6.2 South Korea Active Electronic Components Market Estimates and Forecasts, By End-use (2020-2032) (USD Billion)
9.4.7 Vietnam
9.4.7.1 Vietnam Active Electronic Components Market Estimates and Forecasts, By Product Type (2020-2032) (USD Billion)
9.2.7.2 Vietnam Active Electronic Components Market Estimates and Forecasts, By End-use (2020-2032) (USD Billion)
9.4.8 Singapore
9.4.8.1 Singapore Active Electronic Components Market Estimates and Forecasts, By Product Type (2020-2032) (USD Billion)
9.4.8.2 Singapore Active Electronic Components Market Estimates and Forecasts, By End-use (2020-2032) (USD Billion)
9.4.9 Australia
9.4.9.1 Australia Active Electronic Components Market Estimates and Forecasts, By Product Type (2020-2032) (USD Billion)
9.4.9.2 Australia Active Electronic Components Market Estimates and Forecasts, By End-use (2020-2032) (USD Billion)
9.4.10 Rest of Asia Pacific
9.4.10.1 Rest of Asia Pacific Active Electronic Components Market Estimates and Forecasts, By Product Type (2020-2032) (USD Billion)
9.4.10.2 Rest of Asia Pacific Active Electronic Components Market Estimates and Forecasts, By End-use (2020-2032) (USD Billion)
9.5 Middle East and Africa
9.5.1 Middle East
9.5.1.1 Trends Analysis
9.5.1.2 Middle East Active Electronic Components Market Estimates and Forecasts, by Country (2020-2032) (USD Billion)
9.5.1.3 Middle East Active Electronic Components Market Estimates and Forecasts, By Product Type (2020-2032) (USD Billion)
9.5.1.4 Middle East Active Electronic Components Market Estimates and Forecasts, By End-use (2020-2032) (USD Billion)
9.5.1.5 UAE
9.5.1.5.1 UAE Active Electronic Components Market Estimates and Forecasts, By Product Type (2020-2032) (USD Billion)
9.5.1.5.2 UAE Active Electronic Components Market Estimates and Forecasts, By End-use (2020-2032) (USD Billion)
9.5.1.6 Egypt
9.5.1.6.1 Egypt Active Electronic Components Market Estimates and Forecasts, By Product Type (2020-2032) (USD Billion)
9.5.1.6.2 Egypt Active Electronic Components Market Estimates and Forecasts, By End-use (2020-2032) (USD Billion)
9.5.1.7 Saudi Arabia
9.5.1.7.1 Saudi Arabia Active Electronic Components Market Estimates and Forecasts, By Product Type (2020-2032) (USD Billion)
9.5.1.7.2 Saudi Arabia Active Electronic Components Market Estimates and Forecasts, By End-use (2020-2032) (USD Billion)
9.5.1.8 Qatar
9.5.1.8.1 Qatar Active Electronic Components Market Estimates and Forecasts, By Product Type (2020-2032) (USD Billion)
9.5.1.8.2 Qatar Active Electronic Components Market Estimates and Forecasts, By End-use (2020-2032) (USD Billion)
9.5.1.9 Rest of Middle East
9.5.1.9.1 Rest of Middle East Active Electronic Components Market Estimates and Forecasts, By Product Type (2020-2032) (USD Billion)
9.5.1.9.2 Rest of Middle East Active Electronic Components Market Estimates and Forecasts, By End-use (2020-2032) (USD Billion)
9.5.2 Africa
9.5.2.1 Trends Analysis
9.5.2.2 Africa Active Electronic Components Market Estimates and Forecasts, by Country (2020-2032) (USD Billion)
9.5.2.3 Africa Active Electronic Components Market Estimates and Forecasts, By Product Type (2020-2032) (USD Billion)
9.5.2.4 Africa Active Electronic Components Market Estimates and Forecasts, By End-use (2020-2032) (USD Billion)
9.5.2.5 South Africa
9.5.2.5.1 South Africa Active Electronic Components Market Estimates and Forecasts, By Product Type (2020-2032) (USD Billion)
9.5.2.5.2 South Africa Active Electronic Components Market Estimates and Forecasts, By End-use (2020-2032) (USD Billion)
9.5.2.6 Nigeria
9.5.2.6.1 Nigeria Active Electronic Components Market Estimates and Forecasts, By Product Type (2020-2032) (USD Billion)
9.5.2.6.2 Nigeria Active Electronic Components Market Estimates and Forecasts, By End-use (2020-2032) (USD Billion)
9.5.2.7 Rest of Africa
9.5.2.7.1 Rest of Africa Active Electronic Components Market Estimates and Forecasts, By Product Type (2020-2032) (USD Billion)
9.5.2.7.2 Rest of Africa Active Electronic Components Market Estimates and Forecasts, By End-use (2020-2032) (USD Billion)
9.6 Latin America
9.6.1 Trends Analysis
9.6.2 Latin America Active Electronic Components Market Estimates and Forecasts, by Country (2020-2032) (USD Billion)
9.6.3 Latin America Active Electronic Components Market Estimates and Forecasts, By Product Type (2020-2032) (USD Billion)
9.6.4 Latin America Active Electronic Components Market Estimates and Forecasts, By End-use (2020-2032) (USD Billion)
9.6.5 Brazil
9.6.5.1 Brazil Active Electronic Components Market Estimates and Forecasts, By Product Type (2020-2032) (USD Billion)
9.6.5.2 Brazil Active Electronic Components Market Estimates and Forecasts, By End-use (2020-2032) (USD Billion)
9.6.6 Argentina
9.6.6.1 Argentina Active Electronic Components Market Estimates and Forecasts, By Product Type (2020-2032) (USD Billion)
9.6.6.2 Argentina Active Electronic Components Market Estimates and Forecasts, By End-use (2020-2032) (USD Billion)
9.6.7 Colombia
9.6.7.1 Colombia Active Electronic Components Market Estimates and Forecasts, By Product Type (2020-2032) (USD Billion)
9.6.7.2 Colombia Active Electronic Components Market Estimates and Forecasts, By End-use (2020-2032) (USD Billion)
9.6.8 Rest of Latin America
9.6.8.1 Rest of Latin America Active Electronic Components Market Estimates and Forecasts, By Product Type (2020-2032) (USD Billion)
9.6.8.2 Rest of Latin America Active Electronic Components Market Estimates and Forecasts, By End-use (2020-2032) (USD Billion)
10. Company Profiles
10.1 Infineon Technologies AG
10.1.1 Company Overview
10.1.2 Financial
10.1.3 Products/ Services Offered
10.1.4 SWOT Analysis
10.2 Advanced Micro Devices, Inc.
10.2.1 Company Overview
10.2.2 Financial
10.2.3 Products/ Services Offered
10.2.4 SWOT Analysis
10.3 STMicroelectronics N.V.
10.3.1 Company Overview
10.3.2 Financial
10.3.3 Products/ Services Offered
10.3.4 SWOT Analysis
10.4 Microchip Technology, Inc.
10.4.1 Company Overview
10.4.2 Financial
10.4.3 Products/ Services Offered
10.4.4 SWOT Analysis
10.5 Analog Devices, Inc.
10.5.1 Company Overview
10.5.2 Financial
10.5.3 Products/ Services Offered
10.5.4 SWOT Analysis
10.6 Broadcom Inc.
10.6.1 Company Overview
10.6.2 Financial
10.6.3 Products/ Services Offered
10.6.4 SWOT Analysis
10.7 NXP Semiconductors N.V.
10.7.1 Company Overview
10.7.2 Financial
10.7.3 Products/ Services Offered
10.7.4 SWOT Analysis
10.8 Intel Corporation
10.8.1 Company Overview
10.8.2 Financial
10.8.3 Products/ Services Offered
10.8.4 SWOT Analysis
10.9 Monolithic Power Systems, Inc.
10.9.1 Company Overview
10.9.2 Financial
10.9.3 Products/ Services Offered
10.9.4 SWOT Analysis
10.10 Texas Instruments Incorporated
10.10.1 Company Overview
10.10.2 Financial
10.10.3 Products/ Services Offered
10.10.4 SWOT Analysis
11. Use Cases and Best Practices
12. Conclusion
An accurate research report requires proper strategizing as well as implementation. There are multiple factors involved in the completion of good and accurate research report and selecting the best methodology to compete the research is the toughest part. Since the research reports we provide play a crucial role in any company’s decision-making process, therefore we at SNS Insider always believe that we should choose the best method which gives us results closer to reality. This allows us to reach at a stage wherein we can provide our clients best and accurate investment to output ratio.
Each report that we prepare takes a timeframe of 350-400 business hours for production. Starting from the selection of titles through a couple of in-depth brain storming session to the final QC process before uploading our titles on our website we dedicate around 350 working hours. The titles are selected based on their current market cap and the foreseen CAGR and growth.
The 5 steps process:
Step 1: Secondary Research:
Secondary Research or Desk Research is as the name suggests is a research process wherein, we collect data through the readily available information. In this process we use various paid and unpaid databases which our team has access to and gather data through the same. This includes examining of listed companies’ annual reports, Journals, SEC filling etc. Apart from this our team has access to various associations across the globe across different industries. Lastly, we have exchange relationships with various university as well as individual libraries.

Step 2: Primary Research
When we talk about primary research, it is a type of study in which the researchers collect relevant data samples directly, rather than relying on previously collected data. This type of research is focused on gaining content specific facts that can be sued to solve specific problems. Since the collected data is fresh and first hand therefore it makes the study more accurate and genuine.
We at SNS Insider have divided Primary Research into 2 parts.
Part 1 wherein we interview the KOLs of major players as well as the upcoming ones across various geographic regions. This allows us to have their view over the market scenario and acts as an important tool to come closer to the accurate market numbers. As many as 45 paid and unpaid primary interviews are taken from both the demand and supply side of the industry to make sure we land at an accurate judgement and analysis of the market.
This step involves the triangulation of data wherein our team analyses the interview transcripts, online survey responses and observation of on filed participants. The below mentioned chart should give a better understanding of the part 1 of the primary interview.

Part 2: In this part of primary research the data collected via secondary research and the part 1 of the primary research is validated with the interviews from individual consultants and subject matter experts.
Consultants are those set of people who have at least 12 years of experience and expertise within the industry whereas Subject Matter Experts are those with at least 15 years of experience behind their back within the same space. The data with the help of two main processes i.e., FGDs (Focused Group Discussions) and IDs (Individual Discussions). This gives us a 3rd party nonbiased primary view of the market scenario making it a more dependable one while collation of the data pointers.
Step 3: Data Bank Validation
Once all the information is collected via primary and secondary sources, we run that information for data validation. At our intelligence centre our research heads track a lot of information related to the market which includes the quarterly reports, the daily stock prices, and other relevant information. Our data bank server gets updated every fortnight and that is how the information which we collected using our primary and secondary information is revalidated in real time.

Step 4: QA/QC Process
After all the data collection and validation our team does a final level of quality check and quality assurance to get rid of any unwanted or undesired mistakes. This might include but not limited to getting rid of the any typos, duplication of numbers or missing of any important information. The people involved in this process include technical content writers, research heads and graphics people. Once this process is completed the title gets uploader on our platform for our clients to read it.
Step 5: Final QC/QA Process:
This is the last process and comes when the client has ordered the study. In this process a final QA/QC is done before the study is emailed to the client. Since we believe in giving our clients a good experience of our research studies, therefore, to make sure that we do not lack at our end in any way humanly possible we do a final round of quality check and then dispatch the study to the client.
Key Segments:
By Product Type
Semiconductor Devices
Diode
Transistors
Integrated Circuits (ICs)
Optoelectronics
Vacuum Tube
Display Devices
Others
By End-use
Consumer Electronics
Networking & Telecommunication
Automotive
Manufacturing
Aerospace & Defense
Healthcare
Others
Request for Segment Customization as per your Business Requirement: Segment Customization Request
Regional Coverage:
North America
US
Canada
Mexico
Europe
Eastern Europe
Poland
Romania
Hungary
Turkey
Rest of Eastern Europe
Western Europe
Germany
France
UK
Italy
Spain
Netherlands
Switzerland
Austria
Rest of Western Europe
Asia Pacific
China
India
Japan
South Korea
Vietnam
Singapore
Australia
Rest of Asia Pacific
Middle East & Africa
Middle East
UAE
Egypt
Saudi Arabia
Qatar
Rest of Middle East
Africa
Nigeria
South Africa
Rest of Africa
Latin America
Brazil
Argentina
Colombia
Rest of Latin America
Request for Country Level Research Report: Country Level Customization Request
Available Customization
With the given market data, SNS Insider offers customization as per the company’s specific needs. The following customization options are available for the report:
Detailed Volume Analysis
Criss-Cross segment analysis (e.g. Product X Application)
Competitive Product Benchmarking
Geographic Analysis
Additional countries in any of the regions
Customized Data Representation
Detailed analysis and profiling of additional market players
The Programmable Robots Market was valued at USD 3.44 billion in 2023 and is expected to reach USD 13.22 billion by 2032, growing at a CAGR of 16.16% over the forecast period 2024-2032.
The MEMS Sensors Market Size was valued at USD 15.15 Billion in 2023 and is expected to grow at a CAGR of 10.3% to reach USD 36.50 Billion by 2032.
The Tank Level Monitoring System Market was valued at USD 887.88 million in 2023 and is expected to grow at 6.46% CAGR to reach USD 1554.23 million by 2032.
The DRAM Module and Component Market Size was valued at $96.91 Billion in 2023 and is expected to grow at a CAGR of 1.75% to reach $113.26 Billion by 2032
The Spectrum Analyzer Market Size was valued at USD 1.66 Billion in 2023 and is expected to reach USD 3.17 Billion by 2032 and grow at a CAGR of 7.51% over the forecast period 2024-2032.
The Inventory Tags Market Share was USD 5.51 billion in 2023 & is expected to grow to USD 8.19 billion by 2032 & grow at a CAGR of 4.51% by 2024-2032.

Hi! Click one of our member below to chat on Phone
© 2025 All Rights Reserved by SNS Insider Pvt Ltd


