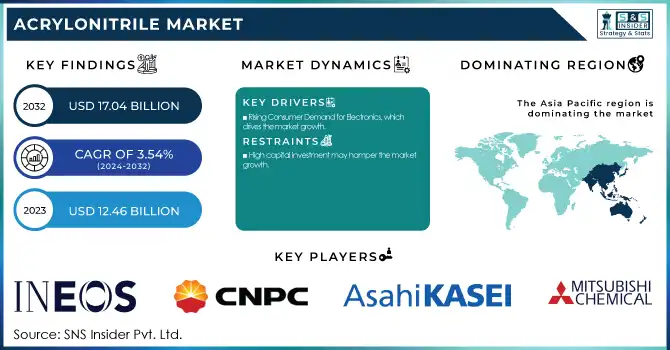
The Acrylonitrile Market size was USD 12.46 Billion in 2023 and is expected to reach USD 17.04 Billion by 2032 and grow at a CAGR of 3.54% over the forecast period of 2024-2032. This reporting on the acrylonitrile market provides key insights into the production capacity and utilization trends across regions in 2023, highlighting feedstock price fluctuations and their impact on production costs. It examines the regulatory landscape, detailing the influence of environmental and industry-specific regulations on the market. Environmental metrics are explored, including emissions data and sustainability initiatives in major producing regions. The report also focuses on recent innovations and R&D efforts, particularly in green production technologies. Furthermore, it covers market demand trends by end-use applications such as acrylic fibers and nitrile rubber. Key regional shifts in production and consumption patterns are analyzed, offering a comprehensive view of market dynamics. These insights are crucial for understanding the evolving acrylonitrile market landscape.
Drivers
Rising Consumer Demand for Electronics, which drives the market growth.
A major proportion of acrylonitrile is used in the production of ABS (Acrylonitrile Butadiene Styrene) plastics widely used in the electronics sector owing to the increasing consumer demand for electronics which is propelling acrylonitrile market. As smartphones, laptops, home appliances, and other electronic devices proliferate in terms of both usage and volume of manufacturing, the demand for durable, lightweight, and low-cost materials to produce outer casings and parts continues to rise. Moreover, of its excellent strength, impact resistance, and ease of molding, ABS is great for these applications. The worldwide demand for consumer electronics is growing at a rapid pace owing to technological development, increasing disposable income, and an emerging middle class, resulting in high demand for acrylonitrile-based ABS plastics. The request for acrylonitrile is enhanced by this increasing trend in electronics, driving the creation in the production of this material to find means to fit the electronic industry's changing requirements.
Restraint
High capital investment may hamper the market growth.
A major challenge that can restrain the growth of the acrylonitrile market is the high capital investment required to set up acrylonitrile production plants. Acrylonitrile is produced through a multi-stage, and high-energy intensive processes, which is associated with use of any large-scale production facilities, and special equipment, and necessary technologies. Setting up these facilities often comes with high cost, making it difficult for smaller players or new entrants to the market to make such an investment. The long payback times of these investments will also be long-term a disincentive in investment decisions on the part of potential investors in a volatile and demand-variable price environment. Such high capex also reduces the flexibility of companies to quickly scale operations due to market shifts, which might delay innovation and lower competitiveness. This leads to huge initial investments that can be a barrier to the overall growth of the acrylonitrile market.
Opportunity
Rising demand for bio-based acrylonitrile create an opportunity in the market.
Rise of bio-based numbers among industries and consumers is gaining priority over sustainability and eco-friendly solutions. However, the traditional processes to produce acryl nitrile have high-energy and fossil fuel dependency, which raises environmental and climate concerns. This has led to an increased commitment to alternative approaches that use renewable and sustainable resources of biomass or waste materials instead of petrochemical feedstocks. The transition to greener energy vehicles is fueled in part by tighter environmental policies from the governments, and by consumers looking for greener products. By producing bio-based acrylonitrile, the carbon footprint of its production is reduced and companies are prepared for the growing demand for sustainable materials in important business areas such as textiles, automotive and electronics applications.
Challenges
Technological barriers in bio-based production may create a challenge for the market.
Technological hurdles concerned with bio-based production is one of the most notable challenges for acrylonitrile market owing to the fact that, industries are shifting towards sustainable practices. Although fantastic potential exists for bio-based acrylonitrile to mitigate the environmental impact of its current production, manufacturing technologies remain in the developmental stages needed for commercial production. There are multiple technical challenges to address when scaling up bio-based production processes, such as optimizing yields, securing feedstock availability, and establishing cost-competitiveness compared to traditional petrochemical-based methods. Moreover, existing bio-based processes are relatively more expensive due to the high costs involved in R&D, not to mention the infrastructure needed for commercial-scale production. The ability to overcome these technological barriers will play a crucial role in whether or not bio-based acrylonitrile achieves widespread adoption, thus preventing its market disruption and the opportunity to meet increasing demand for sustainable materials.
By Application
Acrylonitrile Butadiene Styrene (ABS) held the largest market share, around 27% in 2023. Due to its good impact resistance properties, high strength, and good processability, ABS is used as raw materials in many fields including automotive parts, consumer electronics, household appliances, and construction materials. ABS is being used extensively in the automotive sector to produce lightweight and strong parts to enhance fuel recurrence and safety. Moreover, the moldability of ABS to complex geometries and its metal and rubber substrate compatibility increases its market share. ABS acceptance has been primarily driven by the increasing need for durable yet inexpensive materials and the growth of manufacturing technologies. ABS has found its way to become largest market share holder in the acrylonitrile market out of excellent traits it provides to industries for manufacturing goods as high demand in consumer products, electronics and automotive sector continue.
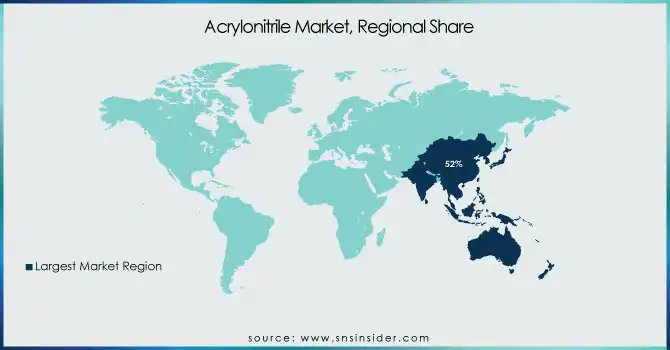
Asia Pacific held the largest market share, around 52% in 2023. It is owing to rapid industrialization, development of manufacturing capabilities, increasing demand from various end-use industries such as automotive, textiles, electronics, and construction for acrylonitrile-based products in the region. Well, because of large-scale manufacturing industries and growing populations the nations noted are some of the largest consumers and producers of acrylonitrile: China, India and Japan. For example, acrylonitrile derivatives, such as acrylonitrile-butadiene-styrenes (ABS) plastics, are used extensively in automotive and electronics industries, which are the main drivers for the segment in the region. In addition, cost-effective production, low labor cost, and proximity to key resources have turned Asia-Pacific into a global chemical cluster. Continued government initiatives in nations like China and India to raise the level of industrialization and the development of infrastructure and urbanization drive the region towards being the leader. This factor, propelled by the rising need for sustainable and innovative solutions, bolsters Asia-Pacific’s competitive edge in the global acrylonitrile market through its investments in research and development.
North America held a significant market share of the acrylonitrile market. The region, specifically the USA, is also where some of the largest acrylonitrile production plants in the world are found, using a well-established chemical industry base. The automotive industry in North America contributes significantly for containing large volume of acrylonitrile-based products such as ABS plastics used for the production of lightweight, highly durable and fuel-efficient car components. The increasing emphasis on innovation and sustainability in the region has also contributed to a rising demand for acrylonitrile derivatives in the high-performance applications market. North America strengthens its market due to a strong chemical industry presence, along with supportive government policies and ongoing R&D investment. Moreover, North America being a market leader with demand for acrylonitrile in textiles, construction, and other industries, is lucrative.
INEOS (Novacryl, Acrylon Ultra)
China Petroleum Development Corp. (CPDC AN, Acrylon Prime)
Asahi Kasei Advance Corp. (Leona AN, Thermyln AN)
Ascend Performance Materials (Trinohex Ultra, Vydyne AN)
Chemelot (ChemoNitril, NitroPlast AN)
Formosa Plastics Corp. (Formonitrile, ForPlas AN)
Mitsubishi Chemical Corp. (Acryrex, Lucite AN)
Secco (SeccoPure, Acrylon Elite)
Taekwang Industrial Co., Ltd. (Taekryl, Taeflex AN)
Sumitomo Chemical Co., Ltd. (Sumikril, AcrylSum)
LG Chem (Lupoy, Lusep AN)
Sinopec (SinoAcrylo, SinoNitril)
SABIC (Vestolen, KSAcryl)
Toray Industries, Inc. (Toraylon, Torelina AN)
Lotte Chemical (LotteNitril, AcryLotte)
Versalis (Vyrtix, Versacryl)
BASF (Ultraform, Bascryl)
AnQore (Econitril, QoreAcryl)
PetroChina Company Limited (PetroNitril, ChinaCryl)
Kumho Petrochemical (KumhoNitril, KumhoFlex)
In 2023, INEOS launched Novacryl, a new range of high-performance acrylonitrile products designed for use in automotive and construction sectors. The company has also expanded its production capacity to meet the growing demand for advanced plastics.
In 2023, Ascend introduced its Vydyne AN product line for applications in advanced automotive composites, capitalizing on the growing trend for lightweight, durable, and energy-efficient materials. This development supports the company’s strategic goal of expanding its market presence in sustainable automotive materials.
Report Attributes | Details |
---|---|
Market Size in 2023 |
USD 12.46 Billion |
Market Size by 2032 |
USD 17.04 Billion |
CAGR |
CAGR of3.54% From 2024 to 2032 |
Base Year |
2023 |
Forecast Period |
2024-2032 |
Historical Data |
2020-2022 |
Report Scope & Coverage |
Market Size, Segments Analysis, Competitive Landscape, Regional Analysis, DROC & SWOT Analysis, Forecast Outlook |
Key Segments |
|
Regional Analysis/Coverage |
North America (US, Canada, Mexico), Europe (Eastern Europe [Poland, Romania, Hungary, Turkey, Rest of Eastern Europe] Western Europe] Germany, France, UK, Italy, Spain, Netherlands, Switzerland, Austria, Rest of Western Europe]), Asia Pacific (China, India, Japan, South Korea, Vietnam, Singapore, Australia, Rest of Asia Pacific), Middle East & Africa (Middle East [UAE, Egypt, Saudi Arabia, Qatar, Rest of Middle East], Africa [Nigeria, South Africa, Rest of Africa], Latin America (Brazil, Argentina, Colombia, Rest of Latin America) |
Company Profiles |
|
Ans: The Acrylonitrile Market was valued at USD 12.46 Billion in 2023.
Ans: The expected CAGR of the global Acrylonitrile Market during the forecast period is 3.54%
Ans: Acrylonitrile Butadiene Styrene (ABS) will grow rapidly in the Acrylonitrile Market from 2024-2032.
Ans: Rising Consumer Demand for Electronics, which drives the market growth.
Ans: Asia Pacific led the Acrylonitrile Market in the region with the highest revenue share in 2023.
1. Introduction
1.1 Market Definition
1.2 Scope (Inclusion and Exclusions)
1.3 Research Assumptions
2. Executive Summary
2.1 Market Overview
2.2 Regional Synopsis
2.3 Competitive Summary
3. Research Methodology
3.1 Top-Down Approach
3.2 Bottom-up Approach
3.3. Data Validation
3.4 Primary Interviews
4. Market Dynamics Impact Analysis
4.1 Market Driving Factors Analysis
4.1.1 Drivers
4.1.2 Restraints
4.1.3 Opportunities
4.1.4 Challenges
4.2 PESTLE Analysis
4.3 Porter’s Five Forces Model
5. Statistical Insights and Trends Reporting
5.1 Production Capacity and Utilization, by Country, by Type, 2023
5.2 Feedstock Prices, by Country, by Type, 2023
5.3 Regulatory Impact, by Country, by Type, 2023.
5.4 Environmental Metrics: Emissions Data, Waste Management Practices, and Sustainability Initiatives, by Region
5.5 Innovation and R&D, by Type, 2023
6. Competitive Landscape
6.1 List of Major Companies, By Region
6.2 Market Share Analysis, By Region
6.3 Product Benchmarking
6.3.1 Product specifications and features
6.3.2 Pricing
6.4 Strategic Initiatives
6.4.1 Marketing and promotional activities
6.4.2 Distribution and supply chain strategies
6.4.3 Expansion plans and new product launches
6.4.4 Strategic partnerships and collaborations
6.5 Technological Advancements
6.6 Market Positioning and Branding
7. Acrylonitrile Market Segmentation, By Application
7.2 Acrylic Fibers
7.2.1 Acrylic Fibers Market Trends Analysis (2020-2032)
7.2.2 Acrylic Fibers Market Size Estimates and Forecasts to 2032 (USD Billion)
7.3 Acrylonitrile Butadiene Styrene (ABS)
7.3.1 Acrylonitrile Butadiene Styrene (ABS) Market Trends Analysis (2020-2032)
7.3.2 Acrylonitrile Butadiene Styrene (ABS) Market Size Estimates and Forecasts to 2032 (USD Billion)
7.4 Adiponitrile
7.4.1 Adiponitrile Market Trends Analysis (2020-2032)
7.4.2 Adiponitrile Market Size Estimates and Forecasts to 2032 (USD Billion)
7.5 Styrene Acrylonitrile Resin (SAR)
7.5.1 Styrene Acrylonitrile Resin (SAR) Market Trends Analysis (2020-2032)
7.5.2 Styrene Acrylonitrile Resin (SAR) Market Size Estimates and Forecasts to 2032 (USD Billion)
7.6 Acrylonitrile Butadiene Rubber
7.6.1 Acrylonitrile Butadiene Rubber Market Trends Analysis (2020-2032)
7.6.2 Acrylonitrile Butadiene Rubber Market Size Estimates and Forecasts to 2032 (USD Billion)
7.7 Carbon Fiber
7.7.1 Carbon Fiber Market Trends Analysis (2020-2032)
7.7.2 Carbon Fiber Market Size Estimates and Forecasts to 2032 (USD Billion)
7.8 Nitrile Rubber
7.8.1 Nitrile Rubber Market Trends Analysis (2020-2032)
7.8.2 Nitrile Rubber Market Size Estimates and Forecasts to 2032 (USD Billion)
7.9 Others
7.9.1 Others Market Trends Analysis (2020-2032)
7.9.2 Others Market Size Estimates and Forecasts to 2032 (USD Billion)
8. Regional Analysis
8.1 Chapter Overview
8.2 North America
8.2.1 Trends Analysis
8.2.2 North America Acrylonitrile Market Estimates and Forecasts, by Country (2020-2032) (USD Billion)
8.2.3 North America Acrylonitrile Market Estimates and Forecasts, by Application (2020-2032) (USD Billion)
8.2.2 USA
8.2.2.1 USA Acrylonitrile Market Estimates and Forecasts, by Application (2020-2032) (USD Billion)
8.2.3 Canada
8.2.3.1 Canada Acrylonitrile Market Estimates and Forecasts, by Application (2020-2032) (USD Billion)
8.2.4 Mexico
8.2.4.1 Mexico Acrylonitrile Market Estimates and Forecasts, by Application (2020-2032) (USD Billion)
8.3 Europe
8.3.1 Eastern Europe
8.3.1.1 Trends Analysis
8.3.1.2 Eastern Europe Acrylonitrile Market Estimates and Forecasts, by Country (2020-2032) (USD Billion)
8.3.1.3 Eastern Europe Acrylonitrile Market Estimates and Forecasts, by Application (2020-2032) (USD Billion)
8.3.1.4 Poland
8.3.1.4.1 Poland Acrylonitrile Market Estimates and Forecasts, by Application (2020-2032) (USD Billion)
8.3.1.5 Romania
8.3.1.5.1 Romania Acrylonitrile Market Estimates and Forecasts, by Application (2020-2032) (USD Billion)
8.3.1.6 Hungary
10.3.1.8.1 Hungary Acrylonitrile Market Estimates and Forecasts, by Application (2020-2032) (USD Billion)
8.3.1.7 Turkey
8.3.1.7.1 Turkey Acrylonitrile Market Estimates and Forecasts, by Application (2020-2032) (USD Billion)
8.3.1.8 Rest of Eastern Europe
8.3.1.8.1 Rest of Eastern Europe Acrylonitrile Market Estimates and Forecasts, by Application (2020-2032) (USD Billion)
8.3.2 Western Europe
8.3.2.1 Trends Analysis
8.3.2.2 Western Europe Acrylonitrile Market Estimates and Forecasts, by Country (2020-2032) (USD Billion)
8.3.2.3 Western Europe Acrylonitrile Market Estimates and Forecasts, by Application (2020-2032) (USD Billion)
8.3.2.4 Germany
8.3.2.4.1 Germany Acrylonitrile Market Estimates and Forecasts, by Application (2020-2032) (USD Billion)
8.3.2.5 France
8.3.2.5.1 France Acrylonitrile Market Estimates and Forecasts, by Application (2020-2032) (USD Billion)
8.3.2.6 UK
8.3.2.6.1 UK Acrylonitrile Market Estimates and Forecasts, by Application (2020-2032) (USD Billion)
8.3.2.7 Italy
8.3.2.7.1 Italy Acrylonitrile Market Estimates and Forecasts, by Application (2020-2032) (USD Billion)
8.3.2.8 Spain
8.3.2.8.1 Spain Acrylonitrile Market Estimates and Forecasts, by Application (2020-2032) (USD Billion)
8.3.2.9 Netherlands
8.3.2.9.1 Netherlands Acrylonitrile Market Estimates and Forecasts, by Application (2020-2032) (USD Billion)
8.3.2.10 Switzerland
8.3.2.10.1 Switzerland Acrylonitrile Market Estimates and Forecasts, by Application (2020-2032) (USD Billion)
8.3.2.11 Austria
8.3.2.11.1 Austria Acrylonitrile Market Estimates and Forecasts, by Application (2020-2032) (USD Billion)
8.3.2.12 Rest of Western Europe
8.3.2.12.1 Rest of Western Europe Acrylonitrile Market Estimates and Forecasts, by Application (2020-2032) (USD Billion)
8.4 Asia-Pacific
8.4.1 Trends Analysis
8.4.2 Asia-Pacific Acrylonitrile Market Estimates and Forecasts, by Country (2020-2032) (USD Billion)
8.4.3 Asia-Pacific Acrylonitrile Market Estimates and Forecasts, by Application (2020-2032) (USD Billion)
8.4.4 China
8.4.4.1 China Acrylonitrile Market Estimates and Forecasts, by Application (2020-2032) (USD Billion)
8.4.5 India
8.4.5.1 India Acrylonitrile Market Estimates and Forecasts, by Application (2020-2032) (USD Billion)
8.4.6 Japan
8.4.6.1 Japan Acrylonitrile Market Estimates and Forecasts, by Application (2020-2032) (USD Billion)
8.4.7 South Korea
8.4.7.1 South Korea Acrylonitrile Market Estimates and Forecasts, by Application (2020-2032) (USD Billion)
8.4.8 Vietnam
8.4.8.1 Vietnam Acrylonitrile Market Estimates and Forecasts, by Application (2020-2032) (USD Billion)
8.4.9 Singapore
8.4.9.1 Singapore Acrylonitrile Market Estimates and Forecasts, by Application (2020-2032) (USD Billion)
8.4.10 Australia
8.4.10.1 Australia Acrylonitrile Market Estimates and Forecasts, by Application (2020-2032) (USD Billion)
8.4.11 Rest of Asia-Pacific
8.4.11.1 Rest of Asia-Pacific Acrylonitrile Market Estimates and Forecasts, by Application (2020-2032) (USD Billion)
8.5 Middle East and Africa
8.5.1 Middle East
8.5.1.1 Trends Analysis
8.5.1.2 Middle East Acrylonitrile Market Estimates and Forecasts, by Country (2020-2032) (USD Billion)
10.5.1.3 Middle East Acrylonitrile Market Estimates and Forecasts, by Application (2020-2032) (USD Billion)
8.5.1.4 UAE
8.5.1.4.1 UAE Acrylonitrile Market Estimates and Forecasts, by Application (2020-2032) (USD Billion)
8.5.1.5 Egypt
8.5.1.5.1 Egypt Acrylonitrile Market Estimates and Forecasts, by Application (2020-2032) (USD Billion)
8.5.1.6 Saudi Arabia
8.5.1.6.1 Saudi Arabia Acrylonitrile Market Estimates and Forecasts, by Application (2020-2032) (USD Billion)
8.5.1.7 Qatar
8.5.1.7.1 Qatar Acrylonitrile Market Estimates and Forecasts, by Application (2020-2032) (USD Billion)
8.5.1.8 Rest of Middle East
8.5.1.8.1 Rest of Middle East Acrylonitrile Market Estimates and Forecasts, by Application (2020-2032) (USD Billion)
8.5.2 Africa
8.5.2.1 Trends Analysis
8.5.2.2 Africa Acrylonitrile Market Estimates and Forecasts, by Country (2020-2032) (USD Billion)
8.5.2.3 Africa Acrylonitrile Market Estimates and Forecasts, by Application (2020-2032) (USD Billion)
8.5.2.4 South Africa
8.5.2.4.1 South Africa Acrylonitrile Market Estimates and Forecasts, by Application (2020-2032) (USD Billion)
8.5.2.5 Nigeria
8.5.2.5.1 Nigeria Acrylonitrile Market Estimates and Forecasts, by Application (2020-2032) (USD Billion)
8.5.2.6 Rest of Africa
8.5.2.6.1 Rest of Africa Acrylonitrile Market Estimates and Forecasts, by Application (2020-2032) (USD Billion)
8.6 Latin America
8.6.1 Trends Analysis
8.6.2 Latin America Acrylonitrile Market Estimates and Forecasts, by Country (2020-2032) (USD Billion)
8.6.3 Latin America Acrylonitrile Market Estimates and Forecasts, by Application (2020-2032) (USD Billion)
8.6.4 Brazil
8.6.4.1 Brazil Acrylonitrile Market Estimates and Forecasts, by Application (2020-2032) (USD Billion)
8.6.5 Argentina
8.6.5.1 Argentina Acrylonitrile Market Estimates and Forecasts, by Application (2020-2032) (USD Billion)
8.6.6 Colombia
8.6.6.1 Colombia Acrylonitrile Market Estimates and Forecasts, by Application (2020-2032) (USD Billion)
8.6.7 Rest of Latin America
8.6.7.1 Rest of Latin America Acrylonitrile Market Estimates and Forecasts, by Application (2020-2032) (USD Billion)
9. Company Profiles
9.1 INEOS
9.1.1 Company Overview
9.1.2 Financial
9.1.3 Products/ Services Offered
9.1.4 SWOT Analysis
9.2 China Petroleum Development Corp.
9.2.1 Company Overview
9.2.2 Financial
9.2.3 Products/ Services Offered
9.2.4 SWOT Analysis
9.3 Asahi Kasei Advance Corp.
9.3.1 Company Overview
9.3.2 Financial
9.3.3 Products/ Services Offered
9.3.4 SWOT Analysis
9.4 Ascend Performance Materials
9.4.1 Company Overview
9.4.2 Financial
9.4.3 Products/ Services Offered
9.4.4 SWOT Analysis
9.5 Chemelot
9.5.1 Company Overview
9.5.2 Financial
9.5.3 Products/ Services Offered
9.5.4 SWOT Analysis
9.6 Formosa Plastics Corp.
9.6.1 Company Overview
9.6.2 Financial
9.6.3 Products/ Services Offered
9.6.4 SWOT Analysis
9.7 Mitsubishi Chemical Corp.
9.7.1 Company Overview
9.7.2 Financial
9.7.3 Products/ Services Offered
9.7.4 SWOT Analysis
9.8 Taekwang Industrial Co., Ltd.
9.8.1 Company Overview
9.8.2 Financial
9.8.3 Products/ Services Offered
9.8.4 SWOT Analysis
9.9 Sumitomo Chemical Co., Ltd.
9.9.1 Company Overview
9.9.2 Financial
9.9.3 Products/ Services Offered
9.9.4 SWOT Analysis
9.10 LG Chem
9.10.1 Company Overview
9.10.2 Financial
9.10.3 Products/ Services Offered
9.10.4 SWOT Analysis
10. Use Cases and Best Practices
11. Conclusion
An accurate research report requires proper strategizing as well as implementation. There are multiple factors involved in the completion of good and accurate research report and selecting the best methodology to compete the research is the toughest part. Since the research reports we provide play a crucial role in any company’s decision-making process, therefore we at SNS Insider always believe that we should choose the best method which gives us results closer to reality. This allows us to reach at a stage wherein we can provide our clients best and accurate investment to output ratio.
Each report that we prepare takes a timeframe of 350-400 business hours for production. Starting from the selection of titles through a couple of in-depth brain storming session to the final QC process before uploading our titles on our website we dedicate around 350 working hours. The titles are selected based on their current market cap and the foreseen CAGR and growth.
The 5 steps process:
Step 1: Secondary Research:
Secondary Research or Desk Research is as the name suggests is a research process wherein, we collect data through the readily available information. In this process we use various paid and unpaid databases which our team has access to and gather data through the same. This includes examining of listed companies’ annual reports, Journals, SEC filling etc. Apart from this our team has access to various associations across the globe across different industries. Lastly, we have exchange relationships with various university as well as individual libraries.
Step 2: Primary Research
When we talk about primary research, it is a type of study in which the researchers collect relevant data samples directly, rather than relying on previously collected data. This type of research is focused on gaining content specific facts that can be sued to solve specific problems. Since the collected data is fresh and first hand therefore it makes the study more accurate and genuine.
We at SNS Insider have divided Primary Research into 2 parts.
Part 1 wherein we interview the KOLs of major players as well as the upcoming ones across various geographic regions. This allows us to have their view over the market scenario and acts as an important tool to come closer to the accurate market numbers. As many as 45 paid and unpaid primary interviews are taken from both the demand and supply side of the industry to make sure we land at an accurate judgement and analysis of the market.
This step involves the triangulation of data wherein our team analyses the interview transcripts, online survey responses and observation of on filed participants. The below mentioned chart should give a better understanding of the part 1 of the primary interview.
Part 2: In this part of primary research the data collected via secondary research and the part 1 of the primary research is validated with the interviews from individual consultants and subject matter experts.
Consultants are those set of people who have at least 12 years of experience and expertise within the industry whereas Subject Matter Experts are those with at least 15 years of experience behind their back within the same space. The data with the help of two main processes i.e., FGDs (Focused Group Discussions) and IDs (Individual Discussions). This gives us a 3rd party nonbiased primary view of the market scenario making it a more dependable one while collation of the data pointers.
Step 3: Data Bank Validation
Once all the information is collected via primary and secondary sources, we run that information for data validation. At our intelligence centre our research heads track a lot of information related to the market which includes the quarterly reports, the daily stock prices, and other relevant information. Our data bank server gets updated every fortnight and that is how the information which we collected using our primary and secondary information is revalidated in real time.
Step 4: QA/QC Process
After all the data collection and validation our team does a final level of quality check and quality assurance to get rid of any unwanted or undesired mistakes. This might include but not limited to getting rid of the any typos, duplication of numbers or missing of any important information. The people involved in this process include technical content writers, research heads and graphics people. Once this process is completed the title gets uploader on our platform for our clients to read it.
Step 5: Final QC/QA Process:
This is the last process and comes when the client has ordered the study. In this process a final QA/QC is done before the study is emailed to the client. Since we believe in giving our clients a good experience of our research studies, therefore, to make sure that we do not lack at our end in any way humanly possible we do a final round of quality check and then dispatch the study to the client.
By Application
Acrylic Fibers
Acrylonitrile Butadiene Styrene (ABS)
Adiponitrile
Styrene Acrylonitrile Resin (SAR)
Acrylonitrile Butadiene Rubber
Carbon Fiber
Nitrile Rubber
Others
Request for Segment Customization as per your Business Requirement: Segment Customization Request
Regional Coverage:
North America
US
Canada
Mexico
Europe
Eastern Europe
Poland
Romania
Hungary
Turkey
Rest of Eastern Europe
Western Europe
Germany
France
UK
Italy
Spain
Netherlands
Switzerland
Austria
Rest of Western Europe
Asia Pacific
China
India
Japan
South Korea
Vietnam
Singapore
Australia
Rest of Asia Pacific
Middle East & Africa
Middle East
UAE
Egypt
Saudi Arabia
Qatar
Rest of Middle East
Africa
Nigeria
South Africa
Rest of Africa
Latin America
Brazil
Argentina
Colombia
Rest of Latin America
Request for Country Level Research Report: Country Level Customization Request
Available Customization
With the given market data, SNS Insider offers customization as per the company’s specific needs. The following customization options are available for the report:
Product Analysis
Criss-Cross segment analysis (e.g. Product X Application)
Product Matrix which gives a detailed comparison of the product portfolio of each company
Geographic Analysis
Additional countries in any of the regions
Company Information
Detailed analysis and profiling of additional market players (Up to five)
The Argon Market Size was valued at USD 19.02 Billion in 2023 and is expected to reach USD 34.97 Billion by 2032, growing at a CAGR of 7.00% over the forecast period of 2024-2032.
The UV-Curable Coatings Market size was USD 8.21 Billion in 2023 and is expected to reach USD 20.94 Billion by 2032 and grow at a CAGR of 10.97 % over the forecast period of 2024-2032.
The Prepreg Market Size was valued at USD 8.81 billion in 2023, and is expected to reach USD 21.63 billion by 2032, and grow at a CAGR of 10.5% by 2024-2032
The Nickel Mining Market size was valued at USD 51.90 billion in 2023 and is expected to reach USD 92.02 billion by 2032, growing at a CAGR of 6.60% over the forecast period 2024-2032.
The Silane and Silicone Market size was USD 19.9 billion in 2023 and is expected to reach USD 32.4 billion by 2032 and grow at a CAGR of 5.5% over the forecast period of 2024-2032.
Bio-Based Chemicals Market was valued at USD 70.5 Billion in 2023 and is anticipated to touch USD 167.6 Billion by 2032, at a CAGR of 10.1% from 2024 to 2032.
Hi! Click one of our member below to chat on Phone