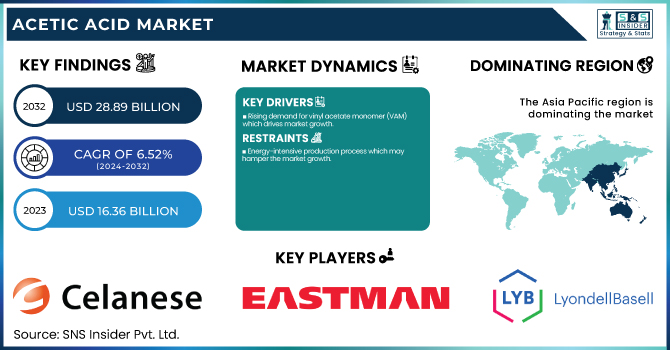
The Acetic Acid Market size was USD 16.36 Billion in 2023 and is expected to reach USD 28.89 Billion by 2032 and grow at a CAGR of 6.52% over the forecast period of 2024-2032. This report provides comprehensive statistical insights and trends in the acetic acid market, covering key aspects such as global production capacity and utilization rates by country and type in 2023, along with feedstock price fluctuations, particularly for methanol and carbon monoxide. It examines the regulatory landscape, including environmental policies in major regions, and evaluates sustainability initiatives, such as carbon emissions, waste management, and bio-based acetic acid developments. Additionally, the report highlights R&D advancements in low-carbon production technologies and assesses the growing demand for acetic acid derivatives, particularly VAM, PTA, and acetic anhydride, across major industries and regions.
To Get more information on Acetic Acid Market - Request Free Sample Report
Drivers
Rising demand for vinyl acetate monomer (VAM) which drives market growth.
The increase in demand for Vinyl Acetate Monomer (VAM) is an essential driving force for the acetic acid market since VAM is one of the major derivatives of acetic acid utilized mainly in adhesives, paints & coatings, textiles, and packaging films. Global surges in construction & automotive activities are creating demand for water-based paints and coatings that VAM (vinyl acetate monomer) assists. Moreover, the rise of the packaging industry, especially in Asia-Pacific, is increasing the polyvinyl acetate (PVA) and ethylene-vinyl acetate (EVA) copolymers consumption that need VAM for production. Demand for VAM is forecasted to increase directly from the consumption of acetic acid, driven by sustainability initiatives that encourage adhesion in water-based and low-VOC formulations.
Energy-intensive production process which may hamper the market growth.
One of the major challenges hindering the growth of the global market is the high energy-intensive manufacturing process of acetic acid. The production process especially the methanol carbonylation process employs high temperature and high-pressure conditions during the manufacturing process hence consuming a large amount of energy. In maintaining consistent production with rising global energy prices and rising carbon footprint concerns, production costs have inflated which has limited the profitability of the manufacturers These production methods, which include bio-based acetic acid, could drive considerable change toward sustainable and energy-efficient practices, but are still relatively in their infancy and face high costs and challenges around scalability for a quick transition among companies. The energy-intensive nature of acetic acid production consequently continues to hold a key restraint to the expansion of the market.
Growth in purified terephthalic acid (PTA) production creates an opportunity in the market.
With the increase in purified terephthalic acid (PTA) production, there arises a ripe opportunity for the acetic acid market as acetic acid is a raw material required for the production of PTA. PTA finds extensive application for the production of polyethylene terephthalate (PET) resins and polyester fibers which are expected to create a strong demand in the textiles, packaging, and beverage bottling industries. With increasing demand for light-weight, recyclable, and sustainable packaging there has been tremendous growth in the consumption of PET bottles and containers, which is expected to propel PTA production, especially in Asia-Pacific where the PET footprint is being built at a large scale in China and India. Furthermore, high investments in sustainable polyester production and bio-based PTA development are expected to generate further growth opportunities for market players in terms of acetic acid.
Supply chain disruptions and logistics constraints may challenge the market growth.
Supply chain disruptions and logistics constraints prove to be a major hamper to the acetic acid market affecting production, pricing, and availability. Supply shortfalls along with higher freight prices have been driven by factors including geopolitical tensions, trade restrictions, and congestion of transportation routes. The global chemical supply chains have been directly impacted due to the Russia-Ukraine conflict, which has hampered raw material procurement. Further, port delays at major exporting hubs such as China and restrictions on the transport of hazardous chemicals added to a wider supply chain disruption. Apart, these disruptions cause price fluctuations and also delay the delivery to end-use industries, which in turn hamper the demand for acetic acid derivatives including vinyl acetate monomer (VAM), purified terephthalic acid (PTA), and acetate esters. Solutions to these challenges will involve securing raw materials strategically, diversifying production regions, managing inventories, and enhancing the stability of markets to reduce risks.
By Application
Vinyl Acetate Monomer held the largest market share around 38% in 2023. This is owing to its large-scale consumption in high-volume applications like adhesives, paints & coatings, fabrics, and packaging films. VAM is also a major feedstock employed in manufacturing polyvinyl acetate (PVA), polyvinyl alcohol (PVOH), and copolymers of ethylene-vinyl acetate (EVA), which find widespread applications in construction, automotive and packaging sectors. There has been a very large account of demand from the booming construction sector, especially in emerging economies such as China, India, and Southeast Asia, that is using VAM as a vital ingredient in water-based adhesives and coatings. Furthermore, an increasing inclination toward sustainable low VOC (Volatile Organic Compound) adhesives and paints is expected to fuel the demand for VAM.
By End Use Industry
Plastics & Polymers held the largest market share around 38% in 2023. Due to the high usage of derivatives of acetic acid, in the acetic acid market. VAM is an important intermediate in the manufacturing of polyvinyl acetate (PVA) and ethylene-vinyl acetate (EVA) copolymers which are used in various end-use industries including adhesives, coatings, and flexible packaging. On the other hand, another key derivative PT, is a necessary raw material for petrochemicals such as polyethylene terephthalate (PET), widely adorned in packaging materials, textile, and beverage bottles. Now, rising international demand for eco-friendly and lightweight plastic packaging, primarily from the food & beverage and e-commerce sectors, has considerably increased the uptake of such polymers. The increasing use of EVA among solar panel encapsulations, footwear, and medical applications has also further contributed to the growth of the Plastics & Polymers segment. This segment is likely to retain its dominance in the acetic acid market owing to the ongoing development of bio-based polymers and recyclable plastics.
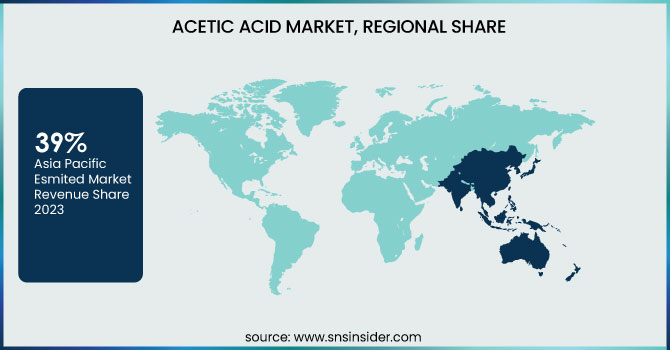
Asia Pacific held the largest market share around 39% in 2023. Due to their strong industrial base, production capacity, and demand for key end-use industries such as plastics & polymers industry, textiles, pharmaceuticals, and food & beverage, the Asia Pacific region has captured the highest share in the acetic acid with increasing growth in recent years. China, India, and Japan account for the biggest markets for acetic acid in the world, the with around fifty percent of the entire global acetic acid supply coming from China, with extensive facilities for manufacturing acetic acid, and good availability of feedstock. High demand for vinyl acetate monomer (VAM) in adhesives, paints and coatings has been fueled by the expanding construction and automotive industries in the region, along with the growing demand for acetate-based fibers propelled by the rapidly growing textile sector. Moreover, the region dominates in terms of purified terephthalic acid (PTA) which is a chemical essential for manufacturing polyester and PET, which in turn drives acetic acid consumption. Additionally, increasing demand for flexible packaging, solar panel encapsulation (EVA), and bio-based chemicals coupled with government initiatives promoting industrial growth and foreign investments have propelled the Asia Pacific to maintain its global acetic acid market leadership.
North America held a significant market share in 2023. High demand from end-use industries such as plastics & polymers, pharmaceuticals, and food & beverage coupled with a well-established chemical industry and manufacturing technologies, are the factors driving the acetic acid market in North America region accounted for a significant share of the market. The stable supply of raw materials within this region, namely methanol- a key feedstock for acetic acid-, with the country being one of the largest producers of methanol with natural gas as a feedstock further promotes market growth. Further boosting market growth is the increasing use of vinyl acetate monomer (VAM) in adhesives, paints & coatings, and flexible packaging. Moreover, the growing use of purified terephthalic acid (PTA) for the manufacturing of PET bottles and polyesters fiber, and emerging applications for pharmaceuticals and food preservatives has boosted the acetic acid market. North America has maintained its position in the market due to the presence of leading chemical manufacturers, investments in R&D of sustainable production technology, and stringent regulations favoring bio-based substitutes over fossil-fuel-based acetic acid production processes.
Get Customized Report as per Your Business Requirement - Enquiry Now
Key Players
Celanese Corporation (Acetic Acid, Vinyl Acetate Monomer)
Eastman Chemical Company (Acetic Anhydride, Cellulose Esters)
LyondellBasell Industries Holdings B.V. (Polypropylene, Advanced Polyolefins)
SABIC (Chemicals, Polymers)
HELM AG (Chemical Feedstocks, Crop Protection Products)
Indian Oil Corporation Ltd. (Petroleum Products, Petrochemicals)
Gujarat Narmada Valley Fertilizers & Chemicals Limited (Fertilizers, Chemicals)
DAICEL CORPORATION (Cellulose Acetate, Organic Chemicals)
Dow (Chemicals, Plastics)
INEOS (Petrochemicals, Specialty Chemicals)
Jiangsu Sopo (Group) Co., Ltd. (Glacial Acetic Acid, Vinyl Acetate)
Mitsubishi Chemical Corporation (Chemicals, Performance Products)
Wacker Chemie AG (Silicones, Polymers)
Chang Chun Group (Petrochemicals, Electronic Chemicals)
Kingboard Holdings Limited (Laminates, Chemicals)
Shandong Hualu-Hengsheng Chemical Co., Ltd. (Methanol, Urea)
Yankuang Group (Coal Chemicals, Methanol)
Shanghai Huayi (Group) Company (Chemicals, Plastics)
BP (Energy Products, Chemicals)
PetroChina (Petroleum Products, Petrochemicals)
Recent Development:
In September 2023, INEOS announced an agreement to acquire Eastman Chemical Company's Texas City site. This facility includes an acetic acid plant with a production capacity of 600 kilotons per year. The acquisition aims to strengthen INEOS’s position in the global acetic acid market by expanding its manufacturing capabilities.
In March 2023, Eastman successfully expanded its acetic acid production facility in Kingsport, Tennessee. This expansion increased the plant's capacity by 50%, enhancing its production capabilities.
| Report Attributes | Details |
|---|---|
| Market Size in 2023 | USD 16.36 Billion |
| Market Size by 2032 | USD 28.89 Billion |
| CAGR | CAGR of 6.52% From 2024 to 2032 |
| Base Year | 2023 |
| Forecast Period | 2024-2032 |
| Historical Data | 2020-2022 |
| Report Scope & Coverage | Market Size, Segments Analysis, Competitive Landscape, Regional Analysis, DROC & SWOT Analysis, Forecast Outlook |
| Key Segments | • By Application (Vinyl Acetate Monomer, Acetic Anhydride, Acetate Esters, Purified Terephthalic Acid, Ethanol, Others) •By End User Industry (Food and beverages, Paints and coating, Plastics & Polymers, Pharmaceutical, Chemicals, Others) |
| Regional Analysis/Coverage | North America (US, Canada, Mexico), Europe (Eastern Europe [Poland, Romania, Hungary, Turkey, Rest of Eastern Europe] Western Europe] Germany, France, UK, Italy, Spain, Netherlands, Switzerland, Austria, Rest of Western Europe]), Asia Pacific (China, India, Japan, South Korea, Vietnam, Singapore, Australia, Rest of Asia Pacific), Middle East & Africa (Middle East [UAE, Egypt, Saudi Arabia, Qatar, Rest of Middle East], Africa [Nigeria, South Africa, Rest of Africa], Latin America (Brazil, Argentina, Colombia, Rest of Latin America) |
| Company Profiles | Celanese Corporation, Eastman Chemical Company, LyondellBasell Industries Holdings B.V., SABIC, HELM AG, Indian Oil Corporation Ltd., Gujarat Narmada Valley Fertilizers & Chemicals Limited, DAICEL CORPORATION, Dow, INEOS, Jiangsu Sopo (Group) Co., Ltd., Mitsubishi Chemical Corporation, Wacker Chemie AG, Chang Chun Group, Kingboard Holdings Limited, Shandong Hualu-Hengsheng Chemical Co., Ltd., Yankuang Group, Shanghai Huayi (Group) Company, BP, PetroChina |
Ans: The Acetic Acid Market was valued at USD 16.36 Billion in 2023.
Ans: The expected CAGR of the global Acetic Acid Market during the forecast period is 6.52%
Ans: Plastics & Polymers will grow rapidly in the Acetic Acid Market from 2024-2032.
Ans: Rising demand for vinyl acetate monomer (VAM) which drives market growth.
Ans: Asia Pacific led the Acetic Acid Market in the region with the highest revenue share in 2023.
Table of Contents:
1. Introduction
1.1 Market Definition
1.2 Scope (Inclusion and Exclusions)
1.3 Research Assumptions
2. Executive Summary
2.1 Market Overview
2.2 Regional Synopsis
2.3 Competitive Summary
3. Research Methodology
3.1 Top-Down Approach
3.2 Bottom-up Approach
3.3. Data Validation
3.4 Primary Interviews
4. Market Dynamics Impact Analysis
4.1 Market Driving Factors Analysis
4.1.2 Drivers
4.1.2 Restraints
4.1.3 Opportunities
4.1.4 Challenges
4.2 PESTLE Analysis
4.3 Porter’s Five Forces Model
5. Statistical Insights and Trends Reporting
5.1 Production Capacity and Utilization, by Country, By Type, 2023
5.2 Feedstock Prices, by Country, By Type, 2023
5.3 Regulatory Impact, by Country, By Type 2023.
5.4 Environmental Metrics: Emissions Data, Waste Management Practices, and Sustainability Initiatives, by Region
5.5 Innovation and R&D, Type, 2023
6. Competitive Landscape
6.1 List of Major Companies, By Region
6.2 Market Share Analysis, By Region
6.3 Product Benchmarking
6.3.1 Product specifications and features
6.3.2 Pricing
6.4 Strategic Initiatives
6.4.1 Marketing and promotional activities
6.4.2 Distribution and Supply Chain Strategies
6.4.3 Expansion Plans and New Product Launches
6.4.4 Strategic partnerships and collaborations
6.5 Technological Advancements
6.6 Market Positioning and Branding
7. Acetic Acid Market Segmentation, By Application
7.1 Chapter Overview
7.2 Vinyl Acetate Monomer
7.2.1 Vinyl Acetate Monomer Trends Analysis (2020-2032)
7.2.2 Vinyl Acetate Monomer Market Size Estimates and Forecasts to 2032 (USD Billion)
7.3 Acetic Anhydride
7.3.1 Acetic Anhydride Market Trends Analysis (2020-2032)
7.3.2 Acetic Anhydride Market Size Estimates and Forecasts to 2032 (USD Billion)
7.4 Acetate Esters
7.4.1 Acetate Esters Trends Analysis (2020-2032)
7.4.2 Acetate Esters Market Size Estimates and Forecasts to 2032 (USD Billion)
7.5 Purified Terephthalic Acid
7.5.1 Purified Terephthalic Acid Market Trends Analysis (2020-2032)
7.5.2 Purified Terephthalic Acid Market Size Estimates and Forecasts to 2032 (USD Billion)
7.6 Ethanol
7.6.1 Ethanol Market Trends Analysis (2020-2032)
7.6.2 Ethanol Market Size Estimates and Forecasts to 2032 (USD Billion)
7.7 Others
7.7.1 Others Market Trends Analysis (2020-2032)
7.7.2 Others Market Size Estimates and Forecasts to 2032 (USD Billion)
8. Acetic Acid Market Segmentation, By End-Use Industry
8.1 Chapter Overview
8.2 Food and Beverages
8.2.1 Food and Beverages Market Trends Analysis (2020-2032)
8.2.2 Food and Beverages Market Size Estimates and Forecasts to 2032 (USD Billion)
8.3 Paints and Coating
8.3.1 Paints and Coating Market Trends Analysis (2020-2032)
8.3.2 Paints and Coating Market Size Estimates and Forecasts to 2032 (USD Billion)
8.4 Plastics & Polymers
8.4.1 Plastics & Polymers Market Trends Analysis (2020-2032)
8.4.2 Plastics & Polymers Market Size Estimates and Forecasts to 2032 (USD Billion)
8.5 Pharmaceutical
8.5.1 Pharmaceutical Market Trends Analysis (2020-2032)
8.5.2 Pharmaceutical Market Size Estimates and Forecasts to 2032 (USD Billion)
8.6 Chemicals
8.6.1 Chemicals Market Trends Analysis (2020-2032)
8.6.2 Chemicals Market Size Estimates and Forecasts to 2032 (USD Billion)
8.7 Others
8.7.1 Others Market Trends Analysis (2020-2032)
8.7.2 Others Market Size Estimates and Forecasts to 2032 (USD Billion)
9. Regional Analysis
9.1 Chapter Overview
9.2 North America
9.2.1 Trends Analysis
9.2.2 North America Acetic Acid Market Estimates and Forecasts, by Country (2020-2032) (USD Billion)
9.2.3 North America Acetic Acid Market Estimates and Forecasts, By Application (2020-2032) (USD Billion)
9.2.4 North America Acetic Acid Market Estimates and Forecasts, By End-Use Industry (2020-2032) (USD Billion)
9.2.5 USA
9.2.5.1 USA Acetic Acid Market Estimates and Forecasts, By Application (2020-2032) (USD Billion)
9.2.5.2 USA Acetic Acid Market Estimates and Forecasts, By End-Use Industry (2020-2032) (USD Billion)
9.2.6 Canada
9.2.6.1 Canada Acetic Acid Market Estimates and Forecasts, By Application (2020-2032) (USD Billion)
9.2.6.2 Canada Acetic Acid Market Estimates and Forecasts, By End-Use Industry (2020-2032) (USD Billion)
9.2.7 Mexico
9.2.7.1 Mexico Acetic Acid Market Estimates and Forecasts, By Application (2020-2032) (USD Billion)
9.2.7.2 Mexico Acetic Acid Market Estimates and Forecasts, By End-Use Industry (2020-2032) (USD Billion)
9.3 Europe
9.3.1 Eastern Europe
9.3.1.1 Trends Analysis
9.3.1.2 Eastern Europe Acetic Acid Market Estimates and Forecasts, by Country (2020-2032) (USD Billion)
9.3.1.3 Eastern Europe Acetic Acid Market Estimates and Forecasts, By Application (2020-2032) (USD Billion)
9.3.1.4 Eastern Europe Acetic Acid Market Estimates and Forecasts, By End-Use Industry (2020-2032) (USD Billion)
9.3.1.5 Poland
9.3.1.5.1 Poland Acetic Acid Market Estimates and Forecasts, By Application (2020-2032) (USD Billion)
9.3.1.5.2 Poland Acetic Acid Market Estimates and Forecasts, By End-Use Industry (2020-2032) (USD Billion)
9.3.1.6 Romania
9.3.1.6.1 Romania Acetic Acid Market Estimates and Forecasts, By Application (2020-2032) (USD Billion)
9.3.1.6.2 Romania Acetic Acid Market Estimates and Forecasts, By End-Use Industry (2020-2032) (USD Billion)
9.3.1.7 Hungary
9.3.1.7.1 Hungary Acetic Acid Market Estimates and Forecasts, By Application (2020-2032) (USD Billion)
9.3.1.7.2 Hungary Acetic Acid Market Estimates and Forecasts, By End-Use Industry (2020-2032) (USD Billion)
9.3.1.8 Turkey
9.3.1.8.1 Turkey Acetic Acid Market Estimates and Forecasts, By Application (2020-2032) (USD Billion)
9.3.1.8.2 Turkey Acetic Acid Market Estimates and Forecasts, By End-Use Industry (2020-2032) (USD Billion)
9.3.1.9 Rest of Eastern Europe
9.3.1.9.1 Rest of Eastern Europe Acetic Acid Market Estimates and Forecasts, By Application (2020-2032) (USD Billion)
9.3.1.9.2 Rest of Eastern Europe Acetic Acid Market Estimates and Forecasts, By End-Use Industry (2020-2032) (USD Billion)
9.3.2 Western Europe
9.3.2.1 Trends Analysis
9.3.2.2 Western Europe Acetic Acid Market Estimates and Forecasts, by Country (2020-2032) (USD Billion)
9.3.2.3 Western Europe Acetic Acid Market Estimates and Forecasts, By Application (2020-2032) (USD Billion)
9.3.2.4 Western Europe Acetic Acid Market Estimates and Forecasts, By End-Use Industry (2020-2032) (USD Billion)
9.3.2.5 Germany
9.3.2.5.1 Germany Acetic Acid Market Estimates and Forecasts, By Application (2020-2032) (USD Billion)
9.3.2.5.2 Germany Acetic Acid Market Estimates and Forecasts, By End-Use Industry (2020-2032) (USD Billion)
9.3.2.6 France
9.3.2.6.1 France Acetic Acid Market Estimates and Forecasts, By Application (2020-2032) (USD Billion)
9.3.2.6.2 France Acetic Acid Market Estimates and Forecasts, By End-Use Industry (2020-2032) (USD Billion)
9.3.2.7 UK
9.3.2.7.1 UK Acetic Acid Market Estimates and Forecasts, By Application (2020-2032) (USD Billion)
9.3.2.7.2 UK Acetic Acid Market Estimates and Forecasts, By End-Use Industry (2020-2032) (USD Billion)
9.3.2.8 Italy
9.3.2.8.1 Italy Acetic Acid Market Estimates and Forecasts, By Application (2020-2032) (USD Billion)
9.3.2.8.2 Italy Acetic Acid Market Estimates and Forecasts, By End-Use Industry (2020-2032) (USD Billion)
9.3.2.9 Spain
9.3.2.9.1 Spain Acetic Acid Market Estimates and Forecasts, By Application (2020-2032) (USD Billion)
9.3.2.9.2 Spain Acetic Acid Market Estimates and Forecasts, By End-Use Industry (2020-2032) (USD Billion)
9.3.2.10 Netherlands
9.3.2.10.1 Netherlands Acetic Acid Market Estimates and Forecasts, By Application (2020-2032) (USD Billion)
9.3.2.10.2 Netherlands Acetic Acid Market Estimates and Forecasts, By End-Use Industry (2020-2032) (USD Billion)
9.3.2.11 Switzerland
9.3.2.11.1 Switzerland Acetic Acid Market Estimates and Forecasts, By Application (2020-2032) (USD Billion)
9.3.2.11.2 Switzerland Acetic Acid Market Estimates and Forecasts, By End-Use Industry (2020-2032) (USD Billion)
9.3.2.12 Austria
9.3.2.12.1 Austria Acetic Acid Market Estimates and Forecasts, By Application (2020-2032) (USD Billion)
9.3.2.12.2 Austria Acetic Acid Market Estimates and Forecasts, By End-Use Industry (2020-2032) (USD Billion)
9.3.2.13 Rest of Western Europe
9.3.2.13.1 Rest of Western Europe Acetic Acid Market Estimates and Forecasts, By Application (2020-2032) (USD Billion)
9.3.2.13.2 Rest of Western Europe Acetic Acid Market Estimates and Forecasts, By End-Use Industry (2020-2032) (USD Billion)
9.4 Asia Pacific
9.4.1 Trends Analysis
9.4.2 Asia Pacific Acetic Acid Market Estimates and Forecasts, by Country (2020-2032) (USD Billion)
9.4.3 Asia Pacific Acetic Acid Market Estimates and Forecasts, By Application (2020-2032) (USD Billion)
9.4.4 Asia Pacific Acetic Acid Market Estimates and Forecasts, By End-Use Industry (2020-2032) (USD Billion)
9.4.5 China
9.4.5.1 China Acetic Acid Market Estimates and Forecasts, By Application (2020-2032) (USD Billion)
9.4.5.2 China Acetic Acid Market Estimates and Forecasts, By End-Use Industry (2020-2032) (USD Billion)
9.4.6 India
9.4.5.1 India Acetic Acid Market Estimates and Forecasts, By Application (2020-2032) (USD Billion)
9.4.5.2 India Acetic Acid Market Estimates and Forecasts, By End-Use Industry (2020-2032) (USD Billion)
9.4.5 Japan
9.4.5.1 Japan Acetic Acid Market Estimates and Forecasts, By Application (2020-2032) (USD Billion)
9.4.5.2 Japan Acetic Acid Market Estimates and Forecasts, By End-Use Industry (2020-2032) (USD Billion)
9.4.6 South Korea
9.4.6.1 South Korea Acetic Acid Market Estimates and Forecasts, By Application (2020-2032) (USD Billion)
9.4.6.2 South Korea Acetic Acid Market Estimates and Forecasts, By End-Use Industry (2020-2032) (USD Billion)
9.4.7 Vietnam
9.4.7.1 Vietnam Acetic Acid Market Estimates and Forecasts, By Application (2020-2032) (USD Billion)
9.2.7.2 Vietnam Acetic Acid Market Estimates and Forecasts, By End-Use Industry (2020-2032) (USD Billion)
9.4.8 Singapore
9.4.8.1 Singapore Acetic Acid Market Estimates and Forecasts, By Application (2020-2032) (USD Billion)
9.4.8.2 Singapore Acetic Acid Market Estimates and Forecasts, By End-Use Industry (2020-2032) (USD Billion)
9.4.9 Australia
9.4.9.1 Australia Acetic Acid Market Estimates and Forecasts, By Application (2020-2032) (USD Billion)
9.4.9.2 Australia Acetic Acid Market Estimates and Forecasts, By End-Use Industry (2020-2032) (USD Billion)
9.4.10 Rest of Asia Pacific
9.4.10.1 Rest of Asia Pacific Acetic Acid Market Estimates and Forecasts, By Application (2020-2032) (USD Billion)
9.4.10.2 Rest of Asia Pacific Acetic Acid Market Estimates and Forecasts, By End-Use Industry (2020-2032) (USD Billion)
9.5 Middle East and Africa
9.5.1 Middle East
9.5.1.1 Trends Analysis
9.5.1.2 Middle East Acetic Acid Market Estimates and Forecasts, by Country (2020-2032) (USD Billion)
9.5.1.3 Middle East Acetic Acid Market Estimates and Forecasts, By Application (2020-2032) (USD Billion)
9.5.1.4 Middle East Acetic Acid Market Estimates and Forecasts, By End-Use Industry (2020-2032) (USD Billion)
9.5.1.5 UAE
9.5.1.5.1 UAE Acetic Acid Market Estimates and Forecasts, By Application (2020-2032) (USD Billion)
9.5.1.5.2 UAE Acetic Acid Market Estimates and Forecasts, By End-Use Industry (2020-2032) (USD Billion)
9.5.1.6 Egypt
9.5.1.6.1 Egypt Acetic Acid Market Estimates and Forecasts, By Application (2020-2032) (USD Billion)
9.5.1.6.2 Egypt Acetic Acid Market Estimates and Forecasts, By End-Use Industry (2020-2032) (USD Billion)
9.5.1.7 Saudi Arabia
9.5.1.7.1 Saudi Arabia Acetic Acid Market Estimates and Forecasts, By Application (2020-2032) (USD Billion)
9.5.1.7.2 Saudi Arabia Acetic Acid Market Estimates and Forecasts, By End-Use Industry (2020-2032) (USD Billion)
9.5.1.8 Qatar
9.5.1.8.1 Qatar Acetic Acid Market Estimates and Forecasts, By Application (2020-2032) (USD Billion)
9.5.1.8.2 Qatar Acetic Acid Market Estimates and Forecasts, By End-Use Industry (2020-2032) (USD Billion)
9.5.1.9 Rest of Middle East
9.5.1.9.1 Rest of Middle East Acetic Acid Market Estimates and Forecasts, By Application (2020-2032) (USD Billion)
9.5.1.9.2 Rest of Middle East Acetic Acid Market Estimates and Forecasts, By End-Use Industry (2020-2032) (USD Billion)
9.5.2 Africa
9.5.2.1 Trends Analysis
9.5.2.2 Africa Acetic Acid Market Estimates and Forecasts, by Country (2020-2032) (USD Billion)
9.5.2.3 Africa Acetic Acid Market Estimates and Forecasts, By Application (2020-2032) (USD Billion)
9.5.2.4 Africa Acetic Acid Market Estimates and Forecasts, By End-Use Industry (2020-2032) (USD Billion)
9.5.2.5 South Africa
9.5.2.5.1 South Africa Acetic Acid Market Estimates and Forecasts, By Application (2020-2032) (USD Billion)
9.5.2.5.2 South Africa Acetic Acid Market Estimates and Forecasts, By End-Use Industry (2020-2032) (USD Billion)
9.5.2.6 Nigeria
9.5.2.6.1 Nigeria Acetic Acid Market Estimates and Forecasts, By Application (2020-2032) (USD Billion)
9.5.2.6.2 Nigeria Acetic Acid Market Estimates and Forecasts, By End-Use Industry (2020-2032) (USD Billion)
9.6 Latin America
9.6.1 Trends Analysis
9.6.2 Latin America Acetic Acid Market Estimates and Forecasts, by Country (2020-2032) (USD Billion)
9.6.3 Latin America Acetic Acid Market Estimates and Forecasts, By Application (2020-2032) (USD Billion)
9.6.4 Latin America Acetic Acid Market Estimates and Forecasts, By End-Use Industry (2020-2032) (USD Billion)
9.6.5 Brazil
9.6.5.1 Brazil Acetic Acid Market Estimates and Forecasts, By Application (2020-2032) (USD Billion)
9.6.5.2 Brazil Acetic Acid Market Estimates and Forecasts, By End-Use Industry (2020-2032) (USD Billion)
9.6.6 Argentina
9.6.6.1 Argentina Acetic Acid Market Estimates and Forecasts, By Application (2020-2032) (USD Billion)
9.6.6.2 Argentina Acetic Acid Market Estimates and Forecasts, By End-Use Industry (2020-2032) (USD Billion)
9.6.7 Colombia
9.6.7.1 Colombia Acetic Acid Market Estimates and Forecasts, By Application (2020-2032) (USD Billion)
9.6.7.2 Colombia Acetic Acid Market Estimates and Forecasts, By End-Use Industry (2020-2032) (USD Billion)
9.6.8 Rest of Latin America
9.6.8.1 Rest of Latin America Acetic Acid Market Estimates and Forecasts, By Application (2020-2032) (USD Billion)
9.6.8.2 Rest of Latin America Acetic Acid Market Estimates and Forecasts, By End-Use Industry (2020-2032) (USD Billion)
10. Company Profiles
10.1 Celanese Corporation
10.1.1 Company Overview
10.1.2 Financial
10.1.3 Product / Services Offered
10.1.4 SWOT Analysis
10.2 Eastman Chemical Company
10.2.1 Company Overview
10.2.2 Financial
10.2.3 Product/ Services Offered
10.2.4 SWOT Analysis
10.3 LyondellBasell Industries Holdings B.V.
10.3.1 Company Overview
10.3.2 Financial
10.3.3 Product/ Services Offered
10.3.4 SWOT Analysis
10.4 Indian Oil Corporation Ltd.
10.4.1 Company Overview
10.4.2 Financial
10.4.3 Product/ Services Offered
10.4.4 SWOT Analysis
10.5 Gujarat Narmada Valley Fertilizers & Chemicals Limited
10.5.1 Company Overview
10.5.2 Financial
10.5.3 Product/ Services Offered
10.5.4 SWOT Analysis
10.6 Dow
10.6.1 Company Overview
10.6.2 Financial
10.6.3 Product/ Services Offered
10.6.4 SWOT Analysis
10.7 Jiangsu Sopo (Group) Co., Ltd.
10.7.1 Company Overview
10.7.2 Financial
10.7.3 Product/ Services Offered
10.7.4 SWOT Analysis
10.8 Mitsubishi Chemical Corporation
10.8.1 Company Overview
10.8.2 Financial
10.8.3 Product/ Services Offered
10.8.4 SWOT Analysis
10.9 Shandong Hualu-Hengsheng Chemical Co., Ltd.
10.9.1 Company Overview
10.9.2 Financial
10.9.3 Product/ Services Offered
10.9.4 SWOT Analysis
10.10 Shanghai Huayi (Group) Company
10.10.1 Company Overview
10.10.2 Financial
10.10.3 Product/ Services Offered
10.10.4 SWOT Analysis
11. Use Cases and Best Practices
12. Conclusion
An accurate research report requires proper strategizing as well as implementation. There are multiple factors involved in the completion of good and accurate research report and selecting the best methodology to compete the research is the toughest part. Since the research reports we provide play a crucial role in any company’s decision-making process, therefore we at SNS Insider always believe that we should choose the best method which gives us results closer to reality. This allows us to reach at a stage wherein we can provide our clients best and accurate investment to output ratio.
Each report that we prepare takes a timeframe of 350-400 business hours for production. Starting from the selection of titles through a couple of in-depth brain storming session to the final QC process before uploading our titles on our website we dedicate around 350 working hours. The titles are selected based on their current market cap and the foreseen CAGR and growth.
The 5 steps process:
Step 1: Secondary Research:
Secondary Research or Desk Research is as the name suggests is a research process wherein, we collect data through the readily available information. In this process we use various paid and unpaid databases which our team has access to and gather data through the same. This includes examining of listed companies’ annual reports, Journals, SEC filling etc. Apart from this our team has access to various associations across the globe across different industries. Lastly, we have exchange relationships with various university as well as individual libraries.

Step 2: Primary Research
When we talk about primary research, it is a type of study in which the researchers collect relevant data samples directly, rather than relying on previously collected data. This type of research is focused on gaining content specific facts that can be sued to solve specific problems. Since the collected data is fresh and first hand therefore it makes the study more accurate and genuine.
We at SNS Insider have divided Primary Research into 2 parts.
Part 1 wherein we interview the KOLs of major players as well as the upcoming ones across various geographic regions. This allows us to have their view over the market scenario and acts as an important tool to come closer to the accurate market numbers. As many as 45 paid and unpaid primary interviews are taken from both the demand and supply side of the industry to make sure we land at an accurate judgement and analysis of the market.
This step involves the triangulation of data wherein our team analyses the interview transcripts, online survey responses and observation of on filed participants. The below mentioned chart should give a better understanding of the part 1 of the primary interview.

Part 2: In this part of primary research the data collected via secondary research and the part 1 of the primary research is validated with the interviews from individual consultants and subject matter experts.
Consultants are those set of people who have at least 12 years of experience and expertise within the industry whereas Subject Matter Experts are those with at least 15 years of experience behind their back within the same space. The data with the help of two main processes i.e., FGDs (Focused Group Discussions) and IDs (Individual Discussions). This gives us a 3rd party nonbiased primary view of the market scenario making it a more dependable one while collation of the data pointers.
Step 3: Data Bank Validation
Once all the information is collected via primary and secondary sources, we run that information for data validation. At our intelligence centre our research heads track a lot of information related to the market which includes the quarterly reports, the daily stock prices, and other relevant information. Our data bank server gets updated every fortnight and that is how the information which we collected using our primary and secondary information is revalidated in real time.

Step 4: QA/QC Process
After all the data collection and validation our team does a final level of quality check and quality assurance to get rid of any unwanted or undesired mistakes. This might include but not limited to getting rid of the any typos, duplication of numbers or missing of any important information. The people involved in this process include technical content writers, research heads and graphics people. Once this process is completed the title gets uploader on our platform for our clients to read it.
Step 5: Final QC/QA Process:
This is the last process and comes when the client has ordered the study. In this process a final QA/QC is done before the study is emailed to the client. Since we believe in giving our clients a good experience of our research studies, therefore, to make sure that we do not lack at our end in any way humanly possible we do a final round of quality check and then dispatch the study to the client.
Key Segments:
By Application
Vinyl Acetate Monomer
Acetic Anhydride
Acetate Esters
Purified Terephthalic Acid
Ethanol
Others
By End-Use Industry
Food and beverages
Paints and coating
Plastics & Polymers
Pharmaceutical
Chemicals
Others
Request for Segment Customization as per your Business Requirement: Segment Customization Request
Regional Coverage:
North America
US
Canada
Mexico
Europe
Eastern Europe
Poland
Romania
Hungary
Turkey
Rest of Eastern Europe
Western Europe
Germany
France
UK
Italy
Spain
Netherlands
Switzerland
Austria
Rest of Western Europe
Asia Pacific
China
India
Japan
South Korea
Vietnam
Singapore
Australia
Rest of Asia Pacific
Middle East & Africa
Middle East
UAE
Egypt
Saudi Arabia
Qatar
Rest of Middle East
Africa
Nigeria
South Africa
Rest of Africa
Latin America
Brazil
Argentina
Colombia
Rest of Latin America
Request for Country Level Research Report: Country Level Customization Request
Available Customization
With the given market data, SNS Insider offers customization as per the company’s specific needs. The following customization options are available for the report:
Detailed Volume Analysis
Criss-Cross segment analysis (e.g. Product X Application)
Competitive Product Benchmarking
Geographic Analysis
Additional countries in any of the regions
Customized Data Representation
Detailed analysis and profiling of additional market players
The Textile Chemicals Market Size was valued at USD 27.7 billion in 2023 and is expected to reach USD 41.9 billion by 2032 and grow at a CAGR of 4.7% over the forecast period 2024-2032.
The Flavors & Fragrances Market Size was valued at USD 30.5 billion in 2023, and is expected to reach USD 49.3 billion by 2032, and grow at a CAGR of 5.5% over the forecast period 2024-2032.
The Wax Emulsion Market was valued at USD 1.95 Billion in 2023 and is expected to reach USD 2.93 Billion by 2032, growing at a CAGR of 4.66% from 2024-2032.
Chromium Phosphate Market size was USD 131.01 Million in 2023 and is expected to reach USD 328.76 Million by 2032, growing at a CAGR of 10.76% from 2024-2032.
The Flexible Foam Market was valued at USD 45.52 Billion in 2023 and is expected to reach USD 71.75 Billion by 2032, growing at a CAGR of 5.19% from 2024-2032.
LIB Cathode Conductive Auxiliary Agents Market was valued at $ 1.51 Bn in 2023 and is expected to reach $ 7.28 Bn by 2032, at a CAGR of 19.10% from 2024-2032.

Hi! Click one of our member below to chat on Phone
© 2025 All Rights Reserved by SNS Insider Pvt Ltd


