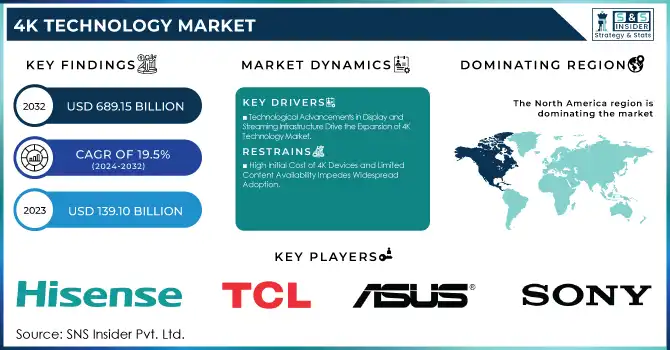
The 4K Technology Market Size was valued at USD 139.10 Billion in 2023 and is expected to reach USD 689.15 Billion by 2032 and grow at a CAGR of 19.5% over the forecast period 2024-2032.
The 4K technology market has been witnessing remarkable growth in recent years, driven by advancements in display technologies, increased consumer demand for high-quality entertainment experiences, and the rise of content creation in ultra-high-definition formats.
To get more information on 4K Technology Market - Request Free Sample Report
4K technology, which provides a resolution of 3840x2160 pixels, offers four times the resolution of Full HD (1080p), delivering significantly sharper images and enhanced visual experiences. This has fueled its adoption across various sectors, including consumer electronics, media, entertainment, gaming, healthcare, and retail, positioning the market for continued expansion.
The 4K technology market has experienced significant growth, driven by advancements in display technologies, increased consumer demand for high-quality content, and the proliferation of 4K-capable devices. In the United States, the adoption of 4K televisions has surged, with larger screen sizes becoming increasingly popular. This trend is further supported by the availability of 4K content from streaming services and broadcasters, enhancing the viewing experience and encouraging consumers to upgrade their devices. Additionally, the U.S. Federal Communications Commission (FCC) has reported on the performance of fixed broadband Internet access services, highlighting the importance of high-speed internet infrastructure in delivering 4K content effectively. The FCC's Measuring Broadband America program provides comprehensive data on broadband performance, underscoring the need for robust internet services to support the growing demand for 4K streaming. These factors collectively contribute to the expansion of the 4K technology market in the U.S., indicating a strong consumer preference for high-resolution displays and the necessary infrastructure to support them.
Key Drivers:
Increased Consumer Demand for High-Quality Visual Experiences Propels 4K Technology Adoption in Home Entertainment Systems
The growing consumer demand for enhanced viewing experiences has significantly boosted the 4K technology market. As consumers increasingly seek better visual quality, the desire for 4K TVs, monitors, and streaming content has expanded. The rise of streaming platforms such as Netflix, Disney+, and Amazon Prime Video offering 4K content has contributed to the widespread adoption of 4K devices. With content creators producing more 4K video content, from movies to TV shows and sports broadcasts, consumers are becoming more accustomed to viewing high-definition visuals. This demand for high-quality media has driven the market for 4K-enabled devices, particularly in the home entertainment sector. Additionally, advancements in display technologies, such as OLED and QLED, have made 4K displays more accessible and affordable, further encouraging consumers to upgrade their entertainment systems. As 4K content becomes increasingly prevalent across all forms of media, including gaming, users are investing in 4K-capable screens to fully experience the high-definition clarity that 4K technology offers, resulting in a continued expansion of the market.
Technological Advancements in Display and Streaming Infrastructure Drive the Expansion of 4K Technology Market
Technological innovations in both display technology and internet infrastructure have played a pivotal role in driving the growth of the 4K technology market. Advances in television display technologies, such as OLED, QLED, and Mini-LED, have enhanced the visual performance of 4K displays, offering consumers brighter, sharper, and more vibrant images. These improvements in display quality, combined with decreasing production costs, have made 4K televisions more affordable for a larger audience.
Furthermore, the advancement of internet infrastructure, including the availability of high-speed broadband and the rollout of 5G technology, has enabled seamless streaming of 4K content. As internet speeds increase, consumers can stream 4K videos without buffering, contributing to the widespread adoption of 4K-capable devices. Streaming platforms have responded to this demand by expanding their 4K content libraries and upgrading their technology to provide the best possible experience. These technological advancements in both hardware and connectivity have effectively facilitated the growth of the 4K technology market, creating a strong foundation for continued expansion in the coming years.
Restrain:
High Initial Cost of 4K Devices and Limited Content Availability Impedes Widespread Adoption
Despite the growing interest in 4K technology, the high initial cost of 4K-enabled devices remains a significant restraint to widespread adoption, particularly in price-sensitive markets. While the prices of 4K televisions and monitors have dropped over time, they are still considered premium products, with high-quality 4K models such as OLED and QLED still carrying hefty price tags. This can deter potential buyers who are not willing to invest in a higher-cost device.
Furthermore, despite the increasing availability of 4K content on streaming platforms and media channels, there is still a limited amount of 4K content compared to standard HD. This content gap is especially evident in certain regions or platforms, where 4K video libraries are not as robust as they are in markets like North America and Europe. Consumers may hesitate to upgrade to 4K technology if they believe there is insufficient content to justify the investment. Therefore, while the 4K technology market continues to expand, the high upfront cost of devices and the content availability issue remain obstacles that could slow the pace of adoption among more price-conscious and content-demanding consumers.
By Product
The TV monitors segment holds the largest revenue share of 40.00% in 2023 within the 4K technology market, driven by increasing consumer demand for high-quality home entertainment. This segment's dominance is largely attributed to the growing preference for 4K televisions and monitors, which deliver superior picture clarity and enhanced viewing experiences. Companies like Sony, Samsung, and LG have been at the forefront of product innovation within this segment.
For instance, Sony expanded its BRAVIA XR 4K TV lineup, incorporating its Cognitive Processor XR to enhance picture and sound quality based on ambient conditions. LG has also been developing 4K OLED displays with improved refresh rates and AI-powered image processing for an immersive experience, particularly appealing to gaming and sports enthusiasts.
The smartphones segment is expected to grow at the highest CAGR of 22.14% during the forecast period within the 4K technology market. This growth is primarily driven by increasing consumer demand for high-definition mobile content, including streaming, gaming, and photography. Leading smartphone manufacturers such as Samsung, Apple, and Xiaomi have integrated 4K technology into their latest models, contributing to the segment's rapid expansion.
For example, Samsung’s Galaxy S23 Ultra comes with a 4K display, 4K recording capabilities, and improved camera sensors to provide superior photography and videography experiences. Similarly, Apple’s iPhone 14 Pro Max supports 4K video recording with Dolby Vision HDR, allowing users to create and view high-quality content.
By End Use
The Consumer Electronics segment dominates the 4K technology market with the largest revenue share of 52.00% in 2023. This dominance is primarily driven by the increasing demand for 4K televisions, gaming consoles, and home entertainment systems. As consumers seek superior visual experiences, the adoption of 4K technology has surged, particularly in smart TVs and other display devices. Companies such as Sony, Samsung, and LG are leading the market by introducing innovative 4K products.
For instance, Sony’s BRAVIA XR 4K TVs incorporate advanced technologies like the Cognitive Processor XR for optimized image and sound quality. LG has strengthened its position by launching 4K OLED TVs with improved refresh rates and AI-based image processing, catering to the growing demand for high-definition content and gaming.
The Healthcare segment is projected to experience the highest CAGR of 21.61% during the forecast period within the 4K technology market. This growth is driven by the increasing adoption of 4K imaging and video technologies in medical procedures, diagnostics, and surgery. High-resolution 4K cameras and monitors allow healthcare professionals to view finer details in medical imaging, improving the accuracy of diagnoses and procedures.
For example, companies like Sony and Panasonic have developed 4K medical displays and cameras for use in endoscopy, surgery, and medical imaging. Sony’s medical-grade 4K monitors, which offer ultra-high-definition clarity, are increasingly being used in operating rooms to enhance surgical precision.
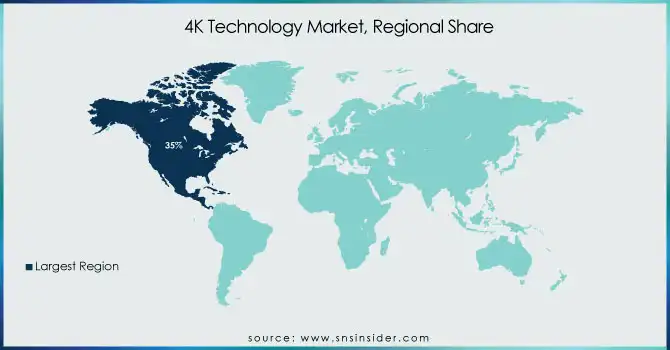
In 2023, the North America region dominated the 4K technology market, with an estimated market share of around 35%. This dominance is driven by the high demand for 4K-enabled devices across consumer electronics, including televisions, gaming consoles, and streaming services. North America, particularly the United States, has seen widespread adoption of 4K technology in home entertainment systems, largely due to the availability of high-speed internet and the rapid growth of streaming platforms like Netflix, Amazon Prime Video, and Disney+, all of which offer 4K content.
The high disposable income and tech-savvy consumer base in North America have also fueled the demand for premium 4K products. Additionally, the prevalence of gaming, with consoles like the PlayStation 5 and Xbox Series X offering 4K gaming experiences, has contributed to the region’s dominance in the 4K technology market.
The Asia Pacific region is the fastest growing in the 4K technology market in 2023, with an estimated CAGR of 21.95% during the forecast period. This rapid growth is largely attributed to the rising adoption of 4K technology in countries like China, Japan, India, and South Korea, driven by increasing urbanization, rising disposable income, and a growing middle class.
For example, China major companies like Hisense, TCL, and Xiaomi are leading the market with affordable 4K-enabled televisions and smartphones, making 4K technology more accessible to a broader consumer base.
Get Customized Report as per Your Business Requirement - Enquiry Now
Some of the major players in the 4K Technology Market are:
Sony Corp. (Bravia 4K TVs, Sony 4K Cameras)
JVC Kenwood Corp. (JVC 4K Projectors, JVC 4K Camcorders)
AsusTek Corp. (Asus 4K Monitors, Asus 4K Laptops)
Hong Kong Skyworth Digital Holdings Ltd. (Skyworth 4K Smart TVs, Skyworth 4K Set-top Boxes)
TCL Corp. (TCL 4K QLED TVs, TCL 4K Android TVs)
Hisense Co., Ltd. (Hisense 4K ULED TVs, Hisense 4K Laser TVs)
Amazon Inc. (Amazon Fire TV 4K, Amazon Prime Video 4K Streaming)
Canon Inc. (Canon 4K Professional Cameras, Canon 4K Camcorders)
Blackmagic Design Pty Ltd. (Blackmagic 4K Cinema Cameras, Blackmagic 4K Video Switchers)
Innolux Corp. (Innolux 4K Display Panels, Innolux 4K Touch Screens)
LG Electronics Corp. (LG OLED 4K TVs, LG UltraFine 4K Monitors)
Panasonic Corp. (Panasonic 4K UHD TVs, Panasonic 4K Professional Cameras)
Samsung Electronics Corp. (Samsung Neo QLED 4K TVs, Samsung 4K Smart Monitors)
Sharp Corp. (Sharp AQUOS 4K TVs, Sharp 4K Display Panels)
In March 2023, Sony enhanced its BRAVIA XR 4K TV range by introducing the Cognitive Processor XR, which optimizes both picture and sound based on the surrounding environment and the type of content being viewed. Sony also highlighted its BRAVIA CORE streaming platform, which delivers exclusive 4K Blu-ray-quality content to users.
In January 2023, LG launched OLED TVs featuring upgraded refresh rates and AI-driven image processing, offering a smoother experience for 4K gaming and sports. Furthermore, LG partnered with Dolby Laboratories to integrate Dolby Vision IQ with Precision Detail, further enhancing the 4K HDR viewing experience.
Report Attributes |
Details |
---|---|
Market Size in 2023 |
USD 139.10 Billion |
Market Size by 2032 |
USD 689.15 Billion |
CAGR |
CAGR of 19.5 % From 2024 to 2032 |
Base Year |
2023 |
Forecast Period |
2024-2032 |
Historical Data |
2020-2022 |
Report Scope & Coverage |
Market Size, Segments Analysis, Competitive Landscape, Regional Analysis, DROC & SWOT Analysis, Forecast Outlook |
Key Segments |
• By Product (Set-top boxes, TV monitors, Digital signage, Smartphones, Tablets & laptops) |
Regional Analysis/Coverage |
North America (US, Canada, Mexico), Europe (Eastern Europe [Poland, Romania, Hungary, Turkey, Rest of Eastern Europe] Western Europe] Germany, France, UK, Italy, Spain, Netherlands, Switzerland, Austria, Rest of Western Europe]), Asia Pacific (China, India, Japan, South Korea, Vietnam, Singapore, Australia, Rest of Asia Pacific), Middle East & Africa (Middle East [UAE, Egypt, Saudi Arabia, Qatar, Rest of Middle East], Africa [Nigeria, South Africa, Rest of Africa], Latin America (Brazil, Argentina, Colombia, Rest of Latin America) |
Company Profiles |
Sony Corp., JVC Kenwood Corp., AsusTek Corp., Hong Kong Skyworth Digital Holdings Ltd., TCL Corp., Hisense Co., Ltd., Amazon Inc., Canon Inc., Blackmagic Design Pty Ltd., Innolux Corp., LG Electronics Corp., Panasonic Corp., Samsung Electronics Corp., Sharp Corp. |
Key Drivers |
• Increased Consumer Demand for High-Quality Visual Experiences Propels 4K Technology Adoption in Home Entertainment Systems. |
Restraints |
• High Initial Cost of 4K Devices and Limited Content Availability Impedes Widespread Adoption. |
Ans: The 4K Technology Market is expected to grow at a CAGR of 19.5% during 2024-2032.
Ans: The 4K Technology Market size was USD 139.10 billion in 2023 and is expected to Reach USD 689.15 billion by 2032.
Ans: The major growth factor of the 4K technology market is the increasing consumer demand for high-quality visual experiences in entertainment, gaming, and content streaming.
Ans: TV monitors segment dominated the 4K Technology Market.
Ans: North America dominated the 4K Technology Market in 2023.
1. Introduction
1.1 Market Definition
1.2 Scope (Inclusion and Exclusions)
1.3 Research Assumptions
2. Executive Summary
2.1 Market Overview
2.2 Regional Synopsis
2.3 Competitive Summary
3. Research Methodology
3.1 Top-Down Approach
3.2 Bottom-up Approach
3.3. Data Validation
3.4 Primary Interviews
4. Market Dynamics Impact Analysis
4.1 Market Driving Factors Analysis
4.1.2 Drivers
4.1.2 Restraints
4.1.3 Opportunities
4.1.4 Challenges
4.2 PESTLE Analysis
4.3 Porter’s Five Forces Model
5. Statistical Insights and Trends Reporting
5.1 Adoption Rate of 4K Devices (2023)
5.2 Consumer Preferences & Spending Patterns
5.3 Technological Developments and Patents (2023)
5.4 Telecom and Network Adoption
6. Competitive Landscape
6.1 List of Major Companies, By Region
6.2 Market Share Analysis, By Region
6.3 Product Benchmarking
6.3.1 Product specifications and features
6.3.2 Pricing
6.4 Strategic Initiatives
6.4.1 Marketing and promotional activities
6.4.2 Distribution and supply chain strategies
6.4.3 Expansion plans and new product launches
6.4.4 Strategic partnerships and collaborations
6.5 Technological Advancements
6.6 Market Positioning and Branding
7. 4K Technology Market Segmentation, By End Use
7.1 Chapter Overview
7.2 Consumer electronics
7.2.1 Consumer electronics Market Trends Analysis (2020-2032)
7.2.2 Consumer electronics Market Size Estimates and Forecasts to 2032 (USD Billion)
7.3 Media & entertainment
7.3.1 Media & entertainment Market Trends Analysis (2020-2032)
7.3.2 Media & entertainment Market Size Estimates and Forecasts to 2032 (USD Billion)
7.4 Healthcare
7.4.1 Healthcare Market Trends Analysis (2020-2032)
7.4.2 Healthcare Market Size Estimates and Forecasts to 2032 (USD Billion)
7.5 Education
7.5.1 Education Market Trends Analysis (2020-2032)
7.5.2 Education Market Size Estimates and Forecasts to 2032 (USD Billion)
7.6 Retail & advertising
7.6.1 Retail & advertising Market Trends Analysis (2020-2032)
7.6.2 Retail & advertising Market Size Estimates and Forecasts to 2032 (USD Billion)
7.7 Others
7.7.1 Others Market Trends Analysis (2020-2032)
7.7.2 Others Market Size Estimates and Forecasts to 2032 (USD Billion)
8. 4K Technology Market Segmentation, By Product
8.1 Chapter Overview
8.2 Set-top boxes
8.2.1 Set-top boxes Market Trends Analysis (2020-2032)
8.2.2 Set-top boxes Market Size Estimates and Forecasts to 2032 (USD Billion)
8.3 TV monitors
8.3.1 TV monitors Market Trends Analysis (2020-2032)
8.3.2 TV monitors Market Size Estimates and Forecasts to 2032 (USD Billion)
8.4 Digital signage
8.2.1 Digital signage Market Trends Analysis (2020-2032)
8.4.2 Digital signage Market Size Estimates and Forecasts to 2032 (USD Billion)
8.5 Smartphones
8.5.1 Smartphones Market Trends Analysis (2020-2032)
8.5.2 Smartphones Market Size Estimates and Forecasts to 2032 (USD Billion)
8.6 Tablets & laptops
8.6.1 Tablets & laptops Market Trends Analysis (2020-2032)
8.6.2 Tablets & laptops Market Size Estimates and Forecasts to 2032 (USD Billion)
9. Regional Analysis
9.1 Chapter Overview
9.2 North America
9.2.1 Trends Analysis
9.2.2 North America 4K Technology Market Estimates and Forecasts, by Country (2020-2032) (USD Billion)
9.2.3 North America 4K Technology Market Estimates and Forecasts, By End Use (2020-2032) (USD Billion)
9.2.4 North America 4K Technology Market Estimates and Forecasts, By Product (2020-2032) (USD Billion)
9.2.5 USA
9.2.5.1 USA 4K Technology Market Estimates and Forecasts, By End Use (2020-2032) (USD Billion)
9.2.5.2 USA 4K Technology Market Estimates and Forecasts, By Product (2020-2032) (USD Billion)
9.2.6 Canada
9.2.6.1 Canada 4K Technology Market Estimates and Forecasts, By End Use (2020-2032) (USD Billion)
9.2.6.2 Canada 4K Technology Market Estimates and Forecasts, By Product (2020-2032) (USD Billion)
9.2.7 Mexico
9.2.7.1 Mexico 4K Technology Market Estimates and Forecasts, By End Use (2020-2032) (USD Billion)
9.2.7.2 Mexico 4K Technology Market Estimates and Forecasts, By Product (2020-2032) (USD Billion)
9.3 Europe
9.3.1 Eastern Europe
9.3.1.1 Trends Analysis
9.3.1.2 Eastern Europe 4K Technology Market Estimates and Forecasts, by Country (2020-2032) (USD Billion)
9.3.1.3 Eastern Europe 4K Technology Market Estimates and Forecasts, By End Use (2020-2032) (USD Billion)
9.3.1.4 Eastern Europe 4K Technology Market Estimates and Forecasts, By Product (2020-2032) (USD Billion)
9.3.1.5 Poland
9.3.1.5.1 Poland 4K Technology Market Estimates and Forecasts, By End Use (2020-2032) (USD Billion)
9.3.1.5.2 Poland 4K Technology Market Estimates and Forecasts, By Product (2020-2032) (USD Billion)
9.3.1.6 Romania
9.3.1.6.1 Romania 4K Technology Market Estimates and Forecasts, By End Use (2020-2032) (USD Billion)
9.3.1.6.2 Romania 4K Technology Market Estimates and Forecasts, By Product (2020-2032) (USD Billion)
9.3.1.7 Hungary
9.3.1.7.1 Hungary 4K Technology Market Estimates and Forecasts, By End Use (2020-2032) (USD Billion)
9.3.1.7.2 Hungary 4K Technology Market Estimates and Forecasts, By Product (2020-2032) (USD Billion)
9.3.1.8 Turkey
9.3.1.8.1 Turkey 4K Technology Market Estimates and Forecasts, By End Use (2020-2032) (USD Billion)
9.3.1.8.2 Turkey 4K Technology Market Estimates and Forecasts, By Product (2020-2032) (USD Billion)
9.3.1.9 Rest of Eastern Europe
9.3.1.9.1 Rest of Eastern Europe 4K Technology Market Estimates and Forecasts, By End Use (2020-2032) (USD Billion)
9.3.1.9.2 Rest of Eastern Europe 4K Technology Market Estimates and Forecasts, By Product (2020-2032) (USD Billion)
9.3.2 Western Europe
9.3.2.1 Trends Analysis
9.3.2.2 Western Europe 4K Technology Market Estimates and Forecasts, by Country (2020-2032) (USD Billion)
9.3.2.3 Western Europe 4K Technology Market Estimates and Forecasts, By End Use (2020-2032) (USD Billion)
9.3.2.4 Western Europe 4K Technology Market Estimates and Forecasts, By Product (2020-2032) (USD Billion)
9.3.2.5 Germany
9.3.2.5.1 Germany 4K Technology Market Estimates and Forecasts, By End Use (2020-2032) (USD Billion)
9.3.2.5.2 Germany 4K Technology Market Estimates and Forecasts, By Product (2020-2032) (USD Billion)
9.3.2.6 France
9.3.2.6.1 France 4K Technology Market Estimates and Forecasts, By End Use (2020-2032) (USD Billion)
9.3.2.6.2 France 4K Technology Market Estimates and Forecasts, By Product (2020-2032) (USD Billion)
9.3.2.7 UK
9.3.2.7.1 UK 4K Technology Market Estimates and Forecasts, By End Use (2020-2032) (USD Billion)
9.3.2.7.2 UK 4K Technology Market Estimates and Forecasts, By Product (2020-2032) (USD Billion)
9.3.2.8 Italy
9.3.2.8.1 Italy 4K Technology Market Estimates and Forecasts, By End Use (2020-2032) (USD Billion)
9.3.2.8.2 Italy 4K Technology Market Estimates and Forecasts, By Product (2020-2032) (USD Billion)
9.3.2.9 Spain
9.3.2.9.1 Spain 4K Technology Market Estimates and Forecasts, By End Use (2020-2032) (USD Billion)
9.3.2.9.2 Spain 4K Technology Market Estimates and Forecasts, By Product (2020-2032) (USD Billion)
9.3.2.10 Netherlands
9.3.2.10.1 Netherlands 4K Technology Market Estimates and Forecasts, By End Use (2020-2032) (USD Billion)
9.3.2.10.2 Netherlands 4K Technology Market Estimates and Forecasts, By Product (2020-2032) (USD Billion)
9.3.2.11 Switzerland
9.3.2.11.1 Switzerland 4K Technology Market Estimates and Forecasts, By End Use (2020-2032) (USD Billion)
9.3.2.11.2 Switzerland 4K Technology Market Estimates and Forecasts, By Product (2020-2032) (USD Billion)
9.3.2.12 Austria
9.3.2.12.1 Austria 4K Technology Market Estimates and Forecasts, By End Use (2020-2032) (USD Billion)
9.3.2.12.2 Austria 4K Technology Market Estimates and Forecasts, By Product (2020-2032) (USD Billion)
9.3.2.13 Rest of Western Europe
9.3.2.13.1 Rest of Western Europe 4K Technology Market Estimates and Forecasts, By End Use (2020-2032) (USD Billion)
9.3.2.13.2 Rest of Western Europe 4K Technology Market Estimates and Forecasts, By Product (2020-2032) (USD Billion)
9.4 Asia Pacific
9.4.1 Trends Analysis
9.4.2 Asia Pacific 4K Technology Market Estimates and Forecasts, by Country (2020-2032) (USD Billion)
9.4.3 Asia Pacific 4K Technology Market Estimates and Forecasts, By End Use (2020-2032) (USD Billion)
9.4.4 Asia Pacific 4K Technology Market Estimates and Forecasts, By Product (2020-2032) (USD Billion)
9.4.5 China
9.4.5.1 China 4K Technology Market Estimates and Forecasts, By End Use (2020-2032) (USD Billion)
9.4.5.2 China 4K Technology Market Estimates and Forecasts, By Product (2020-2032) (USD Billion)
9.4.6 India
9.4.5.1 India 4K Technology Market Estimates and Forecasts, By End Use (2020-2032) (USD Billion)
9.4.5.2 India 4K Technology Market Estimates and Forecasts, By Product (2020-2032) (USD Billion)
9.4.5 Japan
9.4.5.1 Japan 4K Technology Market Estimates and Forecasts, By End Use (2020-2032) (USD Billion)
9.4.5.2 Japan 4K Technology Market Estimates and Forecasts, By Product (2020-2032) (USD Billion)
9.4.6 South Korea
9.4.6.1 South Korea 4K Technology Market Estimates and Forecasts, By End Use (2020-2032) (USD Billion)
9.4.6.2 South Korea 4K Technology Market Estimates and Forecasts, By Product (2020-2032) (USD Billion)
9.4.7 Vietnam
9.4.7.1 Vietnam 4K Technology Market Estimates and Forecasts, By End Use (2020-2032) (USD Billion)
9.2.7.2 Vietnam 4K Technology Market Estimates and Forecasts, By Product (2020-2032) (USD Billion)
9.4.8 Singapore
9.4.8.1 Singapore 4K Technology Market Estimates and Forecasts, By End Use (2020-2032) (USD Billion)
9.4.8.2 Singapore 4K Technology Market Estimates and Forecasts, By Product (2020-2032) (USD Billion)
9.4.9 Australia
9.4.9.1 Australia 4K Technology Market Estimates and Forecasts, By End Use (2020-2032) (USD Billion)
9.4.9.2 Australia 4K Technology Market Estimates and Forecasts, By Product (2020-2032) (USD Billion)
9.4.10 Rest of Asia Pacific
9.4.10.1 Rest of Asia Pacific 4K Technology Market Estimates and Forecasts, By End Use (2020-2032) (USD Billion)
9.4.10.2 Rest of Asia Pacific 4K Technology Market Estimates and Forecasts, By Product (2020-2032) (USD Billion)
9.5 Middle East and Africa
9.5.1 Middle East
9.5.1.1 Trends Analysis
9.5.1.2 Middle East 4K Technology Market Estimates and Forecasts, by Country (2020-2032) (USD Billion)
9.5.1.3 Middle East 4K Technology Market Estimates and Forecasts, By End Use (2020-2032) (USD Billion)
9.5.1.4 Middle East 4K Technology Market Estimates and Forecasts, By Product (2020-2032) (USD Billion)
9.5.1.5 UAE
9.5.1.5.1 UAE 4K Technology Market Estimates and Forecasts, By End Use (2020-2032) (USD Billion)
9.5.1.5.2 UAE 4K Technology Market Estimates and Forecasts, By Product (2020-2032) (USD Billion)
9.5.1.6 Egypt
9.5.1.6.1 Egypt 4K Technology Market Estimates and Forecasts, By End Use (2020-2032) (USD Billion)
9.5.1.6.2 Egypt 4K Technology Market Estimates and Forecasts, By Product (2020-2032) (USD Billion)
9.5.1.7 Saudi Arabia
9.5.1.7.1 Saudi Arabia 4K Technology Market Estimates and Forecasts, By End Use (2020-2032) (USD Billion)
9.5.1.7.2 Saudi Arabia 4K Technology Market Estimates and Forecasts, By Product (2020-2032) (USD Billion)
9.5.1.8 Qatar
9.5.1.8.1 Qatar 4K Technology Market Estimates and Forecasts, By End Use (2020-2032) (USD Billion)
9.5.1.8.2 Qatar 4K Technology Market Estimates and Forecasts, By Product (2020-2032) (USD Billion)
9.5.1.9 Rest of Middle East
9.5.1.9.1 Rest of Middle East 4K Technology Market Estimates and Forecasts, By End Use (2020-2032) (USD Billion)
9.5.1.9.2 Rest of Middle East 4K Technology Market Estimates and Forecasts, By Product (2020-2032) (USD Billion)
9.5.2 Africa
9.5.2.1 Trends Analysis
9.5.2.2 Africa 4K Technology Market Estimates and Forecasts, by Country (2020-2032) (USD Billion)
9.5.2.3 Africa 4K Technology Market Estimates and Forecasts, By End Use (2020-2032) (USD Billion)
9.5.2.4 Africa 4K Technology Market Estimates and Forecasts, By Product (2020-2032) (USD Billion)
9.5.2.5 South Africa
9.5.2.5.1 South Africa 4K Technology Market Estimates and Forecasts, By End Use (2020-2032) (USD Billion)
9.5.2.5.2 South Africa 4K Technology Market Estimates and Forecasts, By Product (2020-2032) (USD Billion)
9.5.2.6 Nigeria
9.5.2.6.1 Nigeria 4K Technology Market Estimates and Forecasts, By End Use (2020-2032) (USD Billion)
9.5.2.6.2 Nigeria 4K Technology Market Estimates and Forecasts, By Product (2020-2032) (USD Billion)
9.5.2.7 Rest of Africa
9.5.2.7.1 Rest of Africa 4K Technology Market Estimates and Forecasts, By End Use (2020-2032) (USD Billion)
9.5.2.7.2 Rest of Africa 4K Technology Market Estimates and Forecasts, By Product (2020-2032) (USD Billion)
9.6 Latin America
9.6.1 Trends Analysis
9.6.2 Latin America 4K Technology Market Estimates and Forecasts, by Country (2020-2032) (USD Billion)
9.6.3 Latin America 4K Technology Market Estimates and Forecasts, By End Use (2020-2032) (USD Billion)
9.6.4 Latin America 4K Technology Market Estimates and Forecasts, By Product (2020-2032) (USD Billion)
9.6.5 Brazil
9.6.5.1 Brazil 4K Technology Market Estimates and Forecasts, By End Use (2020-2032) (USD Billion)
9.6.5.2 Brazil 4K Technology Market Estimates and Forecasts, By Product (2020-2032) (USD Billion)
9.6.6 Argentina
9.6.6.1 Argentina 4K Technology Market Estimates and Forecasts, By End Use (2020-2032) (USD Billion)
9.6.6.2 Argentina 4K Technology Market Estimates and Forecasts, By Product (2020-2032) (USD Billion)
9.6.7 Colombia
9.6.7.1 Colombia 4K Technology Market Estimates and Forecasts, By End Use (2020-2032) (USD Billion)
9.6.7.2 Colombia 4K Technology Market Estimates and Forecasts, By Product (2020-2032) (USD Billion)
9.6.8 Rest of Latin America
9.6.8.1 Rest of Latin America 4K Technology Market Estimates and Forecasts, By End Use (2020-2032) (USD Billion)
9.6.8.2 Rest of Latin America 4K Technology Market Estimates and Forecasts, By Product (2020-2032) (USD Billion)
10. Company Profiles
10.1 Sony Corp.
10.1.1 Company Overview
10.1.2 Financial
10.1.3 Products/ Services Offered
110.1.4 SWOT Analysis
10.2 JVC Kenwood Corp.
10.2.1 Company Overview
10.2.2 Financial
10.2.3 Products/ Services Offered
10.2.4 SWOT Analysis
10.3 AsusTek Corp.
10.3.1 Company Overview
10.3.2 Financial
10.3.3 Products/ Services Offered
10.3.4 SWOT Analysis
10.4 Hong Kong Skyworth Digital Holdings Ltd.
10.4.1 Company Overview
10.4.2 Financial
10.4.3 Products/ Services Offered
10.4.4 SWOT Analysis
10.5 TCL Corp.
10.5.1 Company Overview
10.5.2 Financial
10.5.3 Products/ Services Offered
10.5.4 SWOT Analysis
10.6 Hisense Co., Ltd.
10.6.1 Company Overview
10.6.2 Financial
10.6.3 Products/ Services Offered
10.6.4 SWOT Analysis
10.7 Amazon Inc.
10.7.1 Company Overview
10.7.2 Financial
10.7.3 Products/ Services Offered
10.7.4 SWOT Analysis
10.8 Canon Inc.
10.8.1 Company Overview
10.8.2 Financial
10.8.3 Products/ Services Offered
10.8.4 SWOT Analysis
10.9 Blackmagic Design Pty Ltd.
10.9.1 Company Overview
10.9.2 Financial
10.9.3 Products/ Services Offered
10.9.4 SWOT Analysis
10.10 Innolux Corp.
10.9.1 Company Overview
10.9.2 Financial
10.9.3 Products/ Services Offered
10.9.4 SWOT Analysis
11. Use Cases and Best Practices
12. Conclusion
An accurate research report requires proper strategizing as well as implementation. There are multiple factors involved in the completion of good and accurate research report and selecting the best methodology to compete the research is the toughest part. Since the research reports we provide play a crucial role in any company’s decision-making process, therefore we at SNS Insider always believe that we should choose the best method which gives us results closer to reality. This allows us to reach at a stage wherein we can provide our clients best and accurate investment to output ratio.
Each report that we prepare takes a timeframe of 350-400 business hours for production. Starting from the selection of titles through a couple of in-depth brain storming session to the final QC process before uploading our titles on our website we dedicate around 350 working hours. The titles are selected based on their current market cap and the foreseen CAGR and growth.
The 5 steps process:
Step 1: Secondary Research:
Secondary Research or Desk Research is as the name suggests is a research process wherein, we collect data through the readily available information. In this process we use various paid and unpaid databases which our team has access to and gather data through the same. This includes examining of listed companies’ annual reports, Journals, SEC filling etc. Apart from this our team has access to various associations across the globe across different industries. Lastly, we have exchange relationships with various university as well as individual libraries.
Step 2: Primary Research
When we talk about primary research, it is a type of study in which the researchers collect relevant data samples directly, rather than relying on previously collected data. This type of research is focused on gaining content specific facts that can be sued to solve specific problems. Since the collected data is fresh and first hand therefore it makes the study more accurate and genuine.
We at SNS Insider have divided Primary Research into 2 parts.
Part 1 wherein we interview the KOLs of major players as well as the upcoming ones across various geographic regions. This allows us to have their view over the market scenario and acts as an important tool to come closer to the accurate market numbers. As many as 45 paid and unpaid primary interviews are taken from both the demand and supply side of the industry to make sure we land at an accurate judgement and analysis of the market.
This step involves the triangulation of data wherein our team analyses the interview transcripts, online survey responses and observation of on filed participants. The below mentioned chart should give a better understanding of the part 1 of the primary interview.
Part 2: In this part of primary research the data collected via secondary research and the part 1 of the primary research is validated with the interviews from individual consultants and subject matter experts.
Consultants are those set of people who have at least 12 years of experience and expertise within the industry whereas Subject Matter Experts are those with at least 15 years of experience behind their back within the same space. The data with the help of two main processes i.e., FGDs (Focused Group Discussions) and IDs (Individual Discussions). This gives us a 3rd party nonbiased primary view of the market scenario making it a more dependable one while collation of the data pointers.
Step 3: Data Bank Validation
Once all the information is collected via primary and secondary sources, we run that information for data validation. At our intelligence centre our research heads track a lot of information related to the market which includes the quarterly reports, the daily stock prices, and other relevant information. Our data bank server gets updated every fortnight and that is how the information which we collected using our primary and secondary information is revalidated in real time.
Step 4: QA/QC Process
After all the data collection and validation our team does a final level of quality check and quality assurance to get rid of any unwanted or undesired mistakes. This might include but not limited to getting rid of the any typos, duplication of numbers or missing of any important information. The people involved in this process include technical content writers, research heads and graphics people. Once this process is completed the title gets uploader on our platform for our clients to read it.
Step 5: Final QC/QA Process:
This is the last process and comes when the client has ordered the study. In this process a final QA/QC is done before the study is emailed to the client. Since we believe in giving our clients a good experience of our research studies, therefore, to make sure that we do not lack at our end in any way humanly possible we do a final round of quality check and then dispatch the study to the client.
By Product
TV monitors
Digital signage
Smartphones
Tablets & laptops
By End Use
Media & entertainment
Healthcare
Education
Retail & advertising
others
Request for Segment Customization as per your Business Requirement: Segment Customization Request
REGIONAL COVERAGE:
North America
US
Canada
Mexico
Europe
Eastern Europe
Poland
Romania
Hungary
Turkey
Rest of Eastern Europe
Western Europe
Germany
France
UK
Italy
Spain
Netherlands
Switzerland
Austria
Rest of Western Europe
Asia Pacific
China
India
Japan
South Korea
Vietnam
Singapore
Australia
Rest of Asia Pacific
Middle East & Africa
Middle East
UAE
Egypt
Saudi Arabia
Qatar
Rest of the Middle East
Africa
Nigeria
South Africa
Rest of Africa
Latin America
Brazil
Argentina
Colombia
Rest Of Latin America
Request for Country Level Research Report: Country Level Customization Request
Available Customization
With the given market data, SNS Insider offers customization as per the company’s specific needs. The following customization options are available for the report:
Product Analysis
Criss-Cross segment analysis (e.g. Product X Application)
Product Matrix which gives a detailed comparison of product portfolio of each company
Geographic Analysis
Additional countries in any of the regions
Company Information
Detailed analysis and profiling of additional market players (Up to five)
The LED Drivers Market Size was valued at USD 46.55 Billion in 2023 and is expected to reach USD 105.35 Billion by 2032, and grow at a CAGR of 9.50% over the forecast period 2024-2032
The Hearables Market Size was valued at USD 31.74 billion in 2023 and is expected to grow at a CAGR of 17.49% to reach USD 135.33 billion by 2032.
The SiC Wafer Polishing Market size was valued at USD 0.46 Billion in 2023 and is expected to grow to USD 8.27 Billion by 2032 and grow at a CAGR of 37.86% over the forecast period of 2024-2032.
The Optical Sensors Market Size was valued at USD 23.01 Billion in 2023 and is expected to grow at a CAGR of 11.1% to reach USD 59.11 Billion by 2032.
The Substrates Market size was valued at USD 81.15 Million in 2023 and is expected to grow to USD 535.50 Million by 2032, at a CAGR of 26.6% During 2024-2032
The Steam Trap Market Size was valued at USD 4.14 Billion in 2023 and is expected to grow at a CAGR of 4.09% to reach USD 5.94 Billion by 2032.
Hi! Click one of our member below to chat on Phone