Get More Information on 3D Rendering Market - Request Sample Report
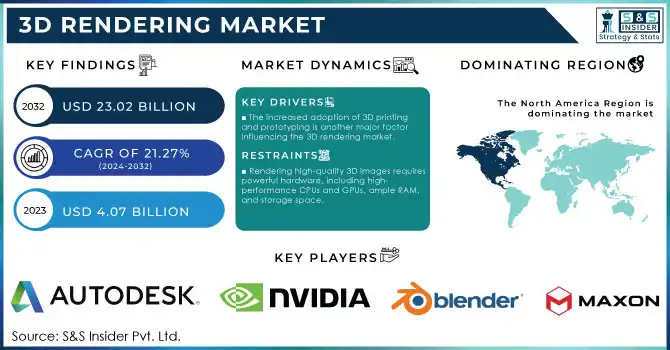
The 3D Rendering Market was valued at USD 4.07 billion in 2023 and is expected to reach USD 23.02 billion by 2032, growing at a CAGR of 21.27% over the forecast period 2024-2032.
The 3D rendering market is experiencing significant growth, driven by several key factors, including the rapid adoption of advanced rendering software and cutting-edge hardware technologies. As augmented reality (AR) and virtual reality (VR) applications continue to gain traction, with around 1.4 billion active AR devices and 90 million users in the United States alone in 2023, demand for 3D visualization and 3D modeling has surged. Approximately three in four adults under the age of 44 are aware of AR, signaling a strong consumer base for AR-powered experiences, which is further fueling market expansion. The rise of digital platforms and e-commerce has also played a critical role, as businesses seek to enhance online shopping experiences with 3D product visualization to improve customer engagement and sales, along with driving market growth.
In industries such as automotive design, the application of 3D rendering is transforming how manufacturers approach product development and marketing. Automotive companies utilize 3D rendering for prototype visualization, virtual vehicle testing, and simulations of aerodynamics, safety features, and structural integrity. This reduces the need for costly physical prototypes, saving both time and money. Moreover, the automotive sector increasingly relies on 3D marketing and advertising to create immersive, visually stunning promotional content, offering consumers an enhanced and realistic experience of new vehicle models. As these trends continue to evolve, the 3D rendering market is expected to expand significantly, fueled by increasing demand across various industries like entertainment, automotive, e-commerce, and more.
Drivers
The growing need for top-notch visualizations in industries like architecture, engineering, automotive, entertainment, and gaming is a key factor driving the 3D rendering market.
Industries that depend on intricate visual representations of designs and prototypes have been utilizing 3D rendering technologies for a long time to generate lifelike simulations. In the field of architecture, 3D rendering enables architects and clients to envision building plans and make changes before beginning construction. Rendering in product design and automotive sectors allows for lifelike prototype simulations, making design and testing processes easier. The desire for lifelike and immersive visuals in gaming and entertainment has driven the utilization of state-of-the-art rendering technologies. Video games are becoming increasingly visually sophisticated, demanding advanced graphics engines that offer lifelike settings and character designs. Likewise, 3D rendering plays a vital role in the film sector for VFX and animation, enabling filmmakers to produce captivating and lifelike visuals that elevate storytelling. Industries are turning to 3D rendering technology more and more to satisfy consumers looking for more realistic and visually impressive experiences.
The increased adoption of 3D printing and prototyping is another major factor influencing the 3D rendering market.
3D printing has transformed product development in different sectors, including manufacturing, automotive, healthcare, and fashion. 3D rendering is necessary to create precise 3D models before beginning the process of 3D printing. Designers and engineers utilize 3D rendering to visually perfect their ideas before creating physical prototypes. For instance, in automotive design, manufacturers depend on 3D rendering to produce intricate models of car components and structures. Before being manufactured with 3D printing technologies, these models can undergo testing for fit, form, and function. Likewise, in the fashion sector, designers utilize 3D rendering to make virtual prototypes of clothing, enabling them to see their designs before manufacturing. This not only decreases the amount of material wasted but also accelerates the process from design to production. As 3D printing becomes more popular in different sectors, there will be an increasing need for top-notch 3D rendering tools to assist in the development of precise models.
Restraints
Rendering high-quality 3D images requires powerful hardware, including high-performance CPUs and GPUs, ample RAM, and storage space.
Many rendering processes are computationally intensive and require substantial processing power. As a result, businesses may need to invest in specialized hardware or upgrade their existing infrastructure to keep up with the demands of modern 3D rendering. For small to medium-sized businesses, the cost of acquiring and maintaining this high-performance hardware can be prohibitive. Even with access to advanced rendering software, without the appropriate hardware, users may face long rendering times and subpar results. This can create delays in project timelines, increasing the overall cost of production. Cloud-based rendering services have mitigated this challenge by providing access to remote computing resources, but they come with their own costs and limitations, such as dependency on a stable internet connection and data security concerns. The high hardware requirements, coupled with the significant financial investment needed to meet them, remain a major restraint for many businesses in the market.
By Component
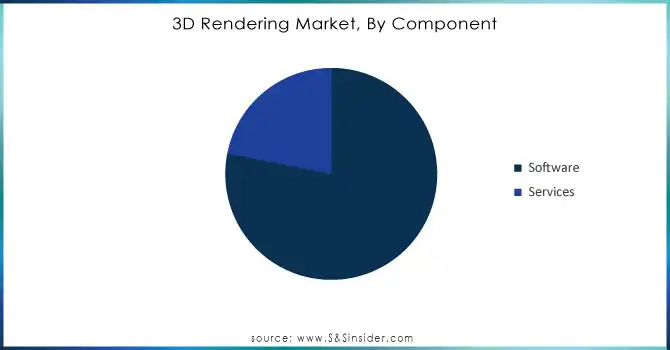
In 2023, the software segment held the majority share of 78% and led the market. Software designed for 3D rendering provides features for generating top-notch, lifelike visuals and animations by utilizing sophisticated algorithms and strong hardware support. These applications are widely utilized in fields like gaming, architecture, automotive design, and film production. Major companies such as Autodesk and Blender offer sophisticated 3D modeling, rendering, and animation software that are commonly utilized in animation studios, design companies, and gaming firms.
The services segment is projected to become the fastest-growing with a raid CAGR during 2024-2032 because of the growing demand for instant, top-notch rendering solutions that don't require large infrastructure investments. Numerous companies choose service-based options to utilize expert 3D rendering without having to keep up with in-house capabilities. Key players like Luxion and Chaos Group provide services such as KeyShot Cloud Rendering and V-Ray Cloud, allowing clients from different industries to complete rendering tasks on external servers, which helps to lower both time and cost.
Need Any Customization Research On 3D Rendering Market - Inquiry Now
By Operating System
In 2023, the Windows segment dominated with a 49% market share, due to its adoption in both professional and consumer sectors, as well as its strong backing of 3D rendering applications. Top 3D rendering software like Autodesk’s 3ds Max, Blender, and V-Ray are well-designed for Windows operating systems. Autodesk and other companies use Windows to support their 3D visualization tools, making it the preferred platform for professionals in the industry.
The MacOS is expected to experience the highest growth rate during 2024-2032 in the 3D rendering market. Apple's emphasis on powerful hardware like the M1 and M2 chips has made MacOS more appealing to those in creative professions. These chips offer excellent performance for tasks such as 3D rendering due to their superior computational power. Moreover, MacOS provides smooth compatibility with sophisticated rendering software such as Cinema 4D, Autodesk Maya, and Blender, specifically designed to perform well on Apple devices.
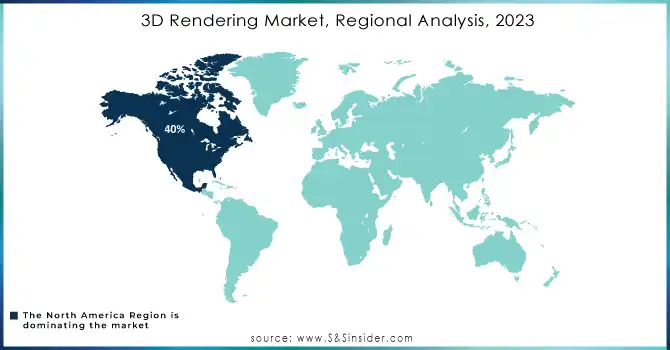
In 2023, North America held a 40% market share and led the market, due to the notable existence of important competitors, progress in technology, and high need in sectors like entertainment, gaming, automotive, and architecture. North America also benefits from significant investments in research and development, as well as the widespread use of 3D rendering technologies. The entertainment sector, especially Hollywood studios, and video game firms like Epic Games utilize sophisticated 3D rendering in their work.
The APAC region is projected to experience the highest growth rate during 2024-2032, fueled by quick technological integration and industrial expansion in nations such as China, India, and Japan. Autodesk, Blender, and Chaos Group are prominent companies that have solidified their presence in the region by offering 3D rendering software solutions to various industries. For instance, the gaming industry in Japan, including Sony and Nintendo, heavily relies on 3D rendering for game development and visual enhancements.
The major key players in the 3D Rendering Market are:
Autodesk (Autodesk 3ds Max, Autodesk Maya)
Chaos Group (V-Ray, Chaos Phoenix)
NVIDIA (NVIDIA Iray, NVIDIA Omniverse)
Blender Foundation (Blender, Cycles)
Maxon (Cinema 4D, Redshift)
Solid Angle (Arnold, Arnold GPU)
Luxion (KeyShot, KeyVR)
Unity Technologies (Unity 3D, Unity Reflect)
Epic Games (Unreal Engine, Quixel Megascans)
Red Giant (Universe, Magic Bullet Suite)
Otoy (OctaneRender, OTOY Render Network)
The Foundry (Maya Render, Modo)
Next Limit Technologies (Maxwell Render, RealFlow)
Pixar Animation Studios (RenderMan, Presto)
Autodessys (FormZ, Rendering Suite)
KeyShot (KeyShot Animation, KeyShotXR)
SimLab Soft (SimLab Composer, SimLab VR Viewer)
Artlantis (Artlantis Render, Artlantis Studio)
Daz 3D (Daz Studio, Daz 3D Render)
LightWave 3D (LightWave Render, LightWave 3D Modeler)
Microsoft
Amazon Web Services (AWS)
Google Cloud
Autodesk
Chaos Group
NVIDIA
Adobe
Red Giant
Maxon
Epic Games
February 2024: Autodesk and Cadence revealed a significant collaboration to revolutionize the way circuit boards and 3D models are designed.
August 2024: Autodesk introduced an AI-driven process named Flow Generative Scheduling for artists and producers, along with additional AI capabilities for its Maya and Flame software.
August 2024: In the initial "Unboxed" event of a series, Chaos, the creator of visualization technology, unveiled its upcoming 2024 roadmap, showcasing new products, tools, and a continued dedication to integrating the entire Chaos ecosystem.
Report Attributes | Details |
---|---|
Market Size in 2023 | USD 4.07 Billion |
Market Size by 2032 | USD 23.02 Billion |
CAGR | CAGR of 21.27% From 2024 to 2032 |
Base Year | 2023 |
Forecast Period | 2024-2032 |
Historical Data | 2020-2022 |
Report Scope & Coverage | Market Size, Segments Analysis, Competitive Landscape, Regional Analysis, DROC & SWOT Analysis, Forecast Outlook |
Key Segments | • By Component (Software, Services) • By Operating System (Windows, MacOS, Linux) • By Organization Size (SMEs, Large Enterprises) • By End User (Architecture, Engineering & Construction, Automotive, Healthcare, Gaming, Manufacturing, Media & Entertainment, Others) |
Regional Analysis/Coverage | North America (US, Canada, Mexico), Europe (Eastern Europe [Poland, Romania, Hungary, Turkey, Rest of Eastern Europe] Western Europe] Germany, France, UK, Italy, Spain, Netherlands, Switzerland, Austria, Rest of Western Europe]), Asia Pacific (China, India, Japan, South Korea, Vietnam, Singapore, Australia, Rest of Asia Pacific), Middle East & Africa (Middle East [UAE, Egypt, Saudi Arabia, Qatar, Rest of Middle East], Africa [Nigeria, South Africa, Rest of Africa], Latin America (Brazil, Argentina, Colombia, Rest of Latin America) |
Company Profiles | Autodesk, Chaos Group, NVIDIA, Blender Foundation, Maxon, Solid Angle, Luxion, Unity Technologies, Epic Games, Red Giant, Otoy, The Foundry, Next Limit Technologies, Pixar Animation Studios, Autodessys, KeyShot, SimLab Soft, Artlantis, Daz 3D, LightWave 3D |
Key Drivers | • The growing need for top-notch visualizations in industries like architecture, engineering, automotive, entertainment, and gaming is a key factor driving the 3D rendering market. • The increased adoption of 3D printing and prototyping is another major factor influencing the 3D rendering market. |
Restraints | • Rendering high-quality 3D images requires powerful hardware, including high-performance CPUs and GPUs, ample RAM, and storage space. |
Ans: The 3D Rendering Market is expected to grow at a CAGR of 21.27% during 2024-2032.
Ans: The 3D Rendering Market was USD 4.07 Billion in 2023 and is expected to Reach USD 23.02 Billion by 2032.
Ans: The growing need for top-notch visualizations in industries like architecture, engineering, automotive, entertainment, and gaming is a key factor driving the 3D rendering market.
Ans: The software segment dominated the 3D Rendering Market.
Ans: North America dominated the 3D Rendering Market in 2023.
Table of Contents
1. Introduction
1.1 Market Definition
1.2 Scope (Inclusion and Exclusions)
1.3 Research Assumptions
2. Executive Summary
2.1 Market Overview
2.2 Regional Synopsis
2.3 Competitive Summary
3. Research Methodology
3.1 Top-Down Approach
3.2 Bottom-up Approach
3.3. Data Validation
3.4 Primary Interviews
4. Market Dynamics Impact Analysis
4.1 Market Driving Factors Analysis
4.1.1 Drivers
4.1.2 Restraints
4.1.3 Opportunities
4.1.4 Challenges
4.2 PESTLE Analysis
4.3 Porter’s Five Forces Model
5. Statistical Insights and Trends Reporting
5.1 Adoption Rate
5.2 Software Subscription Growth
5.3 Network Infrastructure Expansion, by Region
5.4 Integration Capabilities, by Software, 2023
6. Competitive Landscape
6.1 List of Major Companies, By Region
6.2 Market Share Analysis, By Region
6.3 Product Benchmarking
6.3.1 Product specifications and features
6.3.2 Pricing
6.4 Strategic Initiatives
6.4.1 Marketing and promotional activities
6.4.2 Distribution and supply chain strategies
6.4.3 Expansion plans and new product launches
6.4.4 Strategic partnerships and collaborations
6.5 Technological Advancements
6.6 Market Positioning and Branding
7. 3D Rendering Market Segmentation, by Component
7.1 Chapter Overview
7.2 Software
7.2.1 Software Market Trends Analysis (2020-2032)
7.2.2 Software Market Size Estimates and Forecasts to 2032 (USD Billion)
7.3 Services
7.3.1 Services Market Trends Analysis (2020-2032)
7.3.2 Services Market Size Estimates and Forecasts to 2032 (USD Billion)
8. 3D Rendering Market Segmentation, By Operating Systems
8.1 Chapter Overview
8.2 Windows
8.2.1 Windows Market Trends Analysis (2020-2032)
8.2.2 Windows Market Size Estimates and Forecasts to 2032 (USD Billion)
8.3 MacOS
8.3.1 MacOS Market Trends Analysis (2020-2032)
8.3.2 MacOS Market Size Estimates and Forecasts to 2032 (USD Billion)
8.4 Linux
8.4.1 Linux Market Trends Analysis (2020-2032)
8.4.2 Linux Market Size Estimates and Forecasts to 2032 (USD Billion)
9. 3D Rendering Market Segmentation, By Organization Size
9.1 Chapter Overview
9.2 SMEs
9.2.1 SMEs Market Trends Analysis (2020-2032)
9.2.2 SMEs Market Size Estimates and Forecasts to 2032 (USD Billion)
9.3 Large Enterprises
9.3.1 Large Enterprises Market Trends Analysis (2020-2032)
9.3.2 Large Enterprises Market Size Estimates and Forecasts to 2032 (USD Billion)
10. 3D Rendering Market Segmentation, By End User
10.1 Chapter Overview
10.2 Architecture, Engineering & Construction
10.2.1 Architecture, Engineering & Construction Market Trends Analysis (2020-2032)
10.2.2 Architecture, Engineering & Construction Market Size Estimates and Forecasts to 2032 (USD Billion)
10.3 Automotive
10.3.1 Automotive Market Trends Analysis (2020-2032)
10.3.2 Automotive Market Size Estimates and Forecasts to 2032 (USD Billion)
10.4 Media & entertainment
10.4.1 Media & entertainment Market Trends Analysis (2020-2032)
10.4.2 Media & entertainment Market Size Estimates and Forecasts to 2032 (USD Billion)
10.5 Manufacturing
10.5.1 Manufacturing Market Trends Analysis (2020-2032)
10.5.2 Manufacturing Market Size Estimates and Forecasts to 2032 (USD Billion)
10.6 Gaming
10.6.1 Gaming Market Trends Analysis (2020-2032)
10.6.2 Gaming Market Size Estimates and Forecasts to 2032 (USD Billion)
10.7 Healthcare
10.7.1 Healthcare Market Trends Analysis (2020-2032)
10.7.2 Healthcare Market Size Estimates and Forecasts to 2032 (USD Billion)
10.8 Others
10.8.1 Others Market Trends Analysis (2020-2032)
10.8.2 Others Market Size Estimates and Forecasts to 2032 (USD Billion)
11. Regional Analysis
11.1 Chapter Overview
11.2 North America
11.2.1 Trends Analysis
11.2.2 North America 3D Rendering Market Estimates and Forecasts, by Country (2020-2032) (USD Billion)
11.2.3 North America 3D Rendering Market Estimates and Forecasts, by Component (2020-2032) (USD Billion)
11.2.4 North America 3D Rendering Market Estimates and Forecasts, By Operating Systems (2020-2032) (USD Billion)
11.2.5 North America 3D Rendering Market Estimates and Forecasts, By Organization Size (2020-2032) (USD Billion)
11.2.6 North America 3D Rendering Market Estimates and Forecasts, By End User (2020-2032) (USD Billion)
11.2.7 USA
11.2.7.1 USA 3D Rendering Market Estimates and Forecasts, by Component (2020-2032) (USD Billion)
11.2.7.2 USA 3D Rendering Market Estimates and Forecasts, By Operating Systems (2020-2032) (USD Billion)
11.2.7.3 USA 3D Rendering Market Estimates and Forecasts, By Organization Size (2020-2032) (USD Billion)
11.2.7.4 USA 3D Rendering Market Estimates and Forecasts, By End User (2020-2032) (USD Billion)
11.2.8 Canada
11.2.8.1 Canada 3D Rendering Market Estimates and Forecasts, by Component (2020-2032) (USD Billion)
11.2.8.2 Canada 3D Rendering Market Estimates and Forecasts, By Operating Systems (2020-2032) (USD Billion)
11.2.8.3 Canada 3D Rendering Market Estimates and Forecasts, By Organization Size (2020-2032) (USD Billion)
11.2.8.4 Canada 3D Rendering Market Estimates and Forecasts, By End User (2020-2032) (USD Billion)
11.2.9 Mexico
11.2.9.1 Mexico 3D Rendering Market Estimates and Forecasts, by Component (2020-2032) (USD Billion)
11.2.9.2 Mexico 3D Rendering Market Estimates and Forecasts, By Operating Systems (2020-2032) (USD Billion)
11.2.9.3 Mexico 3D Rendering Market Estimates and Forecasts, By Organization Size (2020-2032) (USD Billion)
11.2.9.4 Mexico 3D Rendering Market Estimates and Forecasts, By End User (2020-2032) (USD Billion)
11.3 Europe
11.3.1 Eastern Europe
11.3.1.1 Trends Analysis
11.3.1.2 Eastern Europe 3D Rendering Market Estimates and Forecasts, by Country (2020-2032) (USD Billion)
11.3.1.3 Eastern Europe 3D Rendering Market Estimates and Forecasts, by Component (2020-2032) (USD Billion)
11.3.1.4 Eastern Europe 3D Rendering Market Estimates and Forecasts, By Operating Systems (2020-2032) (USD Billion)
11.3.1.5 Eastern Europe 3D Rendering Market Estimates and Forecasts, By Organization Size (2020-2032) (USD Billion)
11.3.1.6 Eastern Europe 3D Rendering Market Estimates and Forecasts, By End User (2020-2032) (USD Billion)
11.3.1.7 Poland
11.3.1.7.1 Poland 3D Rendering Market Estimates and Forecasts, by Component (2020-2032) (USD Billion)
11.3.1.7.2 Poland 3D Rendering Market Estimates and Forecasts, By Operating Systems (2020-2032) (USD Billion)
11.3.1.7.3 Poland 3D Rendering Market Estimates and Forecasts, By Organization Size (2020-2032) (USD Billion)
11.3.1.7.4 Poland 3D Rendering Market Estimates and Forecasts, By End User (2020-2032) (USD Billion)
11.3.1.8 Romania
11.3.1.8.1 Romania 3D Rendering Market Estimates and Forecasts, by Component (2020-2032) (USD Billion)
11.3.1.8.2 Romania 3D Rendering Market Estimates and Forecasts, By Operating Systems (2020-2032) (USD Billion)
11.3.1.8.3 Romania 3D Rendering Market Estimates and Forecasts, By Organization Size (2020-2032) (USD Billion)
11.3.1.8.4 Romania 3D Rendering Market Estimates and Forecasts, By End User (2020-2032) (USD Billion)
11.3.1.9 Hungary
11.3.1.9.1 Hungary 3D Rendering Market Estimates and Forecasts, by Component (2020-2032) (USD Billion)
11.3.1.9.2 Hungary 3D Rendering Market Estimates and Forecasts, By Operating Systems (2020-2032) (USD Billion)
11.3.1.9.3 Hungary 3D Rendering Market Estimates and Forecasts, By Organization Size (2020-2032) (USD Billion)
11.3.1.9.4 Hungary 3D Rendering Market Estimates and Forecasts, By End User (2020-2032) (USD Billion)
11.3.1.10 Turkey
11.3.1.10.1 Turkey 3D Rendering Market Estimates and Forecasts, by Component (2020-2032) (USD Billion)
11.3.1.10.2 Turkey 3D Rendering Market Estimates and Forecasts, By Operating Systems (2020-2032) (USD Billion)
11.3.1.10.3 Turkey 3D Rendering Market Estimates and Forecasts, By Organization Size (2020-2032) (USD Billion)
11.3.1.10.4 Turkey 3D Rendering Market Estimates and Forecasts, By End User (2020-2032) (USD Billion)
11.3.1.11 Rest of Eastern Europe
11.3.1.11.1 Rest of Eastern Europe 3D Rendering Market Estimates and Forecasts, by Component (2020-2032) (USD Billion)
11.3.1.11.2 Rest of Eastern Europe 3D Rendering Market Estimates and Forecasts, By Operating Systems (2020-2032) (USD Billion)
11.3.1.11.3 Rest of Eastern Europe 3D Rendering Market Estimates and Forecasts, By Organization Size (2020-2032) (USD Billion)
11.3.1.11.4 Rest of Eastern Europe 3D Rendering Market Estimates and Forecasts, By End User (2020-2032) (USD Billion)
11.3.2 Western Europe
11.3.2.1 Trends Analysis
11.3.2.2 Western Europe 3D Rendering Market Estimates and Forecasts, by Country (2020-2032) (USD Billion)
11.3.2.3 Western Europe 3D Rendering Market Estimates and Forecasts, by Component (2020-2032) (USD Billion)
11.3.2.4 Western Europe 3D Rendering Market Estimates and Forecasts, By Operating Systems (2020-2032) (USD Billion)
11.3.2.5 Western Europe 3D Rendering Market Estimates and Forecasts, By Organization Size (2020-2032) (USD Billion)
11.3.2.6 Western Europe 3D Rendering Market Estimates and Forecasts, By End User (2020-2032) (USD Billion)
11.3.2.7 Germany
11.3.2.7.1 Germany 3D Rendering Market Estimates and Forecasts, by Component (2020-2032) (USD Billion)
11.3.2.7.2 Germany 3D Rendering Market Estimates and Forecasts, By Operating Systems (2020-2032) (USD Billion)
11.3.2.7.3 Germany 3D Rendering Market Estimates and Forecasts, By Organization Size (2020-2032) (USD Billion)
11.3.2.7.4 Germany 3D Rendering Market Estimates and Forecasts, By End User (2020-2032) (USD Billion)
11.3.2.8 France
11.3.2.8.1 France 3D Rendering Market Estimates and Forecasts, by Component (2020-2032) (USD Billion)
11.3.2.8.2 France 3D Rendering Market Estimates and Forecasts, By Operating Systems (2020-2032) (USD Billion)
11.3.2.8.3 France 3D Rendering Market Estimates and Forecasts, By Organization Size (2020-2032) (USD Billion)
11.3.2.8.4 France 3D Rendering Market Estimates and Forecasts, By End User (2020-2032) (USD Billion)
11.3.2.9 UK
11.3.2.9.1 UK 3D Rendering Market Estimates and Forecasts, by Component (2020-2032) (USD Billion)
11.3.2.9.2 UK 3D Rendering Market Estimates and Forecasts, By Operating Systems (2020-2032) (USD Billion)
11.3.2.9.3 UK 3D Rendering Market Estimates and Forecasts, By Organization Size (2020-2032) (USD Billion)
11.3.2.9.4 UK 3D Rendering Market Estimates and Forecasts, By End User (2020-2032) (USD Billion)
11.3.2.10 Italy
11.3.2.10.1 Italy 3D Rendering Market Estimates and Forecasts, by Component (2020-2032) (USD Billion)
11.3.2.10.2 Italy 3D Rendering Market Estimates and Forecasts, By Operating Systems (2020-2032) (USD Billion)
11.3.2.10.3 Italy 3D Rendering Market Estimates and Forecasts, By Organization Size (2020-2032) (USD Billion)
11.3.2.10.4 Italy 3D Rendering Market Estimates and Forecasts, By End User (2020-2032) (USD Billion)
11.3.2.11 Spain
11.3.2.11.1 Spain 3D Rendering Market Estimates and Forecasts, by Component (2020-2032) (USD Billion)
11.3.2.11.2 Spain 3D Rendering Market Estimates and Forecasts, By Operating Systems (2020-2032) (USD Billion)
11.3.2.11.3 Spain 3D Rendering Market Estimates and Forecasts, By Organization Size (2020-2032) (USD Billion)
11.3.2.11.4 Spain 3D Rendering Market Estimates and Forecasts, By End User (2020-2032) (USD Billion)
11.3.2.12 Netherlands
11.3.2.12.1 Netherlands 3D Rendering Market Estimates and Forecasts, by Component (2020-2032) (USD Billion)
11.3.2.12.2 Netherlands 3D Rendering Market Estimates and Forecasts, By Operating Systems (2020-2032) (USD Billion)
11.3.2.12.3 Netherlands 3D Rendering Market Estimates and Forecasts, By Organization Size (2020-2032) (USD Billion)
11.3.2.12.4 Netherlands 3D Rendering Market Estimates and Forecasts, By End User (2020-2032) (USD Billion)
11.3.2.13 Switzerland
11.3.2.13.1 Switzerland 3D Rendering Market Estimates and Forecasts, by Component (2020-2032) (USD Billion)
11.3.2.13.2 Switzerland 3D Rendering Market Estimates and Forecasts, By Operating Systems (2020-2032) (USD Billion)
11.3.2.13.3 Switzerland 3D Rendering Market Estimates and Forecasts, By Organization Size (2020-2032) (USD Billion)
11.3.2.13.4 Switzerland 3D Rendering Market Estimates and Forecasts, By End User (2020-2032) (USD Billion)
11.3.2.14 Austria
11.3.2.14.1 Austria 3D Rendering Market Estimates and Forecasts, by Component (2020-2032) (USD Billion)
11.3.2.14.2 Austria 3D Rendering Market Estimates and Forecasts, By Operating Systems (2020-2032) (USD Billion)
11.3.2.14.3 Austria 3D Rendering Market Estimates and Forecasts, By Organization Size (2020-2032) (USD Billion)
11.3.2.14.4 Austria 3D Rendering Market Estimates and Forecasts, By End User (2020-2032) (USD Billion)
11.3.2.15 Rest of Western Europe
11.3.2.15.1 Rest of Western Europe 3D Rendering Market Estimates and Forecasts, by Component (2020-2032) (USD Billion)
11.3.2.15.2 Rest of Western Europe 3D Rendering Market Estimates and Forecasts, By Operating Systems (2020-2032) (USD Billion)
11.3.2.15.3 Rest of Western Europe 3D Rendering Market Estimates and Forecasts, By Organization Size (2020-2032) (USD Billion)
11.3.2.15.4 Rest of Western Europe 3D Rendering Market Estimates and Forecasts, By End User (2020-2032) (USD Billion)
11.4 Asia-Pacific
11.4.1 Trends Analysis
11.4.2 Asia-Pacific 3D Rendering Market Estimates and Forecasts, by Country (2020-2032) (USD Billion)
11.4.3 Asia-Pacific 3D Rendering Market Estimates and Forecasts, by Component (2020-2032) (USD Billion)
11.4.4 Asia-Pacific 3D Rendering Market Estimates and Forecasts, By Operating Systems (2020-2032) (USD Billion)
11.4.5 Asia-Pacific 3D Rendering Market Estimates and Forecasts, By Organization Size (2020-2032) (USD Billion)
11.4.6 Asia-Pacific 3D Rendering Market Estimates and Forecasts, By End User (2020-2032) (USD Billion)
11.4.7 China
11.4.7.1 China 3D Rendering Market Estimates and Forecasts, by Component (2020-2032) (USD Billion)
11.4.7.2 China 3D Rendering Market Estimates and Forecasts, By Operating Systems (2020-2032) (USD Billion)
11.4.7.3 China 3D Rendering Market Estimates and Forecasts, By Organization Size (2020-2032) (USD Billion)
11.4.7.4 China 3D Rendering Market Estimates and Forecasts, By End User (2020-2032) (USD Billion)
11.4.8 India
11.4.8.1 India 3D Rendering Market Estimates and Forecasts, by Component (2020-2032) (USD Billion)
11.4.8.2 India 3D Rendering Market Estimates and Forecasts, By Operating Systems (2020-2032) (USD Billion)
11.4.8.3 India 3D Rendering Market Estimates and Forecasts, By Organization Size (2020-2032) (USD Billion)
11.4.8.4 India 3D Rendering Market Estimates and Forecasts, By End User (2020-2032) (USD Billion)
11.4.9 Japan
11.4.9.1 Japan 3D Rendering Market Estimates and Forecasts, by Component (2020-2032) (USD Billion)
11.4.9.2 Japan 3D Rendering Market Estimates and Forecasts, By Operating Systems (2020-2032) (USD Billion)
11.4.9.3 Japan 3D Rendering Market Estimates and Forecasts, By Organization Size (2020-2032) (USD Billion)
11.4.9.4 Japan 3D Rendering Market Estimates and Forecasts, By End User (2020-2032) (USD Billion)
11.4.10 South Korea
11.4.10.1 South Korea 3D Rendering Market Estimates and Forecasts, by Component (2020-2032) (USD Billion)
11.4.10.2 South Korea 3D Rendering Market Estimates and Forecasts, By Operating Systems (2020-2032) (USD Billion)
11.4.10.3 South Korea 3D Rendering Market Estimates and Forecasts, By Organization Size (2020-2032) (USD Billion)
11.4.10.4 South Korea 3D Rendering Market Estimates and Forecasts, By End User (2020-2032) (USD Billion)
11.4.11 Vietnam
11.4.11.1 Vietnam 3D Rendering Market Estimates and Forecasts, by Component (2020-2032) (USD Billion)
11.4.11.2 Vietnam 3D Rendering Market Estimates and Forecasts, By Operating Systems (2020-2032) (USD Billion)
11.4.11.3 Vietnam 3D Rendering Market Estimates and Forecasts, By Organization Size (2020-2032) (USD Billion)
11.4.11.4 Vietnam 3D Rendering Market Estimates and Forecasts, By End User (2020-2032) (USD Billion)
11.4.12 Singapore
11.4.12.1 Singapore 3D Rendering Market Estimates and Forecasts, by Component (2020-2032) (USD Billion)
11.4.12.2 Singapore 3D Rendering Market Estimates and Forecasts, By Operating Systems (2020-2032) (USD Billion)
11.4.12.3 Singapore 3D Rendering Market Estimates and Forecasts, By Organization Size (2020-2032) (USD Billion)
11.4.12.4 Singapore 3D Rendering Market Estimates and Forecasts, By End User (2020-2032) (USD Billion)
11.4.13 Australia
11.4.13.1 Australia 3D Rendering Market Estimates and Forecasts, by Component (2020-2032) (USD Billion)
11.4.13.2 Australia 3D Rendering Market Estimates and Forecasts, By Operating Systems (2020-2032) (USD Billion)
11.4.13.3 Australia 3D Rendering Market Estimates and Forecasts, By Organization Size (2020-2032) (USD Billion)
11.4.13.4 Australia 3D Rendering Market Estimates and Forecasts, By End User (2020-2032) (USD Billion)
11.4.14 Rest of Asia-Pacific
11.4.14.1 Rest of Asia-Pacific 3D Rendering Market Estimates and Forecasts, by Component (2020-2032) (USD Billion)
11.4.14.2 Rest of Asia-Pacific 3D Rendering Market Estimates and Forecasts, By Operating Systems (2020-2032) (USD Billion)
11.4.14.3 Rest of Asia-Pacific 3D Rendering Market Estimates and Forecasts, By Organization Size (2020-2032) (USD Billion)
11.4.14.4 Rest of Asia-Pacific 3D Rendering Market Estimates and Forecasts, By End User (2020-2032) (USD Billion)
11.5 Middle East and Africa
11.5.1 Middle East
11.5.1.1 Trends Analysis
11.5.1.2 Middle East 3D Rendering Market Estimates and Forecasts, by Country (2020-2032) (USD Billion)
11.5.1.3 Middle East 3D Rendering Market Estimates and Forecasts, by Component (2020-2032) (USD Billion)
11.5.1.4 Middle East 3D Rendering Market Estimates and Forecasts, By Operating Systems (2020-2032) (USD Billion)
11.5.1.5 Middle East 3D Rendering Market Estimates and Forecasts, By Organization Size (2020-2032) (USD Billion)
11.5.1.6 Middle East 3D Rendering Market Estimates and Forecasts, By End User (2020-2032) (USD Billion)
11.5.1.7 UAE
11.5.1.7.1 UAE 3D Rendering Market Estimates and Forecasts, by Component (2020-2032) (USD Billion)
11.5.1.7.2 UAE 3D Rendering Market Estimates and Forecasts, By Operating Systems (2020-2032) (USD Billion)
11.5.1.7.3 UAE 3D Rendering Market Estimates and Forecasts, By Organization Size (2020-2032) (USD Billion)
11.5.1.7.4 UAE 3D Rendering Market Estimates and Forecasts, By End User (2020-2032) (USD Billion)
11.5.1.8 Egypt
11.5.1.8.1 Egypt 3D Rendering Market Estimates and Forecasts, by Component (2020-2032) (USD Billion)
11.5.1.8.2 Egypt 3D Rendering Market Estimates and Forecasts, By Operating Systems (2020-2032) (USD Billion)
11.5.1.8.3 Egypt 3D Rendering Market Estimates and Forecasts, By Organization Size (2020-2032) (USD Billion)
11.5.1.8.4 Egypt 3D Rendering Market Estimates and Forecasts, By End User (2020-2032) (USD Billion)
11.5.1.9 Saudi Arabia
11.5.1.9.1 Saudi Arabia 3D Rendering Market Estimates and Forecasts, by Component (2020-2032) (USD Billion)
11.5.1.9.2 Saudi Arabia 3D Rendering Market Estimates and Forecasts, By Operating Systems (2020-2032) (USD Billion)
11.5.1.9.3 Saudi Arabia 3D Rendering Market Estimates and Forecasts, By Organization Size (2020-2032) (USD Billion)
11.5.1.9.4 Saudi Arabia 3D Rendering Market Estimates and Forecasts, By End User (2020-2032) (USD Billion)
11.5.1.10 Qatar
11.5.1.10.1 Qatar 3D Rendering Market Estimates and Forecasts, by Component (2020-2032) (USD Billion)
11.5.1.10.2 Qatar 3D Rendering Market Estimates and Forecasts, By Operating Systems (2020-2032) (USD Billion)
11.5.1.10.3 Qatar 3D Rendering Market Estimates and Forecasts, By Organization Size (2020-2032) (USD Billion)
11.5.1.10.4 Qatar 3D Rendering Market Estimates and Forecasts, By End User (2020-2032) (USD Billion)
11.5.1.11 Rest of Middle East
11.5.1.11.1 Rest of Middle East 3D Rendering Market Estimates and Forecasts, by Component (2020-2032) (USD Billion)
11.5.1.11.2 Rest of Middle East 3D Rendering Market Estimates and Forecasts, By Operating Systems (2020-2032) (USD Billion)
11.5.1.11.3 Rest of Middle East 3D Rendering Market Estimates and Forecasts, By Organization Size (2020-2032) (USD Billion)
11.5.1.11.4 Rest of Middle East 3D Rendering Market Estimates and Forecasts, By End User (2020-2032) (USD Billion)
11.5.2 Africa
11.5.2.1 Trends Analysis
11.5.2.2 Africa 3D Rendering Market Estimates and Forecasts, by Country (2020-2032) (USD Billion)
11.5.2.3 Africa 3D Rendering Market Estimates and Forecasts, by Component (2020-2032) (USD Billion)
11.5.2.4 Africa 3D Rendering Market Estimates and Forecasts, By Operating Systems (2020-2032) (USD Billion)
11.5.2.5 Africa 3D Rendering Market Estimates and Forecasts, By Organization Size (2020-2032) (USD Billion)
11.5.2.6 Africa 3D Rendering Market Estimates and Forecasts, By End User (2020-2032) (USD Billion)
11.5.2.7 South Africa
11.5.2.7.1 South Africa 3D Rendering Market Estimates and Forecasts, by Component (2020-2032) (USD Billion)
11.5.2.7.2 South Africa 3D Rendering Market Estimates and Forecasts, By Operating Systems (2020-2032) (USD Billion)
11.5.2.7.3 South Africa 3D Rendering Market Estimates and Forecasts, By Organization Size (2020-2032) (USD Billion)
11.5.2.7.4 South Africa 3D Rendering Market Estimates and Forecasts, By End User (2020-2032) (USD Billion)
11.5.2.8 Nigeria
11.5.2.8.1 Nigeria 3D Rendering Market Estimates and Forecasts, by Component (2020-2032) (USD Billion)
11.5.2.8.2 Nigeria 3D Rendering Market Estimates and Forecasts, By Operating Systems (2020-2032) (USD Billion)
11.5.2.8.3 Nigeria 3D Rendering Market Estimates and Forecasts, By Organization Size (2020-2032) (USD Billion)
11.5.2.8.4 Nigeria 3D Rendering Market Estimates and Forecasts, By End User (2020-2032) (USD Billion)
11.5.2.9 Rest of Africa
11.5.2.9.1 Rest of Africa 3D Rendering Market Estimates and Forecasts, by Component (2020-2032) (USD Billion)
11.5.2.9.2 Rest of Africa 3D Rendering Market Estimates and Forecasts, By Operating Systems (2020-2032) (USD Billion)
11.5.2.9.3 Rest of Africa 3D Rendering Market Estimates and Forecasts, By Organization Size (2020-2032) (USD Billion)
11.5.2.9.4 Rest of Africa 3D Rendering Market Estimates and Forecasts, By End User (2020-2032) (USD Billion)
11.6 Latin America
11.6.1 Trends Analysis
11.6.2 Latin America 3D Rendering Market Estimates and Forecasts, by Country (2020-2032) (USD Billion)
11.6.3 Latin America 3D Rendering Market Estimates and Forecasts, by Component (2020-2032) (USD Billion)
11.6.4 Latin America 3D Rendering Market Estimates and Forecasts, By Operating Systems (2020-2032) (USD Billion)
11.6.5 Latin America 3D Rendering Market Estimates and Forecasts, By Organization Size (2020-2032) (USD Billion)
11.6.6 Latin America 3D Rendering Market Estimates and Forecasts, By End User (2020-2032) (USD Billion)
11.6.7 Brazil
11.6.7.1 Brazil 3D Rendering Market Estimates and Forecasts, by Component (2020-2032) (USD Billion)
11.6.7.2 Brazil 3D Rendering Market Estimates and Forecasts, By Operating Systems (2020-2032) (USD Billion)
11.6.7.3 Brazil 3D Rendering Market Estimates and Forecasts, By Organization Size (2020-2032) (USD Billion)
11.6.7.4 Brazil 3D Rendering Market Estimates and Forecasts, By End User (2020-2032) (USD Billion)
11.6.8 Argentina
11.6.8.1 Argentina 3D Rendering Market Estimates and Forecasts, by Component (2020-2032) (USD Billion)
11.6.8.2 Argentina 3D Rendering Market Estimates and Forecasts, By Operating Systems (2020-2032) (USD Billion)
11.6.8.3 Argentina 3D Rendering Market Estimates and Forecasts, By Organization Size (2020-2032) (USD Billion)
11.6.8.4 Argentina 3D Rendering Market Estimates and Forecasts, By End User (2020-2032) (USD Billion)
11.6.9 Colombia
11.6.9.1 Colombia 3D Rendering Market Estimates and Forecasts, by Component (2020-2032) (USD Billion)
11.6.9.2 Colombia 3D Rendering Market Estimates and Forecasts, By Operating Systems (2020-2032) (USD Billion)
11.6.9.3 Colombia 3D Rendering Market Estimates and Forecasts, By Organization Size (2020-2032) (USD Billion)
11.6.9.4 Colombia 3D Rendering Market Estimates and Forecasts, By End User (2020-2032) (USD Billion)
11.6.10 Rest of Latin America
11.6.10.1 Rest of Latin America 3D Rendering Market Estimates and Forecasts, by Component (2020-2032) (USD Billion)
11.6.10.2 Rest of Latin America 3D Rendering Market Estimates and Forecasts, By Operating Systems (2020-2032) (USD Billion)
11.6.10.3 Rest of Latin America 3D Rendering Market Estimates and Forecasts, By Organization Size (2020-2032) (USD Billion)
11.6.10.4 Rest of Latin America 3D Rendering Market Estimates and Forecasts, By End User (2020-2032) (USD Billion)
12. Company Profiles
12.1 Autodesk
12.1.1 Company Overview
12.1.2 Financial
12.1.3 Products/ Services Offered
12.1.4 SWOT Analysis
12.2 Chaos Group
12.2.1 Company Overview
12.2.2 Financial
12.2.3 Products/ Services Offered
12.2.4 SWOT Analysis
12.3 NVIDIA
12.3.1 Company Overview
12.3.2 Financial
12.3.3 Products/ Services Offered
12.3.4 SWOT Analysis
12.4 Blender Foundation
12.4.1 Company Overview
12.4.2 Financial
12.4.3 Products/ Services Offered
12.4.4 SWOT Analysis
12.5 Maxon
12.5.1 Company Overview
12.5.2 Financial
12.5.3 Products/ Services Offered
12.5.4 SWOT Analysis
12.6 Solid Angle
12.6.1 Company Overview
12.6.2 Financial
12.6.3 Products/ Services Offered
12.6.4 SWOT Analysis
12.7 Luxion
12.7.1 Company Overview
12.7.2 Financial
12.7.3 Products/ Services Offered
12.7.4 SWOT Analysis
12.8 Unity Technologies
12.8.1 Company Overview
12.8.2 Financial
12.8.3 Products/ Services Offered
12.8.4 SWOT Analysis
12.9 Epic Games
12.9.1 Company Overview
12.9.2 Financial
12.9.3 Products/ Services Offered
12.9.4 SWOT Analysis
12.10 Pixar Animation Studios
12.10.1 Company Overview
12.10.2 Financial
12.10.3 Products/ Services Offered
12.10.4 SWOT Analysis
13. Use Cases and Best Practices
14. Conclusion
An accurate research report requires proper strategizing as well as implementation. There are multiple factors involved in the completion of good and accurate research report and selecting the best methodology to compete the research is the toughest part. Since the research reports we provide play a crucial role in any company’s decision-making process, therefore we at SNS Insider always believe that we should choose the best method which gives us results closer to reality. This allows us to reach at a stage wherein we can provide our clients best and accurate investment to output ratio.
Each report that we prepare takes a timeframe of 350-400 business hours for production. Starting from the selection of titles through a couple of in-depth brain storming session to the final QC process before uploading our titles on our website we dedicate around 350 working hours. The titles are selected based on their current market cap and the foreseen CAGR and growth.
The 5 steps process:
Step 1: Secondary Research:
Secondary Research or Desk Research is as the name suggests is a research process wherein, we collect data through the readily available information. In this process we use various paid and unpaid databases which our team has access to and gather data through the same. This includes examining of listed companies’ annual reports, Journals, SEC filling etc. Apart from this our team has access to various associations across the globe across different industries. Lastly, we have exchange relationships with various university as well as individual libraries.
Step 2: Primary Research
When we talk about primary research, it is a type of study in which the researchers collect relevant data samples directly, rather than relying on previously collected data. This type of research is focused on gaining content specific facts that can be sued to solve specific problems. Since the collected data is fresh and first hand therefore it makes the study more accurate and genuine.
We at SNS Insider have divided Primary Research into 2 parts.
Part 1 wherein we interview the KOLs of major players as well as the upcoming ones across various geographic regions. This allows us to have their view over the market scenario and acts as an important tool to come closer to the accurate market numbers. As many as 45 paid and unpaid primary interviews are taken from both the demand and supply side of the industry to make sure we land at an accurate judgement and analysis of the market.
This step involves the triangulation of data wherein our team analyses the interview transcripts, online survey responses and observation of on filed participants. The below mentioned chart should give a better understanding of the part 1 of the primary interview.
Part 2: In this part of primary research the data collected via secondary research and the part 1 of the primary research is validated with the interviews from individual consultants and subject matter experts.
Consultants are those set of people who have at least 12 years of experience and expertise within the industry whereas Subject Matter Experts are those with at least 15 years of experience behind their back within the same space. The data with the help of two main processes i.e., FGDs (Focused Group Discussions) and IDs (Individual Discussions). This gives us a 3rd party nonbiased primary view of the market scenario making it a more dependable one while collation of the data pointers.
Step 3: Data Bank Validation
Once all the information is collected via primary and secondary sources, we run that information for data validation. At our intelligence centre our research heads track a lot of information related to the market which includes the quarterly reports, the daily stock prices, and other relevant information. Our data bank server gets updated every fortnight and that is how the information which we collected using our primary and secondary information is revalidated in real time.
Step 4: QA/QC Process
After all the data collection and validation our team does a final level of quality check and quality assurance to get rid of any unwanted or undesired mistakes. This might include but not limited to getting rid of the any typos, duplication of numbers or missing of any important information. The people involved in this process include technical content writers, research heads and graphics people. Once this process is completed the title gets uploader on our platform for our clients to read it.
Step 5: Final QC/QA Process:
This is the last process and comes when the client has ordered the study. In this process a final QA/QC is done before the study is emailed to the client. Since we believe in giving our clients a good experience of our research studies, therefore, to make sure that we do not lack at our end in any way humanly possible we do a final round of quality check and then dispatch the study to the client.
Key Segmentation
By Component
Software
Services
By Operating System
Windows
MacOS
Linux
By Organization Size
SMEs
Large Enterprises
By End User
Architecture, Engineering & Construction
Automotive
Healthcare
Gaming
Manufacturing
Media & entertainment
Others
Request for Segment Customization as per your Business Requirement: Segment Customization Request
REGIONAL COVERAGE:
North America
US
Canada
Mexico
Europe
Eastern Europe
Poland
Romania
Hungary
Turkey
Rest of Eastern Europe
Western Europe
Germany
France
UK
Italy
Spain
Netherlands
Switzerland
Austria
Rest of Western Europe
Asia Pacific
China
India
Japan
South Korea
Vietnam
Singapore
Australia
Rest of Asia Pacific
Middle East & Africa
Middle East
UAE
Egypt
Saudi Arabia
Qatar
Rest of the Middle East
Africa
Nigeria
South Africa
Rest of Africa
Latin America
Brazil
Argentina
Colombia
Rest of Latin America
Request for Country Level Research Report: Country Level Customization Request
Available Customization
With the given market data, SNS Insider offers customization as per the company’s specific needs. The following customization options are available for the report:
Product Analysis
Criss-Cross segment analysis (e.g. Product X Application)
Product Matrix which gives a detailed comparison of the product portfolio of each company
Geographic Analysis
Additional countries in any of the regions
Company Information
Detailed analysis and profiling of additional market players (Up to five)
Fraud Detection and Prevention Market was valued at USD 25.2 billion in 2023 and is expected to reach USD 112.8 billion by 2032, growing at a CAGR of 18.1% from 2024-2032.
IoT Analytics Market was valued at USD 26.90 billion in 2023 and is expected to reach USD 180.36 billion by 2032, growing at a CAGR of 23.60% from 2024-2032.
The Connected Agriculture Market was valued at USD 4.7 billion in 2023 and USD 17.6 billion by 2032, growing at a CAGR of 16.0% from 2024-2032.
The Software as a Service (SaaS) Market size was recorded at USD 335.21 billion in 2023 and is expected to reach USD 1057.8 billion by 2032, growing at a CAGR of 13.62 % over the forecast period of 2024-2032.
Network Security Policy Management Market is expected to grow from USD 19.49 billion in 2023 to USD 36.28 billion by 2032, at a CAGR of 7.17% over 2024-2032.
The Big Data Market was valued at USD 325.4 Billion in 2023 and is expected to reach USD 1035.2 Billion by 2032, growing at a CAGR of 13.74% from 2024-2032.
Hi! Click one of our member below to chat on Phone