image

3D Printing Market Report Scope & Overview:
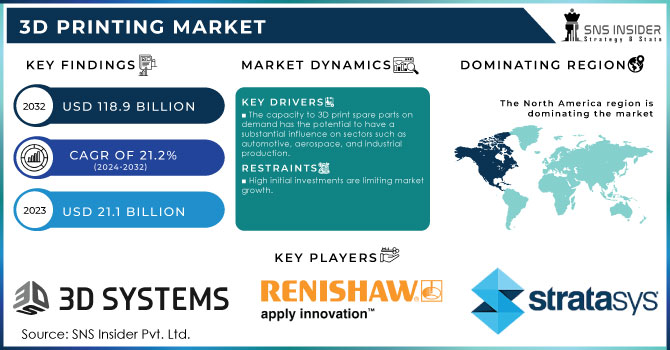
3D Printing Market,Revenue Analysis

Get more information on 3D Printing Market - Request Free Sample Report

3D Printing Market Size was valued at USD 21.1 billion in 2023 and is expected to reach USD 118.9 billion by 2032, growing at a CAGR of 21.2 % over the forecast period 2024-2032.

The 3D printing market is growing rapidly because of continuous advancements in technology, and diverse application upgrades. As a result of research and development, manufacturers introduced printers that are more sophisticated than their predecessors and are able to create complicated objects with higher precision and speed. Additionally, the market is characterized by a high rate of mergers and acquisitions, as companies seek to consolidate, access complementary technologies, expand portfolios, and remain competitive in this dynamic and evolving landscape.

Additive manufacturing is known as 3D printing in industrial settings, involves the layer-by-layer addition of material to create objects based on three-dimensional files, using specialized software and 3D printers. Printing with addictive manufacturing helps to produce prototypes, design, modelling, and production. It assists manufacturers decrease time to market and lower output costs developing and producing products with superior quality at prices that are competitive. Manufacturers are anticipated to use 3D printing for shorter production times iincreasing demand for 3D printers, particularly in the small and medium manufacturing industries, is restricted by misconceptions regarding prototyping. However, misconceptions about prototyping, particularly among small and medium-sized enterprises (SMEs), are slowing adoption. Many SMEs view prototyping as an expensive pre-manufacturing phase rather than recognizing its value. This, along with limited technical knowledge and standard process controls, hampers market growth.

Market Dynamics

Drivers

  • The capacity to 3D print spare parts on demand has the potential to have a substantial influence on sectors such as automotive, aerospace, and industrial production.

  • Innovations in 3D printing technologies, such as improved materials and faster printing speeds, are driving market growth by expanding the range of applications and enhancing efficiency.

  • The ability to produce highly customized and personalized products is a significant driver, especially in industries like healthcare, automotive, and consumer goods, where tailored solutions are increasingly valued.

  • Governments throughout the world are investing in 3D printing initiatives.

Governments throughout the world are launching projects and sponsoring educational institutions, research centers, and research and technology organizations to further investigate and stimulate the development of 3D printing technology. The United States, the United Kingdom, and Canada have all launched government programs aimed at fostering university-level 3D printing research, accelerating technological innovation, and establishing start-ups. The advent of novel uses for 3D printing has piqued the interest of businesses and governments all around the world.

Restrains

  • High initial investments are limiting market growth.

  • While 3D printing excels in rapid prototyping, it may struggle with scalability and production speed compared to traditional mass manufacturing methods, affecting its adoption for high-volume production.

  • The ease of copying designs in 3D printing can lead to intellectual property issues and potential legal disputes, which may deter some companies from fully embracing the technology.

The most major impediment to the implementation of this technology is the high initial expenditure. This cost includes hardware, software, materials, certification, additive and manufacturing education, and people training. The cash and resources necessary to set up a 3-dimensional system are significantly more than those required for standard printing technologies. Manufacturers, on the other hand, are assisting end users in lowering the high initial costs with the advent of the industrial desktop 3D printer.  Desktop printers are less costly and easier to operate than 3-dimensional systems.

Opportunities

  • Emerging 3D printing uses in automotive, printed electronics, jewelry, and education

  • Rapid prototyping is becoming increasingly popular and research and development opportunities are rising.

Segment analysis

By Component

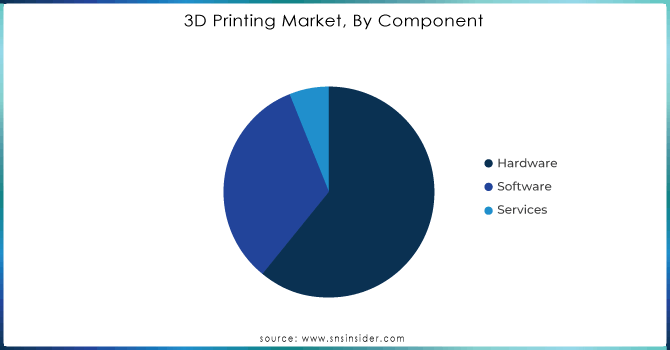
The hardware segment led the 3D printing market in 2023, accounting for over 61% of the global revenue. This growth was surging due to the expanding demand for rapid prototyping and advanced manufacturing practices. The key drivers of the hardware segment’s expansion are rapid industrialization, expanding uptake of consumer electronics, growing development of civil infrastructure, continued rapid urbanization, and optimized labour rates.

The software segment is expected to record significant CAGR over the forecast period. The use of 3D software is vital for many industries, as it enables oriented design of objects and parts for printing. As more and more manufacturing companies are drifting from their engraved practices, the use of 3D printing software surges, improving the efficiency of producing multiple manufacturing parts. The shift towards digital design and production processes is expected to further fuel the adoption of 3D printing software in the coming years.
3D-Printing-Market-By-Component

Need any customization research on 3D Printing Market - Enquiry Now

By Technology

The 3D printing market in 2023 was led by the stereolithography segment, which accounted for over 10.2% of global revenue. Stereolithography is one of the oldest and most traditional technologies of 3D printing. However, conduction of research and the development of new technologies are creating favorable growth opportunities for the most efficient and reliable alternatives.

Although fused deposition modeling holds one of the significant shares of revenue as of 2023, it is also used in various 3D printing processes. Meanwhile, other technologies, such as DLP, EBM, inkjet printing, and DMLS, will capitalize on specialized additive manufacturing processes in the forecast period. The increased demand in industries like aerospace, defense, healthcare, and automotive will enable the utilization of some of the advanced technologies, thereby paving the way for innovation and the growth of the 3D printing market.

By Application

In 2023, the prototyping market segment led the 3D printing market, with more than 53% of the global revenue. The prototyping market segment’s leading position can be justified by its popularity among all other market sections that include the automotive, aerospace, and defense industries. It is beneficial to use prototyping in the precise design and creation of parts, components, and larger complex systems as a means of accurate design and development. With additional possibilities to increase accuracy and improve the reliability of the results, it is more than likely that the prototyping segment will maintain the leading positions in the market in the long-term and short-term perspectives. Though the final part’s creating also involves the functional section with the development of smaller details of a particular metal, including joints and connectors, which is vital in the machinery and systems development, so far, the necessity of the prototyping segment is greater.

The functional parts market segment is expected to grow with the significant compound annual growth rate from 2024 to 2032 due to the analyzed increasing interest in designing and manufacturing functional parts connected to the higher demand for the components with the increased level of precision.

Regional Insights

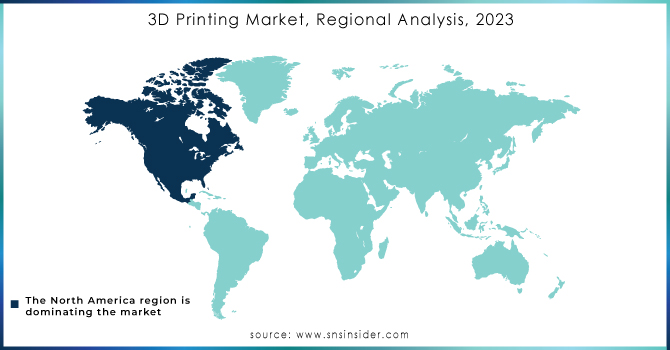
The 3D printing market was dominated by North America in 2023, which held over 34% of total revenue share. This occurred largely due to the extensive implementation of additive manufacturing across the region. The U.S. and Canada were among the first countries to adopt these technologies into all branches of manufacturing. In the U.S., the growth of the 3D printing market is primarily associated with the popularity of technology as a permit to rapid prototyping and product development. This allows additive manufacturing to actively develop in aerospace, automotive, healthcare, and consumer goods, which leads to its broad application.

Asia Pacific region is growing with the highest CAGR during the forecast period of 2024 to 2032. The large spread of additive manufacturing in the region is due to its significant progress and advancement in the manufacturing sector. There is also an assumption that the Asia Pacific region strives to become a production point of automotive and healthcare industries in addition to consumer electronics. Centralized on the production of consumer electronics devices, as well as significant progress in rapid local urbanization, allows us to highlight the high potential of 3D printing demand in the region.
3D-Printing-Market-Regional-Analysis-2023

Key Players

  • Stratasys Ltd. (F370 CR, J750 Digital Anatomy)

  • 3D Systems Corporation (ProX 800, Figure 4 Standalone)

  • Materialise NV (Mimics Innovation Suite, Magics)

  • GE Additive (Concept Laser M2 Series 5, Binder Jet Line)

  • HP Inc. (Jet Fusion 5200 Series, Metal Jet S100)

  • SLM Solutions Group AG (SLM® 280 2.0, NXG XII 600)

  • EOS GmbH (EOS M 300-4, EOS P 500)

  • Voxeljet AG (VX1000, VJET X)

  • Renishaw plc (RenAM 500Q, AM250)

  • Desktop Metal (Production System™ P-50, Fiber™)

  • Carbon, Inc. (M3 Max, Carbon DLS™)

  • Markforged, Inc. (Mark Two, Metal X)

  • ExOne (X1 160Pro, Innovent+®)

  • Ultimaker (Ultimaker S5, Ultimaker 3)

  • XYZprinting (da Vinci Pro 3-in-1, da Vinci Super)

  • Tiertime (Beijing TierTime Technology Co. Ltd.) (UP300, Cetus MK3)

  • Formlabs (Form 3B+, Fuse 1)

  • Zortrax (M300 Plus, Endureal)

  • Proto Labs, Inc. (3D Printed Prototypes, Injection Molding)

  • Raise3D Technologies, Inc. (Pro2 Plus, RMF500)

and others in final Report.

Recent development

  • In March 2023, Neotech AMT entered a partnership with APES with the goal of expanding the reach of 3D printed electronics in North America. It can be concluded that the partnership allows the companies to utilize the resources and technologies of one another. This way, it is possible to improve the development and manufacturing capacity in additive manufacturing.

  • In November, 2023, the launch of Autodesk AI, a new technology that was embedded into the product lineup of Autodesk Inc. It has been devised to provide the customers with the generative capabilities and intelligent assistance, thus helping them to automate the implementation of their tasks. In turn, such an approach can allow the employees of the companies to reduce task repetition and, as a result, diminish the number of errors.

  • Materialize partnered with Exactech, a producer of new instruments, implants, and other smart technologies for joint replacement surgery, in March 2023 to give enhanced treatment options for patients with severe shoulder abnormalities.

  • Stratasys and Ricoh USA, Inc. will partner in February 2023 to provide on-demand 3D-printed anatomic models for clinical settings. Under this agreement, Stratasys' patient-specific 3D solutions integrated with its 3D printing technology; Axial3D's cloud-based segmentation-as-a-service solution; and Ricoh's precision additive manufacturing services were combined to create a single, convenient solution.

  • Desktop Metal released Einstein Pro XL in February 2023, an economical, high-accuracy, high-throughput 3D printer perfect for dentistry labs, orthodontists, and other medical equipment producers.

3D Printing Market Report Scope:

Report Attributes Details
Market Size in 2023  USD 21.1 Bn
Market Size by 2032  USD 118.9 Bn
CAGR   CAGR of 21.2% From 2024 to 2032
Base Year 2023
Forecast Period  2024-2032
Historical Data  2020-2022
Report Scope & Coverage Market Size, Segments Analysis, Competitive  Landscape, Regional Analysis, DROC & SWOT Analysis, Forecast Outlook
Key Segments • By Component (Hardware, Software, Services)
• By Technology (Stereolithography, Fuse Deposition Modeling, Selective Laser Sintering, Direct Metal Laser Sintering, Polyjet Printing, Inkjet printing, Electron Beam Melting, Laser Metal Deposition, Digital Light Processing, Laminated Object Manufacturing, Others)
• By Process (Powder Bed Fusion, Vat Photopolymerization, Binder Jetting, Material Extrusion, Material Jetting, Others)
• By Application (Prototyping, Tooling, Functional Part Manufacturing)
• By Vertical (Automotive, Aerospace & Defense, Healthcare, Architecture & Construction, Consumer Products, Education, Industrial, Energy, Printed Electronics, Jewelry, Food & Culinary, Others)
Regional Analysis/Coverage North America (US, Canada, Mexico), Europe (Eastern Europe [Poland, Romania, Hungary, Turkey, Rest of Eastern Europe] Western Europe] Germany, France, UK, Italy, Spain, Netherlands, Switzerland, Austria, Rest of Western Europe]). Asia Pacific (China, India, Japan, South Korea, Vietnam, Singapore, Australia, Rest of Asia Pacific), Middle East & Africa (Middle East [UAE, Egypt, Saudi Arabia, Qatar, Rest of Middle East], Africa [Nigeria, South Africa, Rest of Africa], Latin America (Brazil, Argentina, Colombia Rest of Latin America)
Company Profiles 3D Systems, Ultimaker, HP, EOS GmbH, Voxeljet, Materialise, Stratasys, CleanGreen3D Limited, Protolabs, Tiertime Technology, SLM Solutions, Optomec, GE, Groupe Gorgé, Renishaw, Beijing, Autodesk Inc., Made In Space, Canon Inc.
Key Drivers • The capacity to 3D print spare parts on demand has the potential to have a substantial influence on sectors such as automotive, aerospace, and industrial production.
• Governments throughout the world are investing in 3D printing initiatives.
Market Restraints • High initial investments are limiting market growth.

Frequently Asked Questions

Ans:  USD 21.1 billion is the market size of the 3D Printing Market, in 2023.

Ans. The CAGR of the 3D Printing Market for the forecast period 2024-2032 is 21.2%.

Ans: Yes, you can ask for the customization as per your business requirement.

Ans:

  • The capacity to 3D print spare parts on demand has the potential to have a substantial influence on sectors such as automotive, aerospace, and industrial production.
  • Governments throughout the world are investing in 3D printing initiatives.

Ans: There are five segments covered in this report By Offering, By Technology, By Process, By Application, By Vertical.

1. Introduction

1.1 Market Definition

1.2 Scope (Inclusion and Exclusions)

1.3 Research Assumptions

2. Executive Summary

2.1 Market Overview

2.2 Regional Synopsis

2.3 Competitive Summary

3. Research Methodology

3.1 Top-Down Approach

3.2 Bottom-up Approach

3.3. Data Validation

3.4 Primary Interviews

4. Market Dynamics Impact Analysis

4.1 Market Driving Factors Analysis

4.1.1 Drivers

4.1.2 Restraints

4.1.3 Opportunities

4.1.4 Challenges

4.2 PESTLE Analysis

4.3 Porter’s Five Forces Model

5. Statistical Insights and Trends Reporting

5.1 Adoption Rates of Emerging Technologies

5.2 Network Infrastructure Expansion, by Region

5.3 Cybersecurity Incidents, by Region (2020-2023)

5.4 Cloud Services Usage, by Region

6. Competitive Landscape

6.1 List of Major Companies, By Region

6.2 Market Share Analysis, By Region

6.3 Product Benchmarking

6.3.1 Product specifications and features

6.3.2 Pricing

6.4 Strategic Initiatives

6.4.1 Marketing and promotional activities

6.4.2 Distribution and supply chain strategies

6.4.3 Expansion plans and new product launches

6.4.4 Strategic partnerships and collaborations

6.5 Technological Advancements

6.6 Market Positioning and Branding

7. 3D Printing Market Segmentation, By Component

7.1 Chapter Overview

7.2 Hardware

7.2.1 Hardware Market Trends Analysis (2020-2032)

7.2.2 Hardware Market Size Estimates and Forecasts to 2032 (USD Billion)

7.3 Software

7.3.1 Software Market Trends Analysis (2020-2032)

7.3.2 Software Market Size Estimates and Forecasts to 2032 (USD Billion)

7.4 Services

7.4.1 Services Market Trends Analysis (2020-2032)

7.4.2 Services Market Size Estimates and Forecasts to 2032 (USD Billion)

8. 3D Printing Market Segmentation, By Technology

8.1 Chapter Overview

8.2 Stereolithography

8.2.1 Stereolithography Market Trends Analysis (2020-2032)

8.2.2 Stereolithography Market Size Estimates And Forecasts To 2032 (USD Billion)

8.3 Fuse Deposition Modeling

8.3.1 Fuse Deposition Modeling Market Trends Analysis (2020-2032)

8.3.2 Fuse Deposition Modeling Market Size Estimates And Forecasts To 2032 (USD Billion)

8.4 Selective Laser Sintering

8.4.1 Selective Laser Sintering Market Trends Analysis (2020-2032)

8.4.2 Selective Laser Sintering Market Size Estimates And Forecasts To 2032 (USD Billion)

8.5 Direct Metal Laser Sintering

8.5.1 Direct Metal Laser Sintering Market Trends Analysis (2020-2032)

8.5.2 Direct Metal Laser Sintering Market Size Estimates And Forecasts To 2032 (USD Billion)

8.6 Polyjet Printing

8.6.1 Polyjet Printing Market Trends Analysis (2020-2032)

8.6.2 Polyjet Printing Market Size Estimates And Forecasts To 2032 (USD Billion)

8.7 Inkjet printing

8.7.1 Inkjet printing Market Trends Analysis (2020-2032)

8.7.2 Inkjet printing Market Size Estimates And Forecasts To 2032 (USD Billion)

8.8 Electron Beam Melting

8.8.1 Electron Beam Melting Market Trends Analysis (2020-2032)

8.8.2 Electron Beam Melting Market Size Estimates And Forecasts To 2032 (USD Billion)

8.9 Laser Metal Deposition

8.9.1 Laser Metal Deposition Market Trends Analysis (2020-2032)

8.9.2 Laser Metal Deposition Market Size Estimates And Forecasts To 2032 (USD Billion)

8.10 Digital Light Processing

8.10.1 Digital Light Processing Market Trends Analysis (2020-2032)

8.10.2 Digital Light Processing Market Size Estimates And Forecasts To 2032 (USD Billion)

8.11 Laminated Object Manufacturing

8.11.1 Laminated Object Manufacturing Market Trends Analysis (2020-2032)

8.11.2 Laminated Object Manufacturing Market Size Estimates And Forecasts To 2032 (USD Billion)

8.12 Others

8.12.1 Others Market Trends Analysis (2020-2032)

8.12.2 Others Market Size Estimates And Forecasts To 2032 (USD Billion)

9. 3D Printing Market Segmentation, By Process

9.1 Chapter Overview

9.2 Powder Bed Fusion

9.2.1 Powder Bed Fusion Market Trends Analysis (2020-2032)

9.2.2 Powder Bed Fusion Market Size Estimates And Forecasts To 2032 (USD Billion)

9.3 Vat Photopolymerization

9.3.1 Vat Photopolymerization Market Trends Analysis (2020-2032)

9.3.2 Vat Photopolymerization Market Size Estimates And Forecasts To 2032 (USD Billion)

9.4 Binder Jetting

9.4.1 Binder Jetting Market Trends Analysis (2020-2032)

9.4.2 Binder Jetting Market Size Estimates And Forecasts To 2032 (USD Billion)

9.5 Material Extrusion

9.5.1 Material Extrusion Market Trends Analysis (2020-2032)

9.5.2 Material Extrusion Market Size Estimates And Forecasts To 2032 (USD Billion)

9.6 Material Jetting

9.6.1 Material Jetting Market Trends Analysis (2020-2032)

9.6.2 Material Jetting Market Size Estimates And Forecasts To 2032 (USD Billion)

9.7 Others

9.7.1 Others Market Trends Analysis (2020-2032)

9.7.2 Others Market Size Estimates And Forecasts To 2032 (USD Billion)

10. 3D Printing Market Segmentation, By Application

10.1 Chapter Overview

10.2 Prototyping

10.2.1 Prototyping Market Trends Analysis (2020-2032)

10.2.2 Prototyping Market Size Estimates And Forecasts To 2032 (USD Billion)

10.3 Tooling

10.3.1 Tooling Market Trends Analysis (2020-2032)

10.3.2 Tooling Market Size Estimates And Forecasts To 2032 (USD Billion)

10.4 Functional Part Manufacturing

10.4.1 Functional Part Manufacturing Market Trends Analysis (2020-2032)

10.4.2 Functional Part Manufacturing Market Size Estimates And Forecasts To 2032 (USD Billion)

11. 3D Printing Market Segmentation, By Vertical

11.1 Chapter Overview

11.2 Automotive

11.2.1 Automotive Market Trends Analysis (2020-2032)

11.2.2 Automotive Market Size Estimates And Forecasts To 2032 (USD Billion)

11.3 Aerospace & Defense

11.3.1 Aerospace & Defense Market Trends Analysis (2020-2032)

11.3.2 Aerospace & Defense Market Size Estimates And Forecasts To 2032 (USD Billion)

11.4 Healthcare

11.4.1 Healthcare Market Trends Analysis (2020-2032)

11.4.2 Healthcare Market Size Estimates And Forecasts To 2032 (USD Billion)

11.5 Architecture & Construction

11.5.1 Architecture & Construction Market Trends Analysis (2020-2032)

11.5.2 Architecture & Construction Market Size Estimates And Forecasts To 2032 (USD Billion)

11.6 Consumer Products

11.6.1 Consumer Products Market Trends Analysis (2020-2032)

11.6.2 Consumer Products Market Size Estimates And Forecasts To 2032 (USD Billion)

11.7 Education

11.7.1 Education Market Trends Analysis (2020-2032)

11.7.2 Education Market Size Estimates And Forecasts To 2032 (USD Billion)

11.8 Industrial

11.8.1 Industrial Market Trends Analysis (2020-2032)

11.8.2 Industrial Market Size Estimates And Forecasts To 2032 (USD Billion)

11.9 Energy

11.9.1 Energy Market Trends Analysis (2020-2032)

11.9.2 Energy Market Size Estimates And Forecasts To 2032 (USD Billion)

11.10 Printed Electronics

11.10.1 Printed Electronics Market Trends Analysis (2020-2032)

11.10.2 Printed Electronics Market Size Estimates And Forecasts To 2032 (USD Billion)

11.11 Jewelry

11.11.1 Jewelry Market Trends Analysis (2020-2032)

11.11.2 Jewelry Market Size Estimates And Forecasts To 2032 (USD Billion)

11.12 Food & Culinary

11.12.1 Food & Culinary Market Trends Analysis (2020-2032)

11.12.2 Food & Culinary Market Size Estimates And Forecasts To 2032 (USD Billion)

11.13 Others

11.13.1 Others Market Trends Analysis (2020-2032)

11.13.2 Others Market Size Estimates And Forecasts To 2032 (USD Billion)

12. Regional Analysis

12.1 Chapter Overview

12.2 North America

12.2.1 Trends Analysis

12.2.2 North America 3D Printing Market Estimates And Forecasts, By Country (2020-2032) (USD Billion)

12.2.3 North America 3D Printing Market Estimates And Forecasts, By Component (2020-2032) (USD Billion)

12.2.4 North America 3D Printing Market Estimates And Forecasts, By Technology (2020-2032) (USD Billion)

12.2.5 North America 3D Printing Market Estimates And Forecasts, By Process (2020-2032) (USD Billion)

12.2.6 North America 3D Printing Market Estimates And Forecasts, By Application (2020-2032) (USD Billion)

12.2.7 North America 3D Printing Market Estimates And Forecasts, By Vertical (2020-2032) (USD Billion)

12.2.8 USA

12.2.8.1 USA 3D Printing Market Estimates And Forecasts, By Component (2020-2032) (USD Billion)

12.2.8.2 USA 3D Printing Market Estimates And Forecasts, By Technology (2020-2032) (USD Billion)

12.2.8.3 USA 3D Printing Market Estimates And Forecasts, By Process (2020-2032) (USD Billion)

12.2.8.4 USA 3D Printing Market Estimates And Forecasts, By Application (2020-2032) (USD Billion)

12.2.8.5 USA 3D Printing Market Estimates And Forecasts, By Vertical (2020-2032) (USD Billion)

12.2.9 Canada

12.2.9.1 Canada 3D Printing Market Estimates And Forecasts, By Component (2020-2032) (USD Billion)

12.2.9.2 Canada 3D Printing Market Estimates And Forecasts, By Technology (2020-2032) (USD Billion)

12.2.9.3 Canada 3D Printing Market Estimates And Forecasts, By Process (2020-2032) (USD Billion)

12.2.9.4 Canada 3D Printing Market Estimates And Forecasts, By Application (2020-2032) (USD Billion)

12.2.9.5 Canada 3D Printing Market Estimates And Forecasts, By Vertical (2020-2032) (USD Billion)

12.2.10 Mexico

12.2.10.1 Mexico 3D Printing Market Estimates And Forecasts, By Component (2020-2032) (USD Billion)

12.2.10.2 Mexico 3D Printing Market Estimates And Forecasts, By Technology (2020-2032) (USD Billion)

12.2.10.3 Mexico 3D Printing Market Estimates And Forecasts, By Process (2020-2032) (USD Billion)

12.2.10.4 Mexico 3D Printing Market Estimates And Forecasts, By Application (2020-2032) (USD Billion)

12.2.10.5 Mexico 3D Printing Market Estimates And Forecasts, By Vertical (2020-2032) (USD Billion)

12.3 Europe

12.3.1 Eastern Europe

12.3.1.1 Trends Analysis

12.3.1.2 Eastern Europe 3D Printing Market Estimates And Forecasts, By Country (2020-2032) (USD Billion)

12.3.1.3 Eastern Europe 3D Printing Market Estimates And Forecasts, By Component (2020-2032) (USD Billion)

12.3.1.4 Eastern Europe 3D Printing Market Estimates And Forecasts, By Technology (2020-2032) (USD Billion)

12.3.1.5 Eastern Europe 3D Printing Market Estimates And Forecasts, By Process (2020-2032) (USD Billion)

12.3.1.6 Eastern Europe
3D Printing Market Estimates And Forecasts, By Application (2020-2032) (USD Billion)

12.3.1.7 Eastern Europe 3D Printing Market Estimates And Forecasts, By Vertical (2020-2032) (USD Billion)

12.3.1.8 Poland

12.3.1.8.1 Poland 3D Printing Market Estimates And Forecasts, By Component (2020-2032) (USD Billion)

12.3.1.8.2 Poland 3D Printing Market Estimates And Forecasts, By Technology (2020-2032) (USD Billion)

12.3.1.8.3 Poland 3D Printing Market Estimates And Forecasts, By Process (2020-2032) (USD Billion)


12.3.1.8.4 Poland 3D Printing Market Estimates And Forecasts, By Application (2020-2032) (USD Billion)

12.3.1.8.5 Poland 3D Printing Market Estimates And Forecasts, By Vertical (2020-2032) (USD Billion)

12.3.1.9 Romania

12.3.1.9.1 Romania 3D Printing Market Estimates And Forecasts, By Component (2020-2032) (USD Billion)

12.3.1.9.2 Romania 3D Printing Market Estimates And Forecasts, By Technology (2020-2032) (USD Billion)

12.3.1.9.3 Romania 3D Printing Market Estimates And Forecasts, By Process (2020-2032) (USD Billion)


12.3.1.9.4 Romania 3D Printing Market Estimates And Forecasts, By Application (2020-2032) (USD Billion)


12.3.1.9.5 Romania 3D Printing Market Estimates And Forecasts, By Vertical (2020-2032) (USD Billion)

12.3.1.10 Hungary

12.3.1.10.1 Hungary 3D Printing Market Estimates And Forecasts, By Component (2020-2032) (USD Billion)

12.3.1.10.2 Hungary 3D Printing Market Estimates And Forecasts, By Technology (2020-2032) (USD Billion)

12.3.1.10.3 Hungary 3D Printing Market Estimates And Forecasts, By Process (2020-2032) (USD Billion)


12.3.1.10.4 Hungary 3D Printing Market Estimates And Forecasts, By Application (2020-2032) (USD Billion)

12.3.1.10.5 Hungary
3D Printing Market Estimates And Forecasts, By Vertical (2020-2032) (USD Billion)

12.3.1.11 Turkey

12.3.1.11.1 Turkey 3D Printing Market Estimates And Forecasts, By Component (2020-2032) (USD Billion)

12.3.1.11.2 Turkey 3D Printing Market Estimates And Forecasts, By Technology (2020-2032) (USD Billion)

12.3.1.11.3 Turkey 3D Printing Market Estimates And Forecasts, By Process (2020-2032) (USD Billion)

12.3.1.11.4 Turkey
3D Printing Market Estimates And Forecasts, By Application (2020-2032) (USD Billion)


12.3.1.11.5 Turkey 3D Printing Market Estimates And Forecasts, By Vertical (2020-2032) (USD Billion)


12.3.1.12 Rest Of Eastern Europe

12.3.1.12.1 Rest Of Eastern Europe 3D Printing Market Estimates And Forecasts, By Component (2020-2032) (USD Billion)

12.3.1.12.2 Rest Of Eastern Europe 3D Printing Market Estimates And Forecasts, By Technology (2020-2032) (USD Billion)

12.3.1.12.3 Rest Of Eastern Europe 3D Printing Market Estimates And Forecasts, By Process (2020-2032) (USD Billion)

12.3.1.12.4 Rest Of Eastern Europe
3D Printing Market Estimates And Forecasts, By Application (2020-2032) (USD Billion)

12.3.1.12.5 Rest Of Eastern Europe
3D Printing Market Estimates And Forecasts, By Vertical (2020-2032) (USD Billion)

12.3.2 Western Europe

12.3.2.1 Trends Analysis

12.3.2.2 Western Europe 3D Printing Market Estimates And Forecasts, By Country (2020-2032) (USD Billion)

12.3.2.3 Western Europe 3D Printing Market Estimates And Forecasts, By Component (2020-2032) (USD Billion)

12.3.2.4 Western Europe 3D Printing Market Estimates And Forecasts, By Technology (2020-2032) (USD Billion)

12.3.2.5 Western Europe 3D Printing Market Estimates And Forecasts, By Process (2020-2032) (USD Billion)

12.3.2.6 Western Europe
3D Printing Market Estimates And Forecasts, By Application (2020-2032) (USD Billion)

12.3.2.7 Western Europe
3D Printing Market Estimates And Forecasts, By Vertical (2020-2032) (USD Billion)

12.3.2.8 Germany

12.3.2.8.1 Germany 3D Printing Market Estimates And Forecasts, By Component (2020-2032) (USD Billion)

12.3.2.8.2 Germany 3D Printing Market Estimates And Forecasts, By Technology (2020-2032) (USD Billion)

12.3.2.8.3 Germany 3D Printing Market Estimates And Forecasts, By Process (2020-2032) (USD Billion)

12.3.2.8.4 Germany 3D Printing Market Estimates And Forecasts, By Application (2020-2032) (USD Billion)

12.3.2.8.5 Germany 3D Printing Market Estimates And Forecasts, By Vertical (2020-2032) (USD Billion)


12.3.2.9 France

12.3.2.9.1 France 3D Printing Market Estimates And Forecasts, By Component (2020-2032) (USD Billion)

12.3.2.9.2 France 3D Printing Market Estimates And Forecasts, By Technology (2020-2032) (USD Billion)

12.3.2.9.3 France 3D Printing Market Estimates And Forecasts, By Process (2020-2032) (USD Billion)

12.3.2.9.4 France 3D Printing Market Estimates And Forecasts, By Application (2020-2032) (USD Billion)

12.3.2.9.5 France 3D Printing Market Estimates And Forecasts, By Vertical (2020-2032) (USD Billion)

12.3.2.10 UK

12.3.2.10.1 UK 3D Printing Market Estimates And Forecasts, By Component (2020-2032) (USD Billion)

12.3.2.10.2 UK 3D Printing Market Estimates And Forecasts, By Technology (2020-2032) (USD Billion)

12.3.2.10.3 UK 3D Printing Market Estimates And Forecasts, By Process (2020-2032) (USD Billion)

12.3.2.10.4 UK 3D Printing Market Estimates And Forecasts, By Application (2020-2032) (USD Billion)

12.3.2.10.5 UK 3D Printing Market Estimates And Forecasts, By Vertical (2020-2032) (USD Billion)

12.3.2.11 Italy

12.3.2.11.1 Italy 3D Printing Market Estimates And Forecasts, By Component (2020-2032) (USD Billion)

12.3.2.11.2 Italy 3D Printing Market Estimates And Forecasts, By Technology (2020-2032) (USD Billion)

12.3.2.11.3 Italy 3D Printing Market Estimates And Forecasts, By Process (2020-2032) (USD Billion)


12.3.2.11.4 Italy 3D Printing Market Estimates And Forecasts, By Application (2020-2032) (USD Billion)


12.3.2.11.5 Italy 3D Printing Market Estimates And Forecasts, By Vertical (2020-2032) (USD Billion)

12.3.2.12 Spain

12.3.2.12.1 Spain 3D Printing Market Estimates And Forecasts, By Component (2020-2032) (USD Billion)

12.3.2.12.2 Spain 3D Printing Market Estimates And Forecasts, By Technology (2020-2032) (USD Billion)

12.3.2.12.3 Spain 3D Printing Market Estimates And Forecasts, By Process (2020-2032) (USD Billion)


12.3.2.12.4 Spain 3D Printing Market Estimates And Forecasts, By Application (2020-2032) (USD Billion)


12.3.2.12.5 Spain 3D Printing Market Estimates And Forecasts, By Vertical (2020-2032) (USD Billion)

12.3.2.13 Netherlands

12.3.2.13.1 Netherlands 3D Printing Market Estimates And Forecasts, By Component (2020-2032) (USD Billion)

12.3.2.13.2 Netherlands 3D Printing Market Estimates And Forecasts, By Technology (2020-2032) (USD Billion)

12.3.2.13.3 Netherlands 3D Printing Market Estimates And Forecasts, By Process (2020-2032) (USD Billion)


12.3.2.13.4 Netherlands 3D Printing Market Estimates And Forecasts, By Application (2020-2032) (USD Billion)


12.3.2.13.5 Netherlands 3D Printing Market Estimates And Forecasts, By Vertical (2020-2032) (USD Billion)

12.3.2.14 Switzerland

12.3.2.14.1 Switzerland 3D Printing Market Estimates And Forecasts, By Component (2020-2032) (USD Billion)

12.3.2.14.2 Switzerland 3D Printing Market Estimates And Forecasts, By Technology (2020-2032) (USD Billion)

12.3.2.14.3 Switzerland 3D Printing Market Estimates And Forecasts, By Process (2020-2032) (USD Billion)


12.3.2.14.4 Switzerland 3D Printing Market Estimates And Forecasts, By Application (2020-2032) (USD Billion)


12.3.2.12.5 Switzerland 3D Printing Market Estimates And Forecasts, By Vertical (2020-2032) (USD Billion)

12.3.2.15 Austria

12.3.2.15.1 Austria 3D Printing Market Estimates And Forecasts, By Component (2020-2032) (USD Billion)

12.3.2.15.2 Austria 3D Printing Market Estimates And Forecasts, By Technology (2020-2032) (USD Billion)

12.3.2.15.3 Austria 3D Printing Market Estimates And Forecasts, By Process (2020-2032) (USD Billion)


12.3.2.15.4 Austria 3D Printing Market Estimates And Forecasts, By Application (2020-2032) (USD Billion)


12.3.2.15.5 Austria 3D Printing Market Estimates And Forecasts, By Vertical (2020-2032) (USD Billion)

12.3.2.16 Rest Of Western Europe

12.3.2.16.1 Rest Of Western Europe 3D Printing Market Estimates And Forecasts, By Component (2020-2032) (USD Billion)

12.3.2.16.2 Rest Of Western Europe 3D Printing Market Estimates And Forecasts, By Technology (2020-2032) (USD Billion)

12.3.2.16.3 Rest Of Western Europe 3D Printing Market Estimates And Forecasts, By Process (2020-2032) (USD Billion)


12.3.2.16.4 Rest Of Western Europe 3D Printing Market Estimates And Forecasts, By Application (2020-2032) (USD Billion)


12.3.2.16.5 Rest Of Western Europe 3D Printing Market Estimates And Forecasts, By Vertical (2020-2032) (USD Billion)

12.4 Asia Pacific

12.4.1 Trends Analysis

12.4.2 Asia Pacific 3D Printing Market Estimates And Forecasts, By Country (2020-2032) (USD Billion)

12.4.3 Asia Pacific 3D Printing Market Estimates And Forecasts, By Component (2020-2032) (USD Billion)

12.4.4 Asia Pacific 3D Printing Market Estimates And Forecasts, By Technology (2020-2032) (USD Billion)

12.4.5 Asia Pacific 3D Printing Market Estimates And Forecasts, By Process (2020-2032) (USD Billion)


12.4.6 Asia Pacific 3D Printing Market Estimates And Forecasts, By Application (2020-2032) (USD Billion)


12.4.7 Asia Pacific 3D Printing Market Estimates And Forecasts, By Vertical (2020-2032) (USD Billion)

12.4.8 China

12.4.8.1 China 3D Printing Market Estimates And Forecasts, By Component (2020-2032) (USD Billion)

12.4.8.2 China 3D Printing Market Estimates And Forecasts, By Technology (2020-2032) (USD Billion)

12.4.8.3 China 3D Printing Market Estimates And Forecasts, By Process (2020-2032) (USD Billion)


12.4.8.4 China 3D Printing Market Estimates And Forecasts, By Application (2020-2032) (USD Billion)


12.4.8.5 China 3D Printing Market Estimates And Forecasts, By Vertical (2020-2032) (USD Billion)

12.4.9 India

12.4.9.1 India 3D Printing Market Estimates And Forecasts, By Component (2020-2032) (USD Billion)

12.4.9.2 India 3D Printing Market Estimates And Forecasts, By Technology (2020-2032) (USD Billion)

12.4.9.3 India 3D Printing Market Estimates And Forecasts, By Process (2020-2032) (USD Billion)


12.4.9.4 India 3D Printing Market Estimates And Forecasts, By Application (2020-2032) (USD Billion)

12.4.9.5 India 3D Printing Market Estimates And Forecasts, By Vertical (2020-2032) (USD Billion)

12.4.10 Japan

12.4.10.1 Japan 3D Printing Market Estimates And Forecasts, By Component (2020-2032) (USD Billion)

12.4.10.2 Japan 3D Printing Market Estimates And Forecasts, By Technology (2020-2032) (USD Billion)

12.4.10.3 Japan 3D Printing Market Estimates And Forecasts, By Process (2020-2032) (USD Billion)

12.4.10.4 Japan 3D Printing Market Estimates And Forecasts, By Application (2020-2032) (USD Billion)

12.4.10.5 Japan 3D Printing Market Estimates And Forecasts, By Vertical (2020-2032) (USD Billion)

12.4.11 South Korea

12.4.11.1 South Korea 3D Printing Market Estimates And Forecasts, By Component (2020-2032) (USD Billion)

12.4.11.2 South Korea 3D Printing Market Estimates And Forecasts, By Technology (2020-2032) (USD Billion)

12.4.11.3 South Korea 3D Printing Market Estimates And Forecasts, By Process (2020-2032) (USD Billion)

12.4.11.4 South Korea 3D Printing Market Estimates And Forecasts, By Application (2020-2032) (USD Billion)

12.4.11.5 South Korea 3D Printing Market Estimates And Forecasts, By Vertical (2020-2032) (USD Billion)

12.4.12 Vietnam

12.4.12.1 Vietnam 3D Printing Market Estimates And Forecasts, By Component (2020-2032) (USD Billion)

12.4.12.2 Vietnam 3D Printing Market Estimates And Forecasts, By Technology (2020-2032) (USD Billion)

12.4.12.3 Vietnam 3D Printing Market Estimates And Forecasts, By Process (2020-2032) (USD Billion)

12.4.12.4 Vietnam 3D Printing Market Estimates And Forecasts, By Application (2020-2032) (USD Billion)

12.4.12.5 Vietnam 3D Printing Market Estimates And Forecasts, By Vertical (2020-2032) (USD Billion)

12.4.13 Singapore

12.4.13.1 Singapore 3D Printing Market Estimates And Forecasts, By Component (2020-2032) (USD Billion)

12.4.13.2 Singapore 3D Printing Market Estimates And Forecasts, By Technology (2020-2032) (USD Billion)

12.4.13.3 Singapore 3D Printing Market Estimates And Forecasts, By Process (2020-2032) (USD Billion)

12.4.13.4 Singapore 3D Printing Market Estimates And Forecasts, By Application (2020-2032) (USD Billion)

12.4.13.5 Singapore 3D Printing Market Estimates And Forecasts, By Vertical (2020-2032) (USD Billion)

12.4.14 Australia

12.4.14.1 Australia 3D Printing Market Estimates And Forecasts, By Component (2020-2032) (USD Billion)

12.4.14.2 Australia 3D Printing Market Estimates And Forecasts, By Technology (2020-2032) (USD Billion)

12.4.14.3 Australia 3D Printing Market Estimates And Forecasts, By Process (2020-2032) (USD Billion)

12.4.14.4 Australia 3D Printing Market Estimates And Forecasts, By Application (2020-2032) (USD Billion)

12.4.14.5 Australia 3D Printing Market Estimates And Forecasts, By Vertical (2020-2032) (USD Billion)

12.4.15 Rest Of Asia Pacific

12.4.15.1 Rest Of Asia Pacific 3D Printing Market Estimates And Forecasts, By Component (2020-2032) (USD Billion)

12.4.15.2 Rest Of Asia Pacific 3D Printing Market Estimates And Forecasts, By Technology (2020-2032) (USD Billion)

12.4.15.3 Rest Of Asia Pacific 3D Printing Market Estimates And Forecasts, By Process (2020-2032) (USD Billion)

12.4.15.4 Rest Of Asia Pacific 3D Printing Market Estimates And Forecasts, By Application (2020-2032) (USD Billion)

12.4.15.5 Rest Of Asia Pacific 3D Printing Market Estimates And Forecasts, By Vertical (2020-2032) (USD Billion)

12.5 Middle East And Africa

12.5.1 Middle East

12.5.1.1 Trends Analysis

12.5.1.2 Middle East 3D Printing Market Estimates And Forecasts, By Country (2020-2032) (USD Billion)

12.5.1.3 Middle East 3D Printing Market Estimates And Forecasts, By Component (2020-2032) (USD Billion)

12.5.1.4 Middle East 3D Printing Market Estimates And Forecasts, By Technology (2020-2032) (USD Billion)

12.5.1.5 Middle East 3D Printing Market Estimates And Forecasts, By Process (2020-2032) (USD Billion)

12.5.1.6 Middle East
3D Printing Market Estimates And Forecasts, By Application (2020-2032) (USD Billion)

12.5.1.7 Middle East
3D Printing Market Estimates And Forecasts, By Vertical (2020-2032) (USD Billion)

12.5.1.8 UAE

12.5.1.8.1 UAE 3D Printing Market Estimates And Forecasts, By Component (2020-2032) (USD Billion)

12.5.1.8.2 UAE 3D Printing Market Estimates And Forecasts, By Technology (2020-2032) (USD Billion)

12.5.1.8.3 UAE 3D Printing Market Estimates And Forecasts, By Process (2020-2032) (USD Billion)

12.5.1.8.4 UAE 3D Printing Market Estimates And Forecasts, By Application (2020-2032) (USD Billion)

12.5.1.8.5 UAE 3D Printing Market Estimates And Forecasts, By Vertical (2020-2032) (USD Billion)

12.5.1.9 Egypt

12.5.1.9.1 Egypt 3D Printing Market Estimates And Forecasts, By Component (2020-2032) (USD Billion)

12.5.1.9.2 Egypt 3D Printing Market Estimates And Forecasts, By Technology (2020-2032) (USD Billion)

12.5.1.9.3 Egypt 3D Printing Market Estimates And Forecasts, By Process (2020-2032) (USD Billion)

12.5.1.9.4 Egypt 3D Printing Market Estimates And Forecasts, By Application (2020-2032) (USD Billion)

12.5.1.9.5 Egypt 3D Printing Market Estimates And Forecasts, By Vertical (2020-2032) (USD Billion)

12.5.1.10 Saudi Arabia

12.5.1.10.1 Saudi Arabia 3D Printing Market Estimates And Forecasts, By Component (2020-2032) (USD Billion)

12.5.1.10.2 Saudi Arabia 3D Printing Market Estimates And Forecasts, By Technology (2020-2032) (USD Billion)

12.5.1.10.3 Saudi Arabia 3D Printing Market Estimates And Forecasts, By Process (2020-2032) (USD Billion)

12.5.1.10.4 Saudi Arabia 3D Printing Market Estimates And Forecasts, By Application (2020-2032) (USD Billion)

12.5.1.10.5 Saudi Arabia 3D Printing Market Estimates And Forecasts, By Vertical (2020-2032) (USD Billion)

12.5.1.11 Qatar

12.5.1.11.1 Qatar 3D Printing Market Estimates And Forecasts, By Component (2020-2032) (USD Billion)

12.5.1.11.2 Qatar 3D Printing Market Estimates And Forecasts, By Technology (2020-2032) (USD Billion)

12.5.1.11.3 Qatar 3D Printing Market Estimates And Forecasts, By Process (2020-2032) (USD Billion)

12.5.1.11.4 Qatar 3D Printing Market Estimates And Forecasts, By Application (2020-2032) (USD Billion)

12.5.1.11.5 Qatar 3D Printing Market Estimates And Forecasts, By Vertical (2020-2032) (USD Billion)

12.5.1.12 Rest Of Middle East

12.5.1.12.1 Rest Of Middle East 3D Printing Market Estimates And Forecasts, By Component (2020-2032) (USD Billion)

12.5.1.12.2 Rest Of Middle East 3D Printing Market Estimates And Forecasts, By Technology (2020-2032) (USD Billion)

12.5.1.12.3 Rest Of Middle East 3D Printing Market Estimates And Forecasts, By Process (2020-2032) (USD Billion)

12.5.1.12.4 Rest Of Middle East 3D Printing Market Estimates And Forecasts, By Application (2020-2032) (USD Billion)

12.5.1.12.5 Rest Of Middle East 3D Printing Market Estimates And Forecasts, By Vertical (2020-2032) (USD Billion)

12.5.2 Africa

12.5.2.1 Trends Analysis

12.5.2.2 Africa 3D Printing Market Estimates And Forecasts, By Country (2020-2032) (USD Billion)

12.5.2.3 Africa 3D Printing Market Estimates And Forecasts, By Component (2020-2032) (USD Billion)

12.5.2.4 Africa 3D Printing Market Estimates And Forecasts, By Technology (2020-2032) (USD Billion)

12.5.2.5 Africa 3D Printing Market Estimates And Forecasts, By Process (2020-2032) (USD Billion)

12.5.2.6 Africa
3D Printing Market Estimates And Forecasts, By Application (2020-2032) (USD Billion)

12.5.2.7 Africa
3D Printing Market Estimates And Forecasts, By Vertical (2020-2032) (USD Billion)

12.5.2.8 South Africa

12.5.2.8.1 South Africa 3D Printing Market Estimates And Forecasts, By Component (2020-2032) (USD Billion)

12.5.2.8.2 South Africa 3D Printing Market Estimates And Forecasts, By Technology (2020-2032) (USD Billion)

12.5.2.8.3 South Africa 3D Printing Market Estimates And Forecasts, By Process (2020-2032) (USD Billion)

12.5.2.8.4 South Africa 3D Printing Market Estimates And Forecasts, By Application (2020-2032) (USD Billion)

12.5.2.8.5 South Africa 3D Printing Market Estimates And Forecasts, By Vertical (2020-2032) (USD Billion)

12.5.2.9 Nigeria

12.5.2.9.1 Nigeria 3D Printing Market Estimates And Forecasts, By Component (2020-2032) (USD Billion)

12.5.2.9.2 Nigeria 3D Printing Market Estimates And Forecasts, By Technology (2020-2032) (USD Billion)

12.5.2.9.3 Nigeria 3D Printing Market Estimates And Forecasts, By Process (2020-2032) (USD Billion)

12.5.2.9.4 Nigeria 3D Printing Market Estimates And Forecasts, By Application (2020-2032) (USD Billion)

12.5.2.9.5 Nigeria 3D Printing Market Estimates And Forecasts, By Vertical (2020-2032) (USD Billion)

12.5.2.10 Rest Of Africa

12.5.2.10.1 Rest Of Africa 3D Printing Market Estimates And Forecasts, By Component (2020-2032) (USD Billion)

12.5.2.10.2 Rest Of Africa 3D Printing Market Estimates And Forecasts, By Technology (2020-2032) (USD Billion)

12.5.2.10.3 Rest Of Africa 3D Printing Market Estimates And Forecasts, By Process (2020-2032) (USD Billion)

12.5.2.10.4 Rest Of Africa 3D Printing Market Estimates And Forecasts, By Application (2020-2032) (USD Billion)

12.5.2.10.5 Rest Of Africa 3D Printing Market Estimates And Forecasts, By Vertical (2020-2032) (USD Billion)

12.6 Latin America

12.6.1 Trends Analysis

12.6.2 Latin America 3D Printing Market Estimates And Forecasts, By Country (2020-2032) (USD Billion)

12.6.3 Latin America 3D Printing Market Estimates And Forecasts, By Component (2020-2032) (USD Billion)

12.6.4 Latin America 3D Printing Market Estimates And Forecasts, By Technology (2020-2032) (USD Billion)

12.6.5 Latin America 3D Printing Market Estimates And Forecasts, By Process (2020-2032) (USD Billion)

12.6.6 Latin America 3D Printing Market Estimates And Forecasts, By Application (2020-2032) (USD Billion)

12.6.7 Latin America 3D Printing Market Estimates And Forecasts, By Vertical (2020-2032) (USD Billion)

12.6.8 Brazil

12.6.8.1 Brazil 3D Printing Market Estimates And Forecasts, By Component (2020-2032) (USD Billion)

12.6.8.2 Brazil 3D Printing Market Estimates And Forecasts, By Technology (2020-2032) (USD Billion)

12.6.8.3 Brazil 3D Printing Market Estimates And Forecasts, By Process (2020-2032) (USD Billion)

12.6.8.4 Brazil 3D Printing Market Estimates And Forecasts, By Application (2020-2032) (USD Billion)

12.6.8.5 Brazil 3D Printing Market Estimates And Forecasts, By Vertical (2020-2032) (USD Billion)

12.6.9 Argentina

12.6.9.1 Argentina 3D Printing Market Estimates And Forecasts, By Component (2020-2032) (USD Billion)

12.6.9.2 Argentina 3D Printing Market Estimates And Forecasts, By Technology (2020-2032) (USD Billion)

12.6.9.3 Argentina 3D Printing Market Estimates And Forecasts, By Process (2020-2032) (USD Billion)

12.6.9.4 Argentina 3D Printing Market Estimates And Forecasts, By Application (2020-2032) (USD Billion)

12.6.9.5 Argentina 3D Printing Market Estimates And Forecasts, By Vertical (2020-2032) (USD Billion)

12.6.10 Colombia

12.6.10.1 Colombia 3D Printing Market Estimates And Forecasts, By Component (2020-2032) (USD Billion)

12.6.10.2 Colombia 3D Printing Market Estimates And Forecasts, By Technology (2020-2032) (USD Billion)

12.6.10.3 Colombia 3D Printing Market Estimates And Forecasts, By Process (2020-2032) (USD Billion)

12.6.10.4 Colombia 3D Printing Market Estimates And Forecasts, By Application (2020-2032) (USD Billion)

12.6.10.5 Colombia 3D Printing Market Estimates And Forecasts, By Vertical (2020-2032) (USD Billion)

12.6.11 Rest Of Latin America

12.6.11.1 Rest Of Latin America 3D Printing Market Estimates And Forecasts, By Component (2020-2032) (USD Billion)

12.6.11.2 Rest Of Latin America 3D Printing Market Estimates And Forecasts, By Technology (2020-2032) (USD Billion)

12.6.11.3 Rest Of Latin America 3D Printing Market Estimates And Forecasts, By Process (2020-2032) (USD Billion)

12.6.11.4 Rest Of Latin America 3D Printing Market Estimates And Forecasts, By Application (2020-2032) (USD Billion)

12.6.11.5 Rest Of Latin America 3D Printing Market Estimates And Forecasts, By Vertical (2020-2032) (USD Billion)

13. Company Profiles

13.1 3D Systems

13.1.1 Company Overview

13.1.2 Financial

13.1.3 Products/ Services Offered

13.1.4 SWOT Analysis

13.2 Ultimaker

13.2.1 Company Overview

13.2.2 Financial

13.2.3 Products/ Services Offered

13.2.4 SWOT Analysis

13.3 HP

13.3.1 Company Overview

13.3.2 Financial

13.3.3 Products/ Services Offered

13.3.4 SWOT Analysis

13.4 EOS GmbH

13.4.1 Company Overview

13.4.2 Financial

13.4.3 Products/ Services Offered

13.4.4 SWOT Analysis

13.5 Voxeljet

13.5.1 Company Overview

13.5.2 Financial

13.5.3 Products/ Services Offered

13.5.4 SWOT Analysis

13.6 Materialise

13.6.1 Company Overview

13.6.2 Financial

13.6.3 Products/ Services Offered

13.6.4 SWOT Analysis

13.7 Stratasys

13.7.1 Company Overview

13.7.2 Financial

13.7.3 Products/ Services Offered

13.7.4 SWOT Analysis

13.8 CleanGreen3D Limited

13.8.1 Company Overview

13.8.2 Financial

13.8.3 Products/ Services Offered

13.8.4 SWOT Analysis

13.9 Protolabs

13.9.1 Company Overview

13.9.2 Financial

13.9.3 Products/ Services Offered

13.9.4 SWOT Analysis

13.10 Tiertime Technology

13.12.1 Company Overview

13.12.2 Financial

13.12.3 Products/ Services Offered

13.12.4 SWOT Analysis

14. Use Cases and Best Practices

15. Conclusion

An accurate research report requires proper strategizing as well as implementation. There are multiple factors involved in the completion of good and accurate research report and selecting the best methodology to compete the research is the toughest part. Since the research reports we provide play a crucial role in any company’s decision-making process, therefore we at SNS Insider always believe that we should choose the best method which gives us results closer to reality. This allows us to reach at a stage wherein we can provide our clients best and accurate investment to output ratio.

Each report that we prepare takes a timeframe of 350-400 business hours for production. Starting from the selection of titles through a couple of in-depth brain storming session to the final QC process before uploading our titles on our website we dedicate around 350 working hours. The titles are selected based on their current market cap and the foreseen CAGR and growth.


The 5 steps process:

Step 1: Secondary Research:

Secondary Research or Desk Research is as the name suggests is a research process wherein, we collect data through the readily available information. In this process we use various paid and unpaid databases which our team has access to and gather data through the same. This includes examining of listed companies’ annual reports, Journals, SEC filling etc. Apart from this our team has access to various associations across the globe across different industries. Lastly, we have exchange relationships with various university as well as individual libraries.

Secondary Research

Step 2: Primary Research

When we talk about primary research, it is a type of study in which the researchers collect relevant data samples directly, rather than relying on previously collected data.  This type of research is focused on gaining content specific facts that can be sued to solve specific problems. Since the collected data is fresh and first hand therefore it makes the study more accurate and genuine.

We at SNS Insider have divided Primary Research into 2 parts.

Part 1 wherein we interview the KOLs of major players as well as the upcoming ones across various geographic regions. This allows us to have their view over the market scenario and acts as an important tool to come closer to the accurate market numbers. As many as 45 paid and unpaid primary interviews are taken from both the demand and supply side of the industry to make sure we land at an accurate judgement and analysis of the market.

This step involves the triangulation of data wherein our team analyses the interview transcripts, online survey responses and observation of on filed participants. The below mentioned chart should give a better understanding of the part 1 of the primary interview.

Primary Research

Part 2: In this part of primary research the data collected via secondary research and the part 1 of the primary research is validated with the interviews from individual consultants and subject matter experts.

Consultants are those set of people who have at least 12 years of experience and expertise within the industry whereas Subject Matter Experts are those with at least 15 years of experience behind their back within the same space. The data with the help of two main processes i.e., FGDs (Focused Group Discussions) and IDs (Individual Discussions). This gives us a 3rd party nonbiased primary view of the market scenario making it a more dependable one while collation of the data pointers.

Step 3: Data Bank Validation

Once all the information is collected via primary and secondary sources, we run that information for data validation. At our intelligence centre our research heads track a lot of information related to the market which includes the quarterly reports, the daily stock prices, and other relevant information. Our data bank server gets updated every fortnight and that is how the information which we collected using our primary and secondary information is revalidated in real time.

Data Bank Validation

Step 4: QA/QC Process

After all the data collection and validation our team does a final level of quality check and quality assurance to get rid of any unwanted or undesired mistakes. This might include but not limited to getting rid of the any typos, duplication of numbers or missing of any important information. The people involved in this process include technical content writers, research heads and graphics people. Once this process is completed the title gets uploader on our platform for our clients to read it.

Step 5: Final QC/QA Process:

This is the last process and comes when the client has ordered the study. In this process a final QA/QC is done before the study is emailed to the client. Since we believe in giving our clients a good experience of our research studies, therefore, to make sure that we do not lack at our end in any way humanly possible we do a final round of quality check and then dispatch the study to the client.

Key Segments:

By Component

  • Hardware

  • Software

  • Services

By Technology

  • Stereolithography

  • Fuse Deposition Modeling

  • Selective Laser Sintering

  • Direct Metal Laser Sintering

  • Polyjet Printing

  • Inkjet printing

  • Electron Beam Melting

  • Laser Metal Deposition

  • Digital Light Processing

  • Laminated Object Manufacturing

  • Others

By Process

  • Powder Bed Fusion

  • Vat Photopolymerization

  • Binder Jetting

  • Material Extrusion

  • Material Jetting

  • Others

By Application

  • Prototyping

  • Tooling

  • Functional Part Manufacturing

By Vertical

  • Automotive

  • Aerospace & Defense

  • Healthcare

  • Architecture & Construction

  • Consumer Products

  • Education

  • Industrial

  • Energy

  • Printed Electronics

  • Jewelry

  • Food & Culinary

  • Others

Request for Segment Customization as per your Business Requirement: Segment Customization Request

REGIONAL COVERAGE:

North America

  • US

  • Canada

  • Mexico

Europe

  • Eastern Europe

    • Poland

    • Romania

    • Hungary

    • Turkey

    • Rest of Eastern Europe

  • Western Europe

    • Germany

    • France

    • UK

    • Italy

    • Spain

    • Netherlands

    • Switzerland

    • Austria

    • Rest of Western Europe

Asia Pacific

  • China

  • India

  • Japan

  • South Korea

  • Vietnam

  • Singapore

  • Australia

  • Rest of Asia Pacific

Middle East & Africa

  • Middle East

    • UAE

    • Egypt

    • Saudi Arabia

    • Qatar

    • Rest of the Middle East

  • Africa

    • Nigeria

    • South Africa

    • Rest of Africa

Latin America

  • Brazil

  • Argentina

  • Colombia

Request for Country Level Research Report: Country Level Customization Request

Available Customization

With the given market data, SNS Insider offers customization as per the company’s specific needs. The following customization options are available for the report:

  • Product Analysis

  • Criss-Cross segment analysis (e.g. Product X Application)

  • Product Matrix which gives a detailed comparison of product portfolio of each company

  • Geographic Analysis

  • Additional countries in any of the regions

  • Company Information

  • Detailed analysis and profiling of additional market players (Up to five)


  •            5000 (33% Discount)


  •            8950 (40% Discount)


  •            3050 (23% Discount)

Start a Conversation

Hi! Click one of our member below to chat on Phone