3D Printing Elastomers Market Report Scope & Overview:

Get More Information on 3D Printing Elastomers Market - Request Sample Report
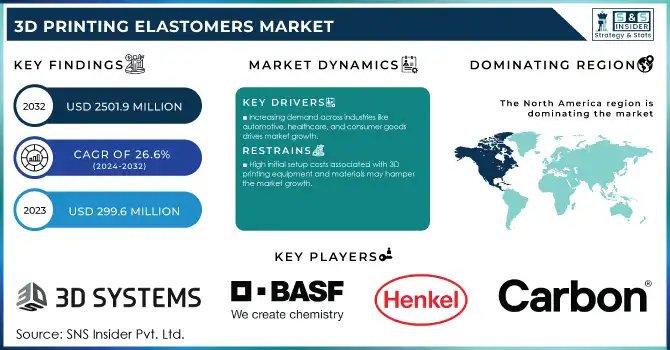
The 3D Printing Elastomers Market size was USD 299.6 million in 2023 and is expected to reach USD 2501.9 million by 2032 and grow at a CAGR of 26.6% over the forecast period of 2024-2032.
The increased demand for customization and prototyping is a significant driver of growth in the 3D printing elastomers market. As industries move toward more manufactured products that can meet specific customer demands, tailoring products to individual tastes and preferences while maintaining the highest order in final design and production utilizes the specific quality found in 3D-printed elastomeric parts. The ability to design and manufacture tailored components ranging from specialized automotive seals and medical implants to highly complex consumer goods has revolutionized industries. The present manufacturing methods cannot easily be able to create such complex and unique parts without costly means and lengthy lead times. Conversely, the 3D printing of elastomeric components enables companies to rapidly prototype, evaluate designs, and refine them before moving to full-scale production. This capability helps cut down the time-to-market, drive product innovation, and make high-performance and customized products that match the exact needs of their customers, thus driving growth across industries, automotive, healthcare, and manufacturing.
The National Institutes of Health (NIH) published a report in 2022 highlighting that 3D printing has revolutionized the healthcare sector, with over 50% of hospitals in the U.S. implementing 3D printing for customized medical implants and prosthetics. This surge in healthcare applications shows the demand for customized elastomeric components.
Investment and research are essential components in the expansion of 3D Printing Elastomers Market. With growing demand for personalized elastomeric parts, companies are continuing investment in R&D to develop material properties, printing technologies and applications for both established firms and startups. That has led to more funding pouring in for elastomeric materials, with particular advancements in thermoplastic elastomers (TPEs) and thermoset elastomers that provide better flexibility, durability, and performance for use with 3D printing. In fact, many research institutions as well as private sector companies are working together to develop new elastomer formulations that can be processed easily by 3D printing, making it possible to incorporate new applications in automotive, aerospace, and healthcare industries. Additionally, this rising attention towards R&D is further fueling the introduction of eco-friendly elastomer materials, thus driving the demand for sustainable 3D printed products.
The U.S. Department of Energy (DOE) allocated USD 15 million in 2023 to support research into advanced manufacturing techniques, including additive manufacturing (3D printing). This funding is aimed at developing new materials and enhancing the capabilities of 3D printing technologies, which includes elastomers used in various applications, from automotive to healthcare.
3D Printing Elastomers Market Dynamics
Drivers
-
Increasing demand across industries like automotive, healthcare, and consumer goods drives market growth.
The key factor driving the growth of the 3D printing elastomers market is the increasing demand from various end-user industries such as automotive, healthcare, and consumer goods. With the trend of producing lightweight, durable, and custom elastomeric components like seals, gaskets, and vibration-damping parts for the automotive industry, manufacturers are increasingly using 3D printing to improve vehicle performance, fuel efficiency, and comfort. Beyond that, there is an increasing demand in the healthcare sector as 3D printing offers the ability to manufacture customized medical devices including prostheses, implants and even bespoke surgical instruments which all need soft, biocompatible elastomeric materials. This allows for better fit and function both of which are critical to patient care. The consumer goods industry also capitalizes off of 3D printing's creative development, allowing manufacturers to create customized items like shoes and equipment and toys with higher quality-performance characteristics. This versatility makes 3D printed elastomers attractive across these industries as they allow designs to rapidly be adapted to specific tailoring needs while minimizing production costs. Consumer preferences for customized, high-performance products are increasingly driving the demand for elastomeric materials in 3D printing, thereby, boosting market growth in various industries.
According to the U.S. Department of Energy (DOE), the U.S. automotive industry invested over USD 3 billion in 2023 in advanced manufacturing technologies, including additive manufacturing (3D printing). This investment focuses on improving vehicle performance and reducing weight with materials like elastomers for gaskets, seals, and vibration-damping components.
Restraint
-
High initial setup costs associated with 3D printing equipment and materials may hamper the market growth.
The high cost for the initial setup and materials related to 3D printing equipment will be one of the major factors that will hamper the growth of 3D Printing Elastomers Market. In addition to the benefits of design freedom and shorter development cycles provided by 3D printing, the high capital investment cost for acquiring the sophisticated 3D printers’ technologies and elastomeric materials needed can sting small and medium-sized enterprises (SMEs). High-performance 3D printing machines that can process elastomers cost upwards of tens of thousands of dollars, and climbing into the hundreds of thousands a steep price that makes them inaccessible for many companies. Moreover, specialized elastomer materials for 3D printing are costly in comparison to conventional materials owing to their unique features like flexibility, durability, and biocompatibility, among others. Such challenges lead to massively high operational costs, which in turn hampers the widespread use of the technology especially from cost-profident organizations. This is likely to limit the growth of the market for the high initial investment required for equipment and materials, as this is often a significant consideration in many price-sensitive industries or geographical areas.
3D Printing Elastomers Market Segmentation
By Form
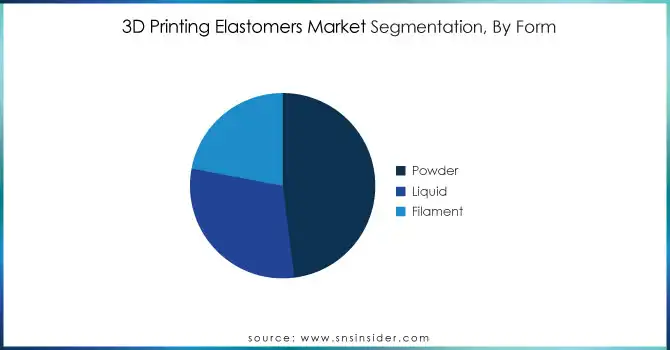
Powder held the largest market share around 48% in 2023. It is owing to its multifunctionality, price sensitivity, and compatibility across different types of 3D printing technologies, especially in powder bed fusion (PBF) and selective laser sintering (SLS) processes. With high precision in material deposition, powder-based elastomers allow for high-resolution and high-reproducibility parts with complex geometries, proving useful in many applications like automotive, healthcare and consumer goods. It is easier to store and use than liquid or filament elastomers, which makes it more practical for industrial-scale production. Moreover, many 3D printing processes allow for powder materials to be recycled and reused, which can minimize the material waste while also minimizing total costs. The recyclability and efficiency make powder-based elastomers a favorable option for companies seeking to limit production costs, without sacrificing quality. In addition, the powder segment of the 3D printing materials market is supported by the increasing usage of powder-based 3D printing technologies in various industries, given their capability to create strong, durable, and customized parts.

By Material
In 2023, the TPE segment led the material segment of the 3D printing elastomers market with the highest revenue share in 2023 attributed to its versatility, offering a balance of flexibility, durability, and ease of processing. TPEs are favored for their ability to be repeatedly melted and reshaped, making them ideal for various 3D printing applications. Furthermore, advancements in TPE formulations, providing enhanced properties such as chemical resistance and impact strength, have further propelled its adoption in diverse industries.
By End-User
Automotive held the largest market share around 30% in 2023. The demand for lightweight, durable and personalized components from the industry, including seals, gaskets and parts that damp vibrations, as well as the flexibility and precision of 3D printing technology contribute to this dominance. As automotive manufacturers embrace new technologies, 3D printing provides the opportunity to shave time to market, decrease the investment required for manufacturing, and develop complex parts, (which would be expensive or impossible with traditional manufacturing). Highly flexible and capable of tolerating extreme conditions, including temperature, moisture, and wear, elastomers are ideal for vehicle applications because the design flexibility and material efficiency required in the vehicle space is rapidly evolving with the introduction of state-of-the-art design as well as electric vehicles (EVs).
3D Printing Elastomers Market Regional Analysis
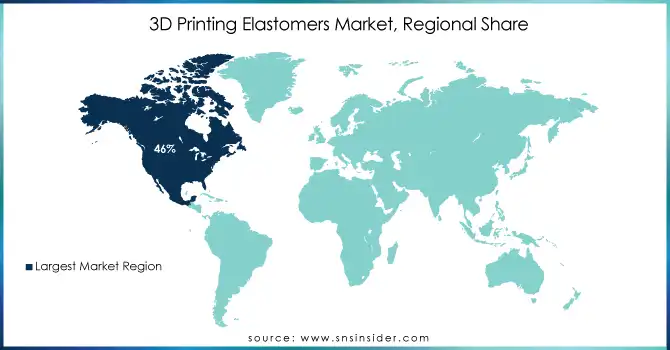
North America held the largest market share around 46% in 2023. It is owing to various factors including well-developed industrial infrastructure, great penetration of advanced manufacturing technologies, and huge investments in research & development (R&D) activities. The United States, especially, has a significant role in the world of additive manufacturing, with several major industries, including automotive, aerospace, healthcare, and consumer electronics, investing heavily in 3D printing technologies. A well-established ecosystem of technology companies, research institutes, and government support in the region enables innovation and adoption of advanced materials such as elastomers. Moreover, the manufacturing base in North America is strong, with companies creating design and engineer driven custom, high-performance parts that make the most of 3D printing versatility and precision. The market is also benefiting from the presence of key 3D printing companies, including Stratasys and 3D Systems, and the high demand for customized solutions in automotive and healthcare fields as well.

Get Customized Report as per Your Business Requirement - Request For Customized Report
Key Players
-
Carbon Inc (Carbon Digital Light Synthesis, Epoxy Resin)
-
Henkel (Loctite 3D 3843, Loctite 3D 3955)
-
BASF SE (Ultrafuse 316L, Ultrafuse TPU 64D)
-
Dow Chemical Company (DOW 3D Printing Resin, DOW FILMTEC)
-
Formlabs (Tough 1500 Resin, Elastic Resin)
-
3D Systems Inc (Figure 4 Tough, Somos PerFORM)
-
Stratasys Ltd (Agilus30, TangoPlus)
-
Proto Labs Inc (Protomold, Protolabs Rapid Injection Molding)
-
Materialise NV (Magics Software, Mimics Innovation Suite)
-
EOS (EOS P 396, EOS Formulated Elastomer)
-
Evonik Industries AG (VESTOSINT, VESTAMID)
-
Arkema SA (N3xtDimension Resin, Arkema Rilsan)
-
Sinterit (Sinterit Studio, PA12 Flex)
-
EnvisionTEC (E-Shell 300, E-RigidForm)
-
The Lubrizol Corporation (Estane 3D TPU, Estane 3D 70A)
-
ExOne (X1 Metal, ExOne ProMetal)
-
Zortrax (Z-ULTRAT, Z-ABS)
-
HP Development Company L.P. (HP 3D High Reusability Powder, HP 3D Printing TPU)
-
LANXESS (Durethan, Desmopan)
-
Impossible Objects (Composite-Based Additive Manufacturing, CBAM)
Recent Development:
-
In Oct 2023, Evonik expanded its portfolio of elastomeric materials for powder bed In October 2023, Evonik expanded its range of elastomeric materials for powder bed fusion 3D printing technologies by introducing INFINAM® TPA 4006 P, a new powder grade specifically optimized for all types of open-source SLS 3D printing machines.
-
In September 2023, Carbon unveiled its latest elastomer material, EPU 46, boasting high-performance properties, exceptional durability, and a variety of color options. This versatile material is suitable for a wide range of applications including saddles, footwear, and grips.
-
Also in September 2023, Formlabs introduced Alumina 4N Resin, a pure ceramic material that enables the cost-effective production of 3D printed ceramics for aerospace, automotive, and industrial casting applications, offering a significant cost advantage over leading alternatives.
-
In April 2023, Arkema launched "EASY3D," an online on-demand additive manufacturing platform developed in collaboration with 3YourMind. This innovative platform is designed to streamline on-demand production for part manufacturers within an optimized ecosystem.
| Report Attributes | Details |
|---|---|
| Market Size in 2023 | USD 299.6 Million |
| Market Size by 2032 | USD 2501.9 Million |
| CAGR | CAGR of 26.6% From 2024 to 2032 |
| Base Year | 2023 |
| Forecast Period | 2024-2032 |
| Historical Data | 2020-2022 |
| Report Scope & Coverage | Market Size, Segments Analysis, Competitive Landscape, Regional Analysis, DROC & SWOT Analysis, Forecast Outlook |
| Key Segments | • By Form (Powder, Liquid, and Filament) • By Material (TPE, SBR & SBS, and Others) • By End-use Industry (Consumer Electronics, Industrial, Aerospace & Defense, Automotive, Healthcare, and Others) |
| Regional Analysis/Coverage | North America (US, Canada, Mexico), Europe (Eastern Europe [Poland, Romania, Hungary, Turkey, Rest of Eastern Europe] Western Europe] Germany, France, UK, Italy, Spain, Netherlands, Switzerland, Austria, Rest of Western Europe]), Asia Pacific (China, India, Japan, South Korea, Vietnam, Singapore, Australia, Rest of Asia Pacific), Middle East & Africa (Middle East [UAE, Egypt, Saudi Arabia, Qatar, Rest of Middle East], Africa [Nigeria, South Africa, Rest of Africa], Latin America (Brazil, Argentina, Colombia, Rest of Latin America) |
| Company Profiles | Carbon Inc, Henkel, BASF SE, Dow Chemical Company, Formlabs, 3D Systems Inc, Stratasys Ltd, Proto Labs Inc, Materialise NV, EOS, Evonik Industries AG, Arkema SA, Sinterit, EnvisionTEC, The Lubrizol Corporation, ExOne, Zortrax, HP Development Company L.P., LANXESS, Impossible Objects, and Voxeljet AG |
| Market Drivers | • Increasing demand across industries like automotive, healthcare, and consumer goods drives market growth. |
| Market Restraints | • High initial setup costs associated with 3D printing equipment and materials may hamper the market growth. |

