3D Printed Wearables Market Report Scope & Overview:
3D Printed Wearables Market was valued at USD 4.1 billion in 2023 and is expected to reach USD 7.97 billion by 2032, growing at a CAGR of 7.68% over the forecast period 2024-2032.

Get more information on 3D Printed Wearables Market - Request Free Sample Report
The 3D Printed Wearables Market Report provides key statistical insights and trends shaping the industry. It covers market adoption and growth rates, highlighting regional expansion and CAGR projections. The report analyzes the incidence and prevalence of medical conditions requiring 3D-printed wearables, along with production and usage volumes. It evaluates regulatory compliance and approvals across major regions, assessing how evolving standards impact market growth. Additionally, the study examines healthcare spending allocation, detailing government, private, and out-of-pocket expenditures. Lastly, it explores technological and material advancements, including biocompatible polymers, AI-driven customization, and IoT integration. These insights provide a comprehensive outlook on market dynamics, innovations, and investment opportunities. The 3D Printed Wearables Market is experiencing significant growth driven by increasing demand for personalized healthcare solutions and advancements in 3D printing technology.
Market Dynamics
Drivers
-
The increasing consumer demand for personalized and customized wearable products is propelling the adoption of 3D printing technology in the fashion and healthcare sectors.
Consumer demand for personalized and customized wearable products is on the rise, which is a major supporting factor for the adoption of this technology across industries, especially in fashion and healthcare. In healthcare, 3D printing facilitates the creation of customized medical devices. Californian researchers applied 3D-printed epifluidic electronic skin with machine learning for multimodal health surveillance, allowing continuous monitoring of chemical and physical health status. This trend is also being adopted by educational institutions. Swinburne University of Technology announced a bachelor of fashion course, integrating current technologies including augmented reality, generative AI, wearables and 3D printing in both clothing design and interactive retail experiences. The program will develop students' ability to design and manufacture technology-focused clothing and wearable technology with a strong focus on sustainable production practices.
Restraint
-
High initial production costs and the need for specialized skills in 3D printing technology pose challenges for smaller brands, potentially hindering widespread adoption.
High initial production costs combined with the need for specialist skills will provide a significant barrier to entry for 3D-printed wearables. In addition, there is also a shortage of skilled workforce proficient in additive manufacturing technologies in the 3D printing industry. This skills gap prevents companies from being able to successfully implement a process of adopting 3D printing and magnetizes even more toward high operational costs and barriers to scalability. As such, many smaller brands and startups that are financially strapped and/or lack access to specialized expertise are especially poorly positioned to adopt and implement 3D printing technologies in their wearable product ranges. These factors collectively pose substantial barriers to the widespread adoption of 3D printing in the wearables market, as companies must weigh the benefits of customization and innovation against the financial and operational constraints associated with high production costs and the scarcity of skilled professionals.
Opportunity
-
Advancements in materials and printing techniques are enabling the creation of functional and durable wearables, opening new avenues for innovation and market expansion.
The growth of the 3D printed wearables market is mainly driven by the advances in materials and 3D printing technologies, allowing products that are functional, durable, and customizable to be manufactured. Healthcare is one of the booming industrial areas. Advances in 3D printing materials and technology revolutionize the ability to produce personalized and functional wearables. This innovation enables the development of patient-specific prosthetics and orthopedic implants that are more comfortable and effective. The rising incidence of chronic diseases, including diabetes, cardiovascular disorders, etc. is a major factor propelling the market growth of personalized medical devices. An example is shoe soles created by the use of 3D printing to improve sensory perception in diabetic patients, enabling better mobility and decreasing the risk of foot ulcers. In addition, the shortage of organ donors has contributed to the growing research in 3D-printed tissues and organs. It has the potential to combat organ scarcity through bio-printed tissues specific to each patient. These developments not only enhance patient results but also open up new horizons for innovation in medical treatment and rehabilitation.
Challenge
-
Ensuring regulatory compliance and meeting safety and quality standards for wearable technology can complicate development processes and delay market entry.
One of the biggest challenges in the development of 3D printed medical devices is ensuring regulatory compliance and safety and quality standards. More than 200 such devices have received authorization from the U.S. Food and Drug Administration (FDA), but the unique characteristics of 3D printing present challenges in design controls and manufacturing quality assurance. The customizable nature of these systems makes the development of standard design control models difficult since each product can involve different specifications. Furthermore, a consistent material property, and optimization of printing parameters build orientation, laser power should be in place to guarantee product quality and security. Additionally, the need for cleaning, finishing and sterilization post-production further increases the complexity of compliance. Manufacturers need to stay informed about the latest regulatory developments, a process that varies considerably depending on the country. Not overcoming these challenges can lead to the major delay of products to market and put the adoption of innovative 3D-printed medical solutions at risk.
Market Segmentation
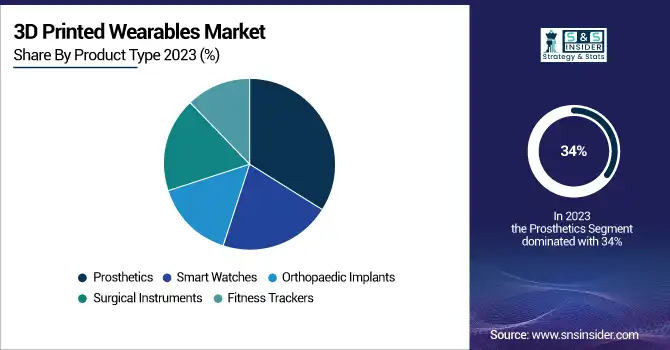
By Product Type
The prosthetics segment dominated and held the largest revenue share 34% in 2023. Several contributing factors, such as the rising incidence of limb amputations and the need for personalized prosthetics, have driven this growth. There are an estimated 2 million people living with limb loss in the United States, according to the National Center for Health Statistics, and that number is projected to double by 2050. The U.S. Department of Veterans Affairs reports that about 25% of combat amputees now receive 3D-printed prosthetics, highlighting the technology's adoption in military healthcare.
The orthopedic implants segment is estimated to witness the fastest growth rate, the rapid growth of the orthopedic implants segment can primarily be attributed to the increasing prevalence of orthopedic disorders and rising geriatric population. By 2040, approximately 78 million U.S. adults aged 18 years or older are estimated to have doctor-diagnosed arthritis according to the Centers for Disease Control and Prevention (CDC) estimation. In contrast, 3D-printed orthopedic implants allow for a higher degree of customization, with ultimately better matching anatomically to patient genotypes giving better outcomes. According to the National Institute of Arthritis and Musculoskeletal and Skin Diseases (NIAMS), patients with 3D-printed orthopedic implants recover 30% faster than those with traditional implants.
By End Use
The hospitals segment held the largest revenue share 36% in 2023. This is due to the rising establishment of 3D printing technology in hospital environments when it comes to developing personalized medical products and implants. The American Hospital Association (AHA) states that healthcare organizations are investing in 3D printing, with more than 60% of hospitals with more than 400 beds currently offering 3D printing capabilities to clinical teams for ongoing patient care. According to the Centers for Medicare & Medicaid Services (CMS), hospitals that have been using 3D-printed medical devices have experienced a 15% reduction in surgical complications and a 20% reduction in the recovery time of patients. For instance, the U.S. Department of Health and Human Services is investing USD 50 million to bring 3D printing technologies to hospitals across the country, citing their potential to transform patient outcomes and lower healthcare costs. Moreover, the NIBIB summarised that feedback from hospitals working with 3D-printed wearable products shows an improvement of satisfaction scores of 25% in particular departments such as prosthetics and orthopedics.
Regional Analysis
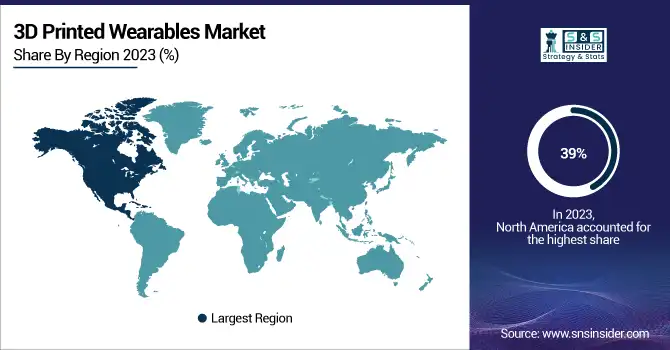
North America held the largest revenue share in 2023, contributing to around 39% of the global shares of 3D Printed Wearables. The region's strong healthcare system, substantial spending on research and development, and attractive regulatory framework often contribute to this leadership role. According to the U.S. National Institutes of Health (NIH), more than 45% of worldwide research papers on 3D-printed medical devices have been published between 2018 and 2023 in North American institutions.
The 3D Printed Wearables Market in Asia-Pacific region is also expected to be the highest CAGR during the forecast period. Rapid growth is bolstered by rising healthcare expenditure, increasing awareness of personalized medicine, and government initiatives for advanced manufacturing technologies. The Chinese Ministry of Science and Technology has announced an incredible 1.5 billion investment into 3D printing technologies where they are to develop 3D printers for medical applications, among others. In India, the Department of Science and Technology has launched a national 3D printing initiative, aiming to increase the country's global market share in 3D-printed medical devices from 3% to 10% by 2030.
The Europe region held a significant share of the market, The Horizon Europe program launched by the European Union has contributed to the strong market position of the European region in the 3D-printed medical devices market by investing €300 million in research and innovation. Particularly, the National Health Service (NHS) of the United Kingdom has noted a 30-percent increase in the use of 3D-printed wearables for its patients in the past two years, which seems to prove a rapidly growing adoption of 3D-printed wearables in the area.
Get a Customized Report as per your Business Requirement - Request For Customized Report
Key Players
-
3D Systems, Inc: [Surgical Guides, Anatomical Models]
-
ENVISIONTEC US LLC: [Dental Prosthetics, Hearing Aid Shells]
-
Stratasys: [Surgical Planning Models, Custom Orthopedic Implants]
-
GENERAL ELECTRIC: [Customized Metal Orthopedic Implants, Surgical Instruments]
-
Cyfuse Biomedical.: [3D Bioprinted Tissue Constructs, Scaffold-Free Tissue Engineering Products]
-
Koninklijke Philips N.V.: [Personalized Sleep Apnea Masks, Custom Hearing Aids]
-
Zephyr Technology Corporation: [Wearable Health Monitors, Remote Patient Monitoring Devices]
-
Omron Corporation: [Wearable Blood Pressure Monitors, Fitness Trackers]
-
Everist Health, Inc.: [Cardiac Monitoring Devices, Wearable Heart Health Assessments]
-
BioTelemetry: [Mobile Cardiac Outpatient Telemetry Devices, Wireless Heart Monitors]
-
Materialise NV: [Patient-Specific Surgical Guides, Custom Orthopedic Implants]
-
Formlabs: [Dental Surgical Guides, Custom Prosthetics]
-
Renishaw: [Metal 3D Printed Cranial Implants, Dental Frameworks]
-
LimaCorporate: [3D Printed Orthopedic Joint Implants, Custom Shoulder Implants]
Recent Developments
-
In November 2024, the European Medicines Agency (EMA) announced new guidelines governing the certification of 3D-printed wearable medical devices, simplifying the approval procedure and potentially speeding the path to market for groundbreaking products.
-
In March 2024, the Japan Ministry of Health, Labour and Welfare announced a partnership with major tech companies to create a nationwide network of 3D printing hubs for custom medical devices to cut the cost of production with the ultimate goal of increasing accessibility.
| Report Attributes | Details |
|---|---|
| Market Size in 2023 | USD 4.1 Billion |
| Market Size by 2032 | USD 7.97 Billion |
| CAGR | CAGR of 7.68% From 2024 to 2032 |
| Base Year | 2023 |
| Forecast Period | 2024-2032 |
| Historical Data | 2020-2022 |
| Report Scope & Coverage | Market Size, Segments Analysis, Competitive Landscape, Regional Analysis, DROC & SWOT Analysis, Forecast Outlook |
| Key Segments | • By Product Type (Prosthetics, Orthopedic Implants, Surgical Instruments, Smart Watches, Fitness Trackers) • By End-user (Hospital, Pharma and Biotech companies, Academic Institutes, Others) |
| Regional Analysis/Coverage | North America (US, Canada, Mexico), Europe (Eastern Europe [Poland, Romania, Hungary, Turkey, Rest of Eastern Europe] Western Europe] Germany, France, UK, Italy, Spain, Netherlands, Switzerland, Austria, Rest of Western Europe]), Asia Pacific (China, India, Japan, South Korea, Vietnam, Singapore, Australia, Rest of Asia Pacific), Middle East & Africa (Middle East [UAE, Egypt, Saudi Arabia, Qatar, Rest of Middle East], Africa [Nigeria, South Africa, Rest of Africa], Latin America (Brazil, Argentina, Colombia, Rest of Latin America) |
| Company Profiles | 3D Systems, Inc., ENVISIONTEC US LLC, Stratasys, GENERAL ELECTRIC, CYFUSE BIOMEDICAL K.K., Koninklijke Philips N.V., Zephyr Technologies & Solutions Pvt. Ltd, OMRON Corporation, Everist Health, Inc., BioTelemetry, Materialise NV, Formlabs, Renishaw, LimaCorporate. |
