Get More Information on 3D NAND Flash Memory Market - Request Sample Report
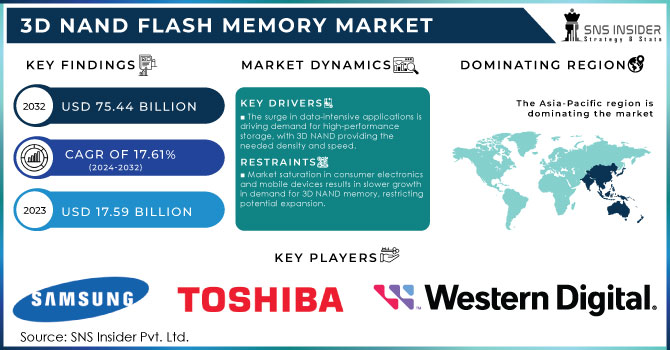
The 3D NAND Flash Memory Market Size was USD 17.59 Billion in 2023 and is expected to Reach USD 75.44 Billion by 2032 and grow at a CAGR of 17.61% over the forecast period of 2024-2032.
3D NAND memory technology represents a significant advancement in data storage, offering enhanced performance and efficiency compared to traditional 2D NAND. Unlike 2D NAND, which arranges memory cells in a flat structure, 3D NAND stacks memory cells vertically, creating a three-dimensional structure. This innovation allows for a greater number of memory cells within the same footprint, improving storage density and enabling faster data access. One of the key benefits of 3D NAND is its ability to reduce the physical space needed for memory storage while simultaneously increasing the amount of data that can be stored, with some configurations achieving storage densities of up to 1 terabit per chip.
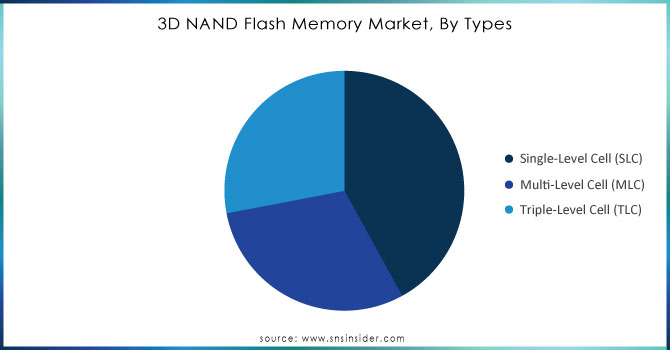
3D NAND is characterized by its various architectures, including Single-Level Cell (SLC), Multi-Level Cell (MLC), Triple-Level Cell (TLC), and Quad-Level Cell (QLC) configurations. SLC stores one bit per cell, offering high performance and reliability, making it suitable for enterprise applications. TLC and QLC store more bits per cell, providing cost-effective solutions for consumer-grade products, albeit with slightly reduced performance and endurance. TLC can store three bits per cell, while QLC can store four bits per cell, significantly enhancing storage capacity at a lower cost. This flexibility allows manufacturers to tailor products to meet diverse consumer and enterprise needs.
As technology continues to evolve, 3D NAND memory is gaining traction across various applications, including smartphones, tablets, laptops, and data centers. Its ability to deliver high read/write speeds, with rates exceeding 500 MB/s, improved power efficiency, and increased durability typically boasting endurance ratings of up to 1000 write cycles makes it a preferred choice for modern storage solutions. Additionally, advancements in manufacturing processes have made 3D NAND more accessible, allowing for widespread adoption in both consumer electronics and enterprise environments.
DRIVERS
The surge in data-intensive applications like cloud computing, big data analytics, and AI is fueling the need for high-performance storage solutions, with 3D NAND memory providing the necessary density and speed for optimal performance.
The increasing demand for high-performance storage is primarily fueled by the rapid expansion of data-intensive applications, including cloud computing, big data analytics, and artificial intelligence (AI). As organizations across various sectors generate vast amounts of data, the need for robust storage solutions that can efficiently handle this influx becomes paramount. Traditional storage technologies often struggle to keep pace with the performance and capacity requirements of modern applications. In this context, 3D NAND memory has emerged as a game-changer. Unlike conventional 2D NAND, 3D NAND stacks memory cells vertically, allowing for greater density and enhanced performance. This innovative architecture not only increases storage capacity but also significantly improves data access speeds, making it highly suitable for demanding workloads. Studies show that 3D NAND can deliver write speeds that are up to 50% faster than traditional NAND solutions. Additionally, the energy efficiency of 3D NAND reduces operational costs, making it an attractive option for enterprises looking to optimize their IT infrastructure. With the proliferation of AI applications, which require rapid data processing and analysis, high-performance storage has become critical. Research indicates that approximately 70% of enterprises are investing in new storage technologies to support their digital transformation initiatives. This trend underscores the critical role of advanced storage solutions in enabling organizations to harness the power of data-driven technologies effectively. As data continues to grow exponentially, the demand for high-performance storage will likely intensify, driving further innovations in memory technologies like 3D NAND.
The widespread use of smartphones, tablets, and other portable devices drives the demand for compact and efficient storage solutions, with 3D NAND technology offering superior size, speed, and energy efficiency compared to traditional storage options.
This rapid growth drives the demand for compact and efficient storage solutions to accommodate the increasing amount of data generated by applications, multimedia content, and user-generated files. With the average smartphone user reportedly storing around 80 apps, photos, and videos, the need for high-performance storage is critical.
3D NAND technology has emerged as a key player in addressing this demand, offering several advantages over traditional storage solutions. Unlike planar NAND, 3D NAND stacks memory cells vertically, significantly enhancing storage density while minimizing the physical footprint. This technology not only allows for greater data storage capacity in smaller devices but also improves read and write speeds, enhancing overall device performance. For example, devices equipped with 3D NAND can achieve speeds that are up to three times faster than those using traditional NAND, resulting in quicker app launches and file transfers. Additionally, 3D NAND is more energy-efficient, which is crucial for battery-operated devices. With energy consumption being a top concern, 3D NAND reduces power usage, extending battery life and contributing to the overall sustainability of mobile technology. As mobile devices continue to proliferate, the reliance on advanced storage solutions like 3D NAND will only increase, reshaping the future of mobile computing and data management.
RESTRAIN
Market saturation in consumer electronics and mobile devices results in slower growth in demand for 3D NAND memory, restricting potential expansion.
Market saturation in the consumer electronics and mobile device sectors is increasingly evident as the proliferation of advanced technologies has resulted in a significant increase in product offerings. With many companies competing for market share, consumer choices have expanded, leading to a slowdown in growth rates for various components, including 3D NAND memory. The global smartphone market has seen annual growth rates decline from around 10% a few years ago to approximately 3% recently, indicating a mature market where most consumers already own smartphones. Similarly, the proliferation of smart devices and IoT gadgets has saturated the market, leaving little room for new entrants or innovative products that can drive demand for advanced memory solutions.
Additionally, the trend toward device longevity means consumers are holding onto their gadgets longer, further decreasing the frequency of upgrades. A report highlighted that the average lifespan of smartphones has extended from around two years to approximately three years, which reduces the overall demand for memory upgrades associated with new devices. Moreover, as manufacturers focus on optimizing existing products rather than introducing entirely new lines, the push for advanced memory technologies may wane. As a result, 3D NAND manufacturers could face challenges in finding new markets or expanding existing ones, impacting their growth potential in an increasingly saturated environment. This scenario underscores the necessity for companies to innovate and explore alternative applications for their technologies to sustain growth amid market saturation.
By Types
Triple-Level Cell (TLC) dominated the market share over 38.09% in 2023, striking an optimal balance between cost, performance, and storage capacity. TLC can store three bits of data per cell, allowing for higher density compared to Single-Level Cell (SLC) and Multi-Level Cell (MLC) technologies. This increased density translates to larger storage capacities, which is crucial for modern consumer electronics, such as smartphones, tablets, and solid-state drives (SSDs). As a result, TLC has become the dominant segment in the 3D NAND memory market, catering to the growing demand for affordable yet efficient storage solutions. Its ability to deliver satisfactory performance for everyday applications, combined with cost-effectiveness, makes it a preferred choice among manufacturers.
Need Any Customization Research On 3D NAND Memory Market - Inquiry Now
By Application
The smartphones and tablets segment dominated the market share over 42.06% in 2023. As smartphones and tablets become essential tools for daily activities, users increasingly rely on mobile applications that require significant storage. Additionally, the proliferation of high-resolution cameras in these devices enhances the need for ample storage capacity to accommodate the growing volumes of photos and videos. Multimedia content, such as video streaming services, gaming applications, and mobile productivity tools, further contributes to this demand, as users expect seamless performance and quick access to their data. With 3D NAND memory offering faster read and write speeds, improved endurance, and higher storage density compared to traditional memory types, it is increasingly favored for smartphones and tablets.
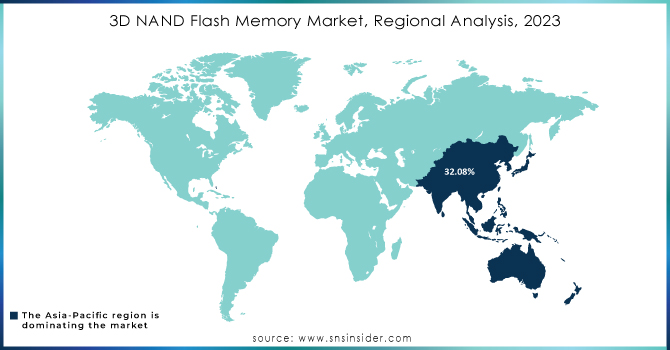
The Asia-Pacific region dominated the market share over 32.08% in 2023, fueled by the presence of industry giants like Samsung, SK Hynix, and Micron Technology. This concentration of major semiconductor manufacturers creates a robust ecosystem for 3D NAND technology development and innovation. A significant driver of market demand is the booming consumer electronics sector, particularly in smartphones, tablets, and laptops. The growing need for high-capacity storage solutions, driven by data-intensive applications, further enhances the region's appeal.
North America is experiencing the fastest growth in the 3D NAND memory market, driven by the surging adoption of cloud computing and the expansion of data centers. As enterprises increasingly rely on cloud services and high-performance computing, the demand for solid-state drives (SSDs) has escalated significantly, propelling the need for advanced memory solutions. The Internet of Things (IoT) market's growth further contributes to this trend, as connected devices necessitate efficient data storage and processing capabilities. Major players in the region are heavily investing in technology innovation, enhancing the capabilities and applications of 3D NAND memory. In recent years, investments in data centers have increased by over 20%, underscoring the urgency for high-capacity storage solutions.
Some of the major key players of 3D NAND Memory Market
Samsung Electronics Co., Ltd. (V-NAND)
Intel Corporation (Optane Memory)
Toshiba Memory Corporation (BiCS FLASH)
Western Digital Corporation (3D NAND SSDs)
Micron Technology Inc. (NAND Flash Memory)
SK Hynix Inc. (4D NAND)
Kingston Technology Company, Inc. (NAND Flash SSDs)
Crucial Technology (Crucial P5 Plus SSD)
SanDisk Corporation (3D NAND SSDs)
Transcend Information Inc. (3D NAND Flash SSDs)
Phison Electronics Corporation (NAND Controllers)
Infineon Technologies AG (3D NAND Solutions)
Microchip Technology Inc. (NAND Flash Memory Solutions)
ON Semiconductor (NAND Flash Memory Solutions)
VIA Technologies Inc. (NAND Memory Solutions)
Integrated Silicon Solution Inc. (ISSI) (NAND Flash Products)
Western Digital Technologies, Inc. (3D NAND Technology)
ADATA Technology Co., Ltd. (XPG SSDs)
Seagate Technology Holdings plc (3D NAND SSDs)
NetApp, Inc. (SolidFire 3D NAND Flash Storage)
Samsung Electronics Co., Ltd.
Micron Technology Inc.
SK Hynix Inc.
Toshiba Memory Corporation
Western Digital Corporation
Intel Corporation
Kingston Technology Company, Inc.
Crucial Technology
Transcend Information Inc.
Phison Electronics Corporation
In April 2024: Samsung Electronics Co. announced that it had started mass production of the world’s most advanced 286-layer NAND flash memory chips, which offer increased data storage capacity.
In April 2024: Transcend Information Inc., a global leader in industrial memory storage, unveiled the all-new MTE560P M.2 SSD featuring an array of next-gen features. This innovative drive utilizes the PCIe Gen 4x4 high-speed interface, coupled with high-quality 112-layer 3D NAND Flash technology, and a wide temperature range.
In July 2024: Micron Technology, Inc., announced that it is shipping ninth-generation (G9) TLC NAND in SSDs, making it the first in the industry to achieve this milestone. Micron G9 NAND features the industry’s highest transfer speed of 3.6 GB/s, delivering unsurpassed bandwidth for reading and writing data. The new NAND enables best-in-class performance for artificial intelligence (AI) and other data-intensive use cases from personal devices and edge servers to enterprise and cloud data centers.
| Report Attributes | Details |
|---|---|
| Market Size in 2023 | USD 17.59 Billion |
| Market Size by 2032 | USD 75.44 Billion |
| CAGR | CAGR of 17.61% From 2024 to 2032 |
| Base Year | 2023 |
| Forecast Period | 2024-2032 |
| Historical Data | 2020-2022 |
| Report Scope & Coverage | Market Size, Segments Analysis, Competitive Landscape, Regional Analysis, DROC & SWOT Analysis, Forecast Outlook |
| Key Segments | • By Types (Single-Level Cell (SLC), Multi-Level Cell (MLC), Triple-Level Cell (TLC)) •By Application (Cameras, Laptops & PCs, Smartphone & Tablets, Others) •By End-Users (Automotive, Consumer Electronics, Enterprise, Healthcare, Others) |
| Regional Analysis/Coverage | North America (US, Canada, Mexico), Europe (Eastern Europe [Poland, Romania, Hungary, Turkey, Rest of Eastern Europe] Western Europe] Germany, France, UK, Italy, Spain, Netherlands, Switzerland, Austria, Rest of Western Europe]), Asia Pacific (China, India, Japan, South Korea, Vietnam, Singapore, Australia, Rest of Asia Pacific), Middle East & Africa (Middle East [UAE, Egypt, Saudi Arabia, Qatar, Rest of Middle East], Africa [Nigeria, South Africa, Rest of Africa], Latin America (Brazil, Argentina, Colombia, Rest of Latin America) |
| Company Profiles | Samsung Electronics Co., Ltd., Intel Corporation, Toshiba Memory Corporation, Western Digital Corporation, Micron Technology Inc., SK Hynix Inc., Kingston Technology Company, Inc., Crucial Technology, SanDisk Corporation, Transcend Information Inc., Phison Electronics Corporation, Infineon Technologies AG, Microchip Technology Inc., ON Semiconductor, VIA Technologies Inc., Integrated Silicon Solution Inc., Western Digital Technologies, Inc., ADATA Technology Co., Ltd., Seagate Technology Holdings plc, NetApp, Inc. |
| Key Drivers | • The surge in data-intensive applications like cloud computing, big data analytics, and AI is fueling the need for high-performance storage solutions, with 3D NAND memory providing the necessary density and speed for optimal performance. • The widespread use of smartphones, tablets, and other portable devices drives the demand for compact and efficient storage solutions, with 3D NAND technology offering superior size, speed, and energy efficiency compared to traditional storage options. |
| RESTRAINTS | •Market saturation in consumer electronics and mobile devices results in slower growth in demand for 3D NAND memory, restricting potential expansion. |
Ans: The 3D NAND Flash Memory Market is expected to grow at a CAGR of 17.61% during 2024-2032.
Ans: The 3D NAND Flash Memory Market was USD 17.59 billion in 2023 and is expected to Reach USD 75.44 billion by 2032.
Ans: The surge in data-intensive applications like cloud computing, big data analytics, and AI is fueling the need for high-performance storage solutions, with 3D NAND memory providing the necessary density and speed for optimal performance.
Ans: The “Triple-Level Cell (TLC)” segment dominated the 3D NAND Flash Memory Market.
Ans: Asia-Pacific dominated the 3D NAND Flash Memory Market in 2023.
TABLE OF CONTENT
1. Introduction
1.1 Market Definition
1.2 Scope (Inclusion and Exclusions)
1.3 Research Assumptions
2. Executive Summary
2.1 Market Overview
2.2 Regional Synopsis
2.3 Competitive Summary
3. Research Methodology
3.1 Top-Down Approach
3.2 Bottom-up Approach
3.3. Data Validation
3.4 Primary Interviews
4. Market Dynamics
4.1 Market Analysis
4.1.1 Drivers
4.1.2 Restraints
4.1.3 Opportunities
4.1.4 Challenges
4.2 PESTLE Analysis
4.3 Porter’s Five Forces Model
5. Statistical Insights and Trends Reporting
5.1 Wafer Production Volumes, by Region (2023)
5.2 Chip Design Trends (Historic and Future)
5.3 Fab Capacity Utilization (2023)
5.4 Supply Chain Metrics
6. Competitive Landscape
6.1 List of Major Companies, By Region
6.2 Market Share Analysis, By Region
6.3 Product Benchmarking
6.3.1 Product specifications and features
6.3.2 Pricing
6.4 Strategic Initiatives
6.4.1 Marketing and promotional activities
6.4.2 Distribution and Supply Chain Strategies
6.4.3 Expansion plans and new product launches
6.4.4 Strategic partnerships and collaborations
6.5 Technological Advancements
6.6 Market Positioning and Branding
7. 3D NAND Flash Memory Market Segmentation, By Types
7.1 Chapter Overview
7.2 Single-Level Cell (SLC)
7.2.1 Single-Level Cell (SLC) Market Trends Analysis (2020-2032)
7.2.2 Single-Level Cell (SLC) Market Size Estimates and Forecasts to 2032 (USD Billion)
7.3 Multi-Level Cell (MLC)
7.3.1 Multi-Level Cell (MLC)Market Trends Analysis (2020-2032)
7.3.2 Multi-Level Cell (MLC) Market Size Estimates and Forecasts to 2032 (USD Billion)
7.4 Triple-Level Cell (TLC)
7.3.1 Triple-Level Cell (TLC) Market Trends Analysis (2020-2032)
7.3.2 Triple-Level Cell (TLC) Market Size Estimates and Forecasts to 2032 (USD Billion)
8. 3D NAND Flash Memory Market Segmentation, By Application
8.1 Chapter Overview
8.2 Cameras
8.2.1 Cameras Market Trends Analysis (2020-2032)
8.2.2 Cameras Market Size Estimates and Forecasts to 2032 (USD Billion)
8.3 Laptops & PCs
8.3.1 Laptops & PCs Market Trends Analysis (2020-2032)
8.3.2 Laptops & PCs Market Size Estimates and Forecasts to 2032 (USD Billion)
8.4 Smartphone & Tablets
8.4.1 Smartphone & Tablets Market Trends Analysis (2020-2032)
8.4.2 Smartphone & Tablets Market Size Estimates and Forecasts to 2032 (USD Billion)
8.5 Others
8.4.1 Others Market Trends Analysis (2020-2032)
8.4.2 Others Market Size Estimates and Forecasts to 2032 (USD Billion)
9. 3D NAND Flash Memory Market Segmentation, By End-Users
9.1 Chapter Overview
9.2 Automotive
9.2.1 Automotive Market Trends Analysis (2020-2032)
9.2.2 Automotive Market Size Estimates and Forecasts to 2032 (USD Billion)
9.3 Consumer Electronics
9.3.1 Consumer Electronics Market Trends Analysis (2020-2032)
9.3.2 Consumer Electronics Market Size Estimates and Forecasts to 2032 (USD Billion)
9.4 Enterprise
9.4.1 Enterprise Market Trends Analysis (2020-2032)
9.4.2 Enterprise Market Size Estimates and Forecasts to 2032 (USD Billion)
9.5 Healthcare
9.5.1 Healthcare Market Trends Analysis (2020-2032)
9.5.2 Healthcare Market Size Estimates and Forecasts to 2032 (USD Billion)
9.6 Others
9.6.1 Others Market Trends Analysis (2020-2032)
9.6.2 Others Market Size Estimates and Forecasts to 2032 (USD Billion)
10. Regional Analysis
10.1 Chapter Overview
10.2 North America
10.2.1 Trends Analysis
10.2.2 North America 3D NAND Flash Memory Market Estimates and Forecasts, by Country (2020-2032) (USD Billion)
10.2.3 North America 3D NAND Flash Memory Market Estimates and Forecasts, By Types (2020-2032) (USD Billion)
10.2.4 North America 3D NAND Flash Memory Market Estimates and Forecasts, By Application (2020-2032) (USD Billion)
10.2.5 North America 3D NAND Flash Memory Market Estimates and Forecasts, By End-Users (2020-2032) (USD Billion)
10.2.6 USA
10.2.6.1 USA 3D NAND Flash Memory Market Estimates and Forecasts, By Types (2020-2032) (USD Billion)
10.2.6.2 USA 3D NAND Flash Memory Market Estimates and Forecasts, By Application (2020-2032) (USD Billion)
10.2.6.3 USA 3D NAND Flash Memory Market Estimates and Forecasts, By End-Users (2020-2032) (USD Billion)
10.2.7 Canada
10.2.7.1 Canada 3D NAND Flash Memory Market Estimates and Forecasts, By Types (2020-2032) (USD Billion)
10.2.7.2 Canada 3D NAND Flash Memory Market Estimates and Forecasts, By Application (2020-2032) (USD Billion)
10.2.7.3 Canada 3D NAND Flash Memory Market Estimates and Forecasts, By End-Users (2020-2032) (USD Billion)
10.2.8 Mexico
10.2.8.1 Mexico 3D NAND Flash Memory Market Estimates and Forecasts, By Types (2020-2032) (USD Billion)
10.2.8.2 Mexico 3D NAND Flash Memory Market Estimates and Forecasts, By Application (2020-2032) (USD Billion)
10.2.8.3 Mexico 3D NAND Flash Memory Market Estimates and Forecasts, By End-Users (2020-2032) (USD Billion)
10.3 Europe
10.3.1 Eastern Europe
10.3.1.1 Trends Analysis
10.3.1.2 Eastern Europe 3D NAND Flash Memory Market Estimates and Forecasts, by Country (2020-2032) (USD Billion)
10.3.1.3 Eastern Europe 3D NAND Flash Memory Market Estimates and Forecasts, By Types (2020-2032) (USD Billion)
10.3.1.4 Eastern Europe 3D NAND Flash Memory Market Estimates and Forecasts, By Application (2020-2032) (USD Billion)
10.3.1.5 Eastern Europe 3D NAND Flash Memory Market Estimates and Forecasts, By End-Users (2020-2032) (USD Billion)
10.3.1.6 Poland
10.3.1.6.1 Poland 3D NAND Flash Memory Market Estimates and Forecasts, By Types (2020-2032) (USD Billion)
10.3.1.6.2 Poland 3D NAND Flash Memory Market Estimates and Forecasts, By Application (2020-2032) (USD Billion)
10.3.1.6.3 Poland 3D NAND Flash Memory Market Estimates and Forecasts, By End-Users (2020-2032) (USD Billion)
10.3.1.7 Romania
10.3.1.7.1 Romania 3D NAND Flash Memory Market Estimates and Forecasts, By Types (2020-2032) (USD Billion)
10.3.1.7.2 Romania 3D NAND Flash Memory Market Estimates and Forecasts, By Application (2020-2032) (USD Billion)
10.3.1.7.3 Romania 3D NAND Flash Memory Market Estimates and Forecasts, By End-Users (2020-2032) (USD Billion)
10.3.1.8 Hungary
10.3.1.8.1 Hungary 3D NAND Flash Memory Market Estimates and Forecasts, By Types (2020-2032) (USD Billion)
10.3.1.8.2 Hungary 3D NAND Flash Memory Market Estimates and Forecasts, By Application (2020-2032) (USD Billion)
10.3.1.8.3 Hungary 3D NAND Flash Memory Market Estimates and Forecasts, By End-Users (2020-2032) (USD Billion)
10.3.1.9 Turkey
10.3.1.9.1 Turkey 3D NAND Flash Memory Market Estimates and Forecasts, By Types (2020-2032) (USD Billion)
10.3.1.9.2 Turkey 3D NAND Flash Memory Market Estimates and Forecasts, By Application (2020-2032) (USD Billion)
10.3.1.9.3 Turkey 3D NAND Flash Memory Market Estimates and Forecasts, By End-Users (2020-2032) (USD Billion)
10.3.1.10 Rest of Eastern Europe
10.3.1.10.1 Rest of Eastern Europe 3D NAND Flash Memory Market Estimates and Forecasts, By Types (2020-2032) (USD Billion)
10.3.1.10.2 Rest of Eastern Europe 3D NAND Flash Memory Market Estimates and Forecasts, By Application (2020-2032) (USD Billion)
10.3.1.10.3 Rest of Eastern Europe 3D NAND Flash Memory Market Estimates and Forecasts, By End-Users (2020-2032) (USD Billion)
10.3.2 Western Europe
10.3.2.1 Trends Analysis
10.3.2.2 Western Europe 3D NAND Flash Memory Market Estimates and Forecasts, by Country (2020-2032) (USD Billion)
10.3.2.3 Western Europe 3D NAND Flash Memory Market Estimates and Forecasts, By Types (2020-2032) (USD Billion)
10.3.2.4 Western Europe 3D NAND Flash Memory Market Estimates and Forecasts, By Application (2020-2032) (USD Billion)
10.3.2.5 Western Europe 3D NAND Flash Memory Market Estimates and Forecasts, By End-Users (2020-2032) (USD Billion)
10.3.2.6 Germany
10.3.2.6.1 Germany 3D NAND Flash Memory Market Estimates and Forecasts, By Types (2020-2032) (USD Billion)
10.3.2.6.2 Germany 3D NAND Flash Memory Market Estimates and Forecasts, By Application (2020-2032) (USD Billion)
10.3.2.6.3 Germany 3D NAND Flash Memory Market Estimates and Forecasts, By End-Users (2020-2032) (USD Billion)
10.3.2.7 France
10.3.2.7.1 France 3D NAND Flash Memory Market Estimates and Forecasts, By Types (2020-2032) (USD Billion)
10.3.2.7.2 France 3D NAND Flash Memory Market Estimates and Forecasts, By Application (2020-2032) (USD Billion)
10.3.2.7.3 France 3D NAND Flash Memory Market Estimates and Forecasts, By End-Users (2020-2032) (USD Billion)
10.3.2.8 UK
10.3.2.8.1 UK 3D NAND Flash Memory Market Estimates and Forecasts, By Types (2020-2032) (USD Billion)
10.3.2.8.2 UK 3D NAND Flash Memory Market Estimates and Forecasts, By Application (2020-2032) (USD Billion)
10.3.2.8.3 UK 3D NAND Flash Memory Market Estimates and Forecasts, By End-Users (2020-2032) (USD Billion)
10.3.2.9 Italy
10.3.2.9.1 Italy 3D NAND Flash Memory Market Estimates and Forecasts, By Types (2020-2032) (USD Billion)
10.3.2.9.2 Italy 3D NAND Flash Memory Market Estimates and Forecasts, By Application (2020-2032) (USD Billion)
10.3.2.9.3 Italy 3D NAND Flash Memory Market Estimates and Forecasts, By End-Users (2020-2032) (USD Billion)
10.3.2.10 Spain
10.3.2.10.1 Spain 3D NAND Flash Memory Market Estimates and Forecasts, By Types (2020-2032) (USD Billion)
10.3.2.10.2 Spain 3D NAND Flash Memory Market Estimates and Forecasts, By Application (2020-2032) (USD Billion)
10.3.2.10.3 Spain 3D NAND Flash Memory Market Estimates and Forecasts, By End-Users (2020-2032) (USD Billion)
10.3.2.11 Netherlands
10.3.2.11.1 Netherlands 3D NAND Flash Memory Market Estimates and Forecasts, By Types (2020-2032) (USD Billion)
10.3.2.11.2 Netherlands 3D NAND Flash Memory Market Estimates and Forecasts, By Application (2020-2032) (USD Billion)
10.3.2.11.3 Netherlands 3D NAND Flash Memory Market Estimates and Forecasts, By End-Users (2020-2032) (USD Billion)
10.3.2.12 Switzerland
10.3.2.12.1 Switzerland 3D NAND Flash Memory Market Estimates and Forecasts, By Types (2020-2032) (USD Billion)
10.3.2.12.2 Switzerland 3D NAND Flash Memory Market Estimates and Forecasts, By Application (2020-2032) (USD Billion)
10.3.2.12.3 Switzerland 3D NAND Flash Memory Market Estimates and Forecasts, By End-Users (2020-2032) (USD Billion)
10.3.2.13 Austria
10.3.2.13.1 Austria 3D NAND Flash Memory Market Estimates and Forecasts, By Types (2020-2032) (USD Billion)
10.3.2.13.2 Austria 3D NAND Flash Memory Market Estimates and Forecasts, By Application (2020-2032) (USD Billion)
10.3.2.13.3 Austria 3D NAND Flash Memory Market Estimates and Forecasts, By End-Users (2020-2032) (USD Billion)
10.3.2.14 Rest of Western Europe
10.3.2.14.1 Rest of Western Europe 3D NAND Flash Memory Market Estimates and Forecasts, By Types (2020-2032) (USD Billion)
10.3.2.14.2 Rest of Western Europe 3D NAND Flash Memory Market Estimates and Forecasts, By Application (2020-2032) (USD Billion)
10.3.2.14.3 Rest of Western Europe 3D NAND Flash Memory Market Estimates and Forecasts, By End-Users (2020-2032) (USD Billion)
10.4 Asia-Pacific
10.4.1 Trends Analysis
10.4.2 Asia-Pacific 3D NAND Flash Memory Market Estimates and Forecasts, by Country (2020-2032) (USD Billion)
10.4.3 Asia-Pacific 3D NAND Flash Memory Market Estimates and Forecasts, By Types (2020-2032) (USD Billion)
10.4.4 Asia-Pacific 3D NAND Flash Memory Market Estimates and Forecasts, By Application (2020-2032) (USD Billion)
10.4.5 Asia-Pacific 3D NAND Flash Memory Market Estimates and Forecasts, By End-Users (2020-2032) (USD Billion)
10.4.6 China
10.4.6.1 China 3D NAND Flash Memory Market Estimates and Forecasts, By Types (2020-2032) (USD Billion)
10.4.6.2 China 3D NAND Flash Memory Market Estimates and Forecasts, By Application (2020-2032) (USD Billion)
10.4.6.3 China 3D NAND Flash Memory Market Estimates and Forecasts, By End-Users (2020-2032) (USD Billion)
10.4.7 India
10.4.7.1 India 3D NAND Flash Memory Market Estimates and Forecasts, By Types (2020-2032) (USD Billion)
10.4.7.2 India 3D NAND Flash Memory Market Estimates and Forecasts, By Application (2020-2032) (USD Billion)
10.4.7.3 India 3D NAND Flash Memory Market Estimates and Forecasts, By End-Users (2020-2032) (USD Billion)
10.4.8 Japan
10.4.8.1 Japan 3D NAND Flash Memory Market Estimates and Forecasts, By Types (2020-2032) (USD Billion)
10.4.8.2 Japan 3D NAND Flash Memory Market Estimates and Forecasts, By Application (2020-2032) (USD Billion)
10.4.8.3 Japan 3D NAND Flash Memory Market Estimates and Forecasts, By End-Users (2020-2032) (USD Billion)
10.4.9 South Korea
10.4.9.1 South Korea 3D NAND Flash Memory Market Estimates and Forecasts, By Types (2020-2032) (USD Billion)
10.4.9.2 South Korea 3D NAND Flash Memory Market Estimates and Forecasts, By Application (2020-2032) (USD Billion)
10.4.9.3 South Korea 3D NAND Flash Memory Market Estimates and Forecasts, By End-Users (2020-2032) (USD Billion)
10.4.10 Vietnam
10.4.10.1 Vietnam 3D NAND Flash Memory Market Estimates and Forecasts, By Types (2020-2032) (USD Billion)
10.4.10.2 Vietnam 3D NAND Flash Memory Market Estimates and Forecasts, By Application (2020-2032) (USD Billion)
10.4.10.3 Vietnam 3D NAND Flash Memory Market Estimates and Forecasts, By End-Users (2020-2032) (USD Billion)
10.4.11 Singapore
10.4.11.1 Singapore 3D NAND Flash Memory Market Estimates and Forecasts, By Types (2020-2032) (USD Billion)
10.4.11.2 Singapore 3D NAND Flash Memory Market Estimates and Forecasts, By Application (2020-2032) (USD Billion)
10.4.11.3 Singapore 3D NAND Flash Memory Market Estimates and Forecasts, By End-Users (2020-2032) (USD Billion)
10.4.12 Australia
10.4.12.1 Australia 3D NAND Flash Memory Market Estimates and Forecasts, By Types (2020-2032) (USD Billion)
10.4.12.2 Australia 3D NAND Flash Memory Market Estimates and Forecasts, By Application (2020-2032) (USD Billion)
10.4.12.3 Australia 3D NAND Flash Memory Market Estimates and Forecasts, By End-Users (2020-2032) (USD Billion)
10.4.13 Rest of Asia-Pacific
10.4.13.1 Rest of Asia-Pacific 3D NAND Flash Memory Market Estimates and Forecasts, By Types (2020-2032) (USD Billion)
10.4.13.2 Rest of Asia-Pacific 3D NAND Flash Memory Market Estimates and Forecasts, By Application (2020-2032) (USD Billion)
10.4.13.3 Rest of Asia-Pacific 3D NAND Flash Memory Market Estimates and Forecasts, By End-Users (2020-2032) (USD Billion)
10.5 Middle East and Africa
10.5.1 Middle East
10.5.1.1 Trends Analysis
10.5.1.2 Middle East 3D NAND Flash Memory Market Estimates and Forecasts, by Country (2020-2032) (USD Billion)
10.5.1.3 Middle East 3D NAND Flash Memory Market Estimates and Forecasts, By Types (2020-2032) (USD Billion)
10.5.1.4 Middle East 3D NAND Flash Memory Market Estimates and Forecasts, By Application (2020-2032) (USD Billion)
10.5.1.5 Middle East 3D NAND Flash Memory Market Estimates and Forecasts, By End-Users (2020-2032) (USD Billion)
10.5.1.6 UAE
10.5.1.6.1 UAE 3D NAND Flash Memory Market Estimates and Forecasts, By Types (2020-2032) (USD Billion)
10.5.1.6.2 UAE 3D NAND Flash Memory Market Estimates and Forecasts, By Application (2020-2032) (USD Billion)
10.5.1.6.3 UAE 3D NAND Flash Memory Market Estimates and Forecasts, By End-Users (2020-2032) (USD Billion)
10.5.1.7 Egypt
10.5.1.7.1 Egypt 3D NAND Flash Memory Market Estimates and Forecasts, By Types (2020-2032) (USD Billion)
10.5.1.7.2 Egypt 3D NAND Flash Memory Market Estimates and Forecasts, By Application (2020-2032) (USD Billion)
10.5.1.7.3 Egypt 3D NAND Flash Memory Market Estimates and Forecasts, By End-Users (2020-2032) (USD Billion)
10.5.1.8 Saudi Arabia
10.5.1.8.1 Saudi Arabia 3D NAND Flash Memory Market Estimates and Forecasts, By Types (2020-2032) (USD Billion)
10.5.1.8.2 Saudi Arabia 3D NAND Flash Memory Market Estimates and Forecasts, By Application (2020-2032) (USD Billion)
10.5.1.8.3 Saudi Arabia 3D NAND Flash Memory Market Estimates and Forecasts, By End-Users (2020-2032) (USD Billion)
10.5.1.9 Qatar
10.5.1.9.1 Qatar 3D NAND Flash Memory Market Estimates and Forecasts, By Types (2020-2032) (USD Billion)
10.5.1.9.2 Qatar 3D NAND Flash Memory Market Estimates and Forecasts, By Application (2020-2032) (USD Billion)
10.5.1.9.3 Qatar 3D NAND Flash Memory Market Estimates and Forecasts, By End-Users (2020-2032) (USD Billion)
10.5.1.10 Rest of Middle East
10.5.1.10.1 Rest of Middle East 3D NAND Flash Memory Market Estimates and Forecasts, By Types (2020-2032) (USD Billion)
10.5.1.10.2 Rest of Middle East 3D NAND Flash Memory Market Estimates and Forecasts, By Application (2020-2032) (USD Billion)
10.5.1.10.3 Rest of Middle East 3D NAND Flash Memory Market Estimates and Forecasts, By End-Users (2020-2032) (USD Billion)
10.5.2 Africa
10.5.2.1 Trends Analysis
10.5.2.2 Africa 3D NAND Flash Memory Market Estimates and Forecasts, by Country (2020-2032) (USD Billion)
10.5.2.3 Africa 3D NAND Flash Memory Market Estimates and Forecasts, By Types (2020-2032) (USD Billion)
10.5.2.4 Africa 3D NAND Flash Memory Market Estimates and Forecasts, By Application (2020-2032) (USD Billion)
10.5.2.5 Africa 3D NAND Flash Memory Market Estimates and Forecasts, By End-Users (2020-2032) (USD Billion)
10.5.2.6 South Africa
10.5.2.6.1 South Africa 3D NAND Flash Memory Market Estimates and Forecasts, By Types (2020-2032) (USD Billion)
10.5.2.6.2 South Africa 3D NAND Flash Memory Market Estimates and Forecasts, By Application (2020-2032) (USD Billion)
10.5.2.6.3 South Africa 3D NAND Flash Memory Market Estimates and Forecasts, By End-Users (2020-2032) (USD Billion)
10.5.2.7 Nigeria
10.5.2.7.1 Nigeria 3D NAND Flash Memory Market Estimates and Forecasts, By Types (2020-2032) (USD Billion)
10.5.2.7.2 Nigeria 3D NAND Flash Memory Market Estimates and Forecasts, By Application (2020-2032) (USD Billion)
10.5.2.7.3 Nigeria 3D NAND Flash Memory Market Estimates and Forecasts, By End-Users (2020-2032) (USD Billion)
10.5.2.8 Rest of Africa
10.5.2.8.1 Rest of Africa 3D NAND Flash Memory Market Estimates and Forecasts, By Types (2020-2032) (USD Billion)
10.5.2.8.2 Rest of Africa 3D NAND Flash Memory Market Estimates and Forecasts, By Application (2020-2032) (USD Billion)
10.5.2.8.3 Rest of Africa 3D NAND Flash Memory Market Estimates and Forecasts, By End-Users (2020-2032) (USD Billion)
10.6 Latin America
10.6.1 Trends Analysis
10.6.2 Latin America 3D NAND Flash Memory Market Estimates and Forecasts, by Country (2020-2032) (USD Billion)
10.6.3 Latin America 3D NAND Flash Memory Market Estimates and Forecasts, By Types (2020-2032) (USD Billion)
10.6.4 Latin America 3D NAND Flash Memory Market Estimates and Forecasts, By Application (2020-2032) (USD Billion)
10.6.5 Latin America 3D NAND Flash Memory Market Estimates and Forecasts, By End-Users (2020-2032) (USD Billion)
10.6.6 Brazil
10.6.6.1 Brazil 3D NAND Flash Memory Market Estimates and Forecasts, By Types (2020-2032) (USD Billion)
10.6.6.2 Brazil 3D NAND Flash Memory Market Estimates and Forecasts, By Application (2020-2032) (USD Billion)
10.6.6.3 Brazil 3D NAND Flash Memory Market Estimates and Forecasts, By End-Users (2020-2032) (USD Billion)
10.6.7 Argentina
10.6.7.1 Argentina 3D NAND Flash Memory Market Estimates and Forecasts, By Types (2020-2032) (USD Billion)
10.6.7.2 Argentina 3D NAND Flash Memory Market Estimates and Forecasts, By Application (2020-2032) (USD Billion)
10.6.7.3 Argentina 3D NAND Flash Memory Market Estimates and Forecasts, By End-Users (2020-2032) (USD Billion)
10.6.8 Colombia
10.6.8.1 Colombia 3D NAND Flash Memory Market Estimates and Forecasts, By Types (2020-2032) (USD Billion)
10.6.8.2 Colombia 3D NAND Flash Memory Market Estimates and Forecasts, By Application (2020-2032) (USD Billion)
10.6.8.3 Colombia 3D NAND Flash Memory Market Estimates and Forecasts, By End-Users (2020-2032) (USD Billion)
10.6.9 Rest of Latin America
10.6.9.1 Rest of Latin America 3D NAND Flash Memory Market Estimates and Forecasts, By Types (2020-2032) (USD Billion)
10.6.9.2 Rest of Latin America 3D NAND Flash Memory Market Estimates and Forecasts, By Application (2020-2032) (USD Billion)
10.6.9.3 Rest of Latin America 3D NAND Flash Memory Market Estimates and Forecasts, By End-Users (2020-2032) (USD Billion)
11. Company Profiles
11.1 Samsung Electronics Co., Ltd.
11.1.1 Company Overview
11.1.2 Financial
11.1.3 Products/ Services Offered
11.1.4 SWOT Analysis
11.2 Intel Corporation
11.2.1 Company Overview
11.2.2 Financial
11.2.3 Products/ Services Offered
11.2.4 SWOT Analysis
11.3 Toshiba Memory Corporation
11.3.1 Company Overview
11.3.2 Financial
11.3.3 Products/ Services Offered
11.3.4 SWOT Analysis
11.4 Western Digital Corporation
11.4.1 Company Overview
11.4.2 Financial
11.4.3 Products/ Services Offered
11.4.4 SWOT Analysis
11.5 Micron Technology Inc.
11.5.1 Company Overview
11.5.2 Financial
11.5.3 Products/ Services Offered
11.5.4 SWOT Analysis
11.6 SK Hynix Inc.
11.6.1 Company Overview
11.6.2 Financial
11.6.3 Products/ Services Offered
11.6.4 SWOT Analysis
11.7 Kingston Technology Company, Inc.
11.7.1 Company Overview
11.7.2 Financial
11.7.3 Products/ Services Offered
11.7.4 SWOT Analysis
11.8 Crucial Technology
11.8.1 Company Overview
11.8.2 Financial
11.8.3 Products/ Services Offered
11.8.4 SWOT Analysis
11.9 SanDisk Corporation
11.9.1 Company Overview
11.9.2 Financial
11.9.3 Products/ Services Offered
11.9.4 SWOT Analysis
11.10 Transcend Information Inc.
11.10.1 Company Overview
11.10.2 Financial
11.10.3 Products/ Services Offered
11.10.4 SWOT Analysis
12. Use Cases and Best Practices
13. Conclusion
An accurate research report requires proper strategizing as well as implementation. There are multiple factors involved in the completion of good and accurate research report and selecting the best methodology to compete the research is the toughest part. Since the research reports we provide play a crucial role in any company’s decision-making process, therefore we at SNS Insider always believe that we should choose the best method which gives us results closer to reality. This allows us to reach at a stage wherein we can provide our clients best and accurate investment to output ratio.
Each report that we prepare takes a timeframe of 350-400 business hours for production. Starting from the selection of titles through a couple of in-depth brain storming session to the final QC process before uploading our titles on our website we dedicate around 350 working hours. The titles are selected based on their current market cap and the foreseen CAGR and growth.
The 5 steps process:
Step 1: Secondary Research:
Secondary Research or Desk Research is as the name suggests is a research process wherein, we collect data through the readily available information. In this process we use various paid and unpaid databases which our team has access to and gather data through the same. This includes examining of listed companies’ annual reports, Journals, SEC filling etc. Apart from this our team has access to various associations across the globe across different industries. Lastly, we have exchange relationships with various university as well as individual libraries.

Step 2: Primary Research
When we talk about primary research, it is a type of study in which the researchers collect relevant data samples directly, rather than relying on previously collected data. This type of research is focused on gaining content specific facts that can be sued to solve specific problems. Since the collected data is fresh and first hand therefore it makes the study more accurate and genuine.
We at SNS Insider have divided Primary Research into 2 parts.
Part 1 wherein we interview the KOLs of major players as well as the upcoming ones across various geographic regions. This allows us to have their view over the market scenario and acts as an important tool to come closer to the accurate market numbers. As many as 45 paid and unpaid primary interviews are taken from both the demand and supply side of the industry to make sure we land at an accurate judgement and analysis of the market.
This step involves the triangulation of data wherein our team analyses the interview transcripts, online survey responses and observation of on filed participants. The below mentioned chart should give a better understanding of the part 1 of the primary interview.

Part 2: In this part of primary research the data collected via secondary research and the part 1 of the primary research is validated with the interviews from individual consultants and subject matter experts.
Consultants are those set of people who have at least 12 years of experience and expertise within the industry whereas Subject Matter Experts are those with at least 15 years of experience behind their back within the same space. The data with the help of two main processes i.e., FGDs (Focused Group Discussions) and IDs (Individual Discussions). This gives us a 3rd party nonbiased primary view of the market scenario making it a more dependable one while collation of the data pointers.
Step 3: Data Bank Validation
Once all the information is collected via primary and secondary sources, we run that information for data validation. At our intelligence centre our research heads track a lot of information related to the market which includes the quarterly reports, the daily stock prices, and other relevant information. Our data bank server gets updated every fortnight and that is how the information which we collected using our primary and secondary information is revalidated in real time.

Step 4: QA/QC Process
After all the data collection and validation our team does a final level of quality check and quality assurance to get rid of any unwanted or undesired mistakes. This might include but not limited to getting rid of the any typos, duplication of numbers or missing of any important information. The people involved in this process include technical content writers, research heads and graphics people. Once this process is completed the title gets uploader on our platform for our clients to read it.
Step 5: Final QC/QA Process:
This is the last process and comes when the client has ordered the study. In this process a final QA/QC is done before the study is emailed to the client. Since we believe in giving our clients a good experience of our research studies, therefore, to make sure that we do not lack at our end in any way humanly possible we do a final round of quality check and then dispatch the study to the client.
By Types
Single-Level Cell (SLC)
Multi-Level Cell (MLC)
Triple-Level Cell (TLC)
By Application
Cameras
Laptops & PCs
Smartphone & Tablets
Others
By End-Users
Automotive
Consumer Electronics
Enterprise
Healthcare
Others
Request for Segment Customization as per your Business Requirement: Segment Customization Request
Regional Coverage
North America
US
Canada
Mexico
Europe
Eastern Europe
Poland
Romania
Hungary
Turkey
Rest of Eastern Europe
Western Europe
Germany
France
UK
Italy
Spain
Netherlands
Switzerland
Austria
Rest of Western Europe
Asia Pacific
China
India
Japan
South Korea
Vietnam
Singapore
Australia
Rest of Asia Pacific
Middle East & Africa
Middle East
UAE
Egypt
Saudi Arabia
Qatar
Rest of the Middle East
Africa
Nigeria
South Africa
Rest of Africa
Latin America
Brazil
Argentina
Colombia
Rest of Latin America
Request for Country Level Research Report: Country Level Customization Request
Available Customization
With the given market data, SNS Insider offers customization as per the company’s specific needs. The following customization options are available for the report:
Product Analysis
Criss-Cross segment analysis (e.g. Product X Application)
Product Matrix which gives a detailed comparison of product portfolio of each company
Geographic Analysis
Additional countries in any of the regions
Company Information
Detailed analysis and profiling of additional market players (Up to five)
The SiC Power Device Market was valued at USD 2.5 Billion in 2023 and is expected to reach USD 12.9 Billion by 2032, growing at a CAGR of 19.74% from 2024-2032.
The Powertrain Sensor Market was valued at USD 21.52 billion in 2023 and is projected to reach USD 27.84 billion by 2032, growing at a compound annual growth rate (CAGR) of 2.9% during the forecast period from 2024 to 2032.
The Water-based Heating & Cooling Systems Market Size was valued at USD 37.10 Billion in 2023 and is expected to reach USD 73.53 Billion by 2032 and grow at a CAGR of 7.94% over the forecast period 2024-2032
The Biosensors Market Size was valued at USD 27.84 Billion in 2023 and is expected to grow at a CAGR of 8.2% to reach USD 56.54 Billion by 2032.
The Ultrasonic Cleaning Market Size was valued at USD 1.64 billion in 2023 and is projected to grow at a CAGR of 6.35% to reach USD 2.85 billion by 2032.
The Military Radar Market Size was valued at USD 15.25 Billion in 2023 and is expected to grow at a CAGR of 4.58% to reach USD 22.81 Billion by 2032.

Hi! Click one of our member below to chat on Phone
© 2025 All Rights Reserved by SNS Insider Pvt Ltd


