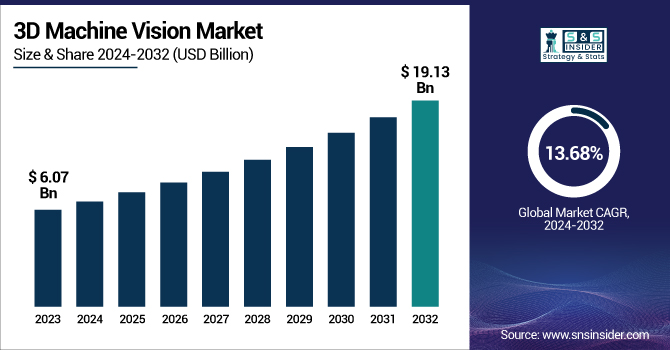
The 3D Machine Vision Market Size was valued at USD 6.07 billion in 2023 and is expected to reach USD 19.13 billion by 2032 and grow at a CAGR of 13.68% over the forecast period 2024-2032.
To Get more information on 3D Machine Vision Market - Request Free Sample Report
The expansion is driven by rising demands for automation, precision inspection, and quality assurance across numerous industries, such as automotive, electronics, pharmaceutical, and packaging. Various 3D machine vision solutions allow more precise detection of objects, measurement of space, and defect inspection. AI, deep learning and smart cameras continue to move adoption forward as well. Asia Pacific is the highest in terms of mass scale manufacturing despite being last in the line-up for overall market share followed by North America as the fastest growing region. The competition in the market is growing with advancement of hardware, software, and integration capabilities.
The U.S. 3D Machine Vision Market size was USD 0.97 billion in 2023 and is expected to reach USD 3.31 billion by 2032, growing at a CAGR of 14.70% over the forecast period of 2024–2032. Factor contributing to such high growth are increasing automation in automotive, electronics, logistics and pharmaceutical sectors. The US market is particularly prone to faster take-up of AI-based vision technology, significant R&D spend and depth of leading industry players. A growing demand for precision inspection, quality inspection, and robot guidance is further driving adoption. The synergy among 3D vision, smart manufacturing, and Industry 4.0 initiatives continues to revolutionize industrial processes and help the U.S. become one of the fastest-growing markets in the world for the 3D vision industry.
Key Drivers:
Growing Adoption of 3D Machine Vision in Automated Manufacturing and Industrial Robotics Drives Market Expansion Across Key Sectors.
The adoption of 3D machine vision technology in automation-based manufacturing and industrial robotics is a major inducer for market growth. Advanced analytics forms a core segment of machine learning, and this process requires a large chunk of data to draw insights. In the automobile, electronics, pharmaceutical food processing sectors, manufacturers are adopting 3D vision systems for assembly, inspection, and material handling processes. Such systems offer more precision, faster production speeds, and improved quality checks through the ability of machines to sense and understand three-dimensional worlds with real-time analysis. So it is bound to increase the total market as the requirement for 3D machine vision in automated systems is expected to continue to rise as companies are looking to make more areas of their operation automated, improving efficiency, reducing errors, and reducing labor costs.
Restrain:
Lack of Skilled Workforce to Operate and Maintain Complex 3D Machine Vision Systems Limits Market Growth.
Sophisticated systems need adequate manpower who can run, maintain and optimize them successfully. 3D machine vision technology requires comprehensive optical knowledge, software coding experience, and system integration capability. This expertise is in shortage in most industries, making it difficult to optimize and sustain these technologies. These types of systems are so complex that it involves ongoing training for engineers and operators to ensure peak performance and address issues. Without personnel adequately trained in operating 3D machine vision systems, firms will be unable to unlock the complete potential of these systems, and return on investment will remain in less-than-optimal stages, with applications being narrowed and limited segments dominating industries, especially in regions where firms experience poor access to technical training programs.
Opportunities:
Growing Demand for Quality Control and Precision Inspection in Manufacturing Sectors Presents Significant Growth Opportunities for 3D Machine Vision Systems.
The rising need for quality control and accuracy inspection in manufacturing industries is one of the major growth opportunities for the 3D machine vision market. With the emerge of 3D machine vision systems, though automated inspection is demanded more widely, it is a good solution because manufactures are under intense pressure to improve their product quality. These systems are capable of scanning minute defects, taking precise measurements, and inspecting product consistency, which ultimately leads to better production quality and less defect rates. They also enable easier workflows by eliminating the need for human inspection — an exercise in error and a time-waster. However, this shift towards improved quality assurance of manufacturing processes opens significant opportunities for 3D machine vision technologies to expand across a range of industries from automotive to electronics to consumer products.
Challenges:
Data Processing Limitations and Real-Time Integration Challenges Impact Performance and Scalability of 3D Machine Vision Systems.
Data processing and integration into a real-time environment present a challenge to the 3D machine vision industry due to the complexities involved. The benefits of 3D vision come along with a huge amount of data that must be processed extremely fast and accurate to provide real-time results. However, data processing can be very intensive on CPU capacity and not always available in most industrial environments. Moreover, the adaptation of such emergent systems with current production lines, sensors and automation platforms; not does not present any technical difficulties, which in turn causes system inefficiencies or delay. These limitations may limit the overall performance of 3D machine vision systems and inhibit scalability of their application, especially in high-volume production industries with stringent operational needs.
By Offering
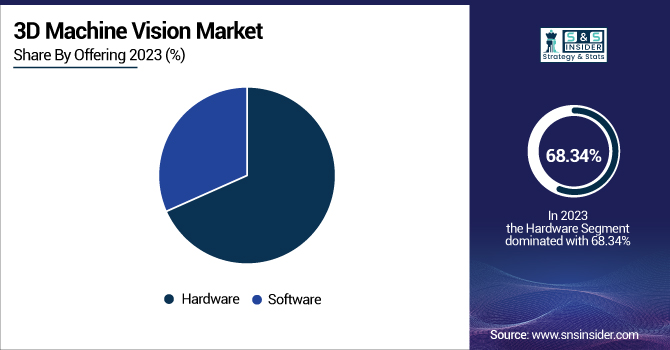
The Hardware segment led the 3D machine vision market, with a 68.34% revenue share in 2023. Demand is driven by needs for parts that deliver high performance, for the processors, cameras, and sensors that comprise the real-time 3D image capture and processing. Companies including Basler AG, Cognex Corporation, and Teledyne DALSA continually launch advanced hardware solutions that enhance precision and speed. Cognex recently announced its latest product release, its "In-Sight 7000" vision system, which features high-performance vision software packed tightly into a compact, scalable solution. As industrial automation increases, the growth of the 3D machine vision hardware market will continue to be driven by the demand for higher-level hardware.
The Software segment is expected to grow at the Fastest CAGR during the projected period for the 3D machine vision market. With the advancement of AI, machine learning, and image processing software in a 3D vision system to deliver better results, faster performance, and increased efficiency. Companies like National Instruments and MVTec Software are developing very complex software solutions, such as MVTec's "HALCON 22.11" software package that allows for advanced 3D image processing. Recent advancements include technologies that improve automation and accuracy in industries like automotive and electronics. With the growing demand for smarter, more aware vision systems, we can expect software solutions to become the leading force for future growth in the space.
By Product
In 2023, PC-based segment accounted for largest in the 3D machine vision market in revenue, contributing 56.27% share of the total revenue. The reason is PC-based systems have high computing power that allows to process high-resolution 3D images in real time, used for complex industrial applications: quality control, robotics, and packaging. PC-based vision systems are continually evolving, with companies such as Teledyne DALSA and Cognex constantly working on them. For example, Cognex introduced its high-performance PC-based vision system, "In-Sight 9000," which brings speed and accuracy to customers. And while the PC-based system continue to be the mainstay of the 3D machine vision market as the industries for precision and automation grow ever.
The Smart Camera-based segment is expected to grow at the Fastest CAGR during the forecast period. The rise of solutions that merge imaging and processing is a significant driver of this growth. They are compact, economical devices that have found applications wherever smaller form factors are required without sacrificing any level of performance assembly line inspection and robotics, for example. Among others, Basler AG and Omron Corporation are promoting new smart camera solutions. The pulse camera line from Basler, for example, integrates image capture and processing capability into one device. The smart camera-based segment would likely propel strong growth in the 3D machine vision market, with more flexible, modular designs sought after by industries.
By Application
In 2023, the Quality Assurance & Inspection segment is dominated with revenue share of 47.90%. This sub segment holds the largest share in the market owing to the significant need of defect free products for inspection among various sectors such as automotive, electronics, and food processing, where quality and consistency of the product is of utmost importance. Manufacturers automate the quest for quality checks to replicate, using advanced 3D machine colours systems created by players like Cognex and Keyence. Take Cognex’s line of In-Sight 9000 products as an example, bringing production quality with high-speed inspection and high-precision, even Fourier machine vision analysis. As industries start to fully embrace quality, demand for 3D machine vision systems for this particular use case will remain a huge growth driver.
The Positioning & Guidance market will lead all others in growth via CAGR over the forecast period 2024-2032 due to a growing demand for high precision robotic guidance and automated positioning in the manufacturing and logistics sectors. The application is driven by the need for highly precise navigation, with machines guided through 3D machine vision systems. FANUC and Omron are focusing on more 3D vision technology, as well, to enhance positioning quality. As a case in point, FANUC's 'iRVision' system integrates robot control and vision for seamless automation. Accordingly, as a greater number of manufacturing industries are moving to modern automated processes, the positioning & guidance segment will witness a significant boost towards overall 3D machine vision market growth.
By End-Use
The Automotive segment is dominated the 3D Machine Vision Market with a 21.30% revenue share in 2023, owing to its various applications in quality control, assembly verification, and robotic guidance. Automobile manufacturers heavily rely on 3D machine vision systems for weld inspection, surface defect detection, component alignment, and many other applications. Industry leaders like Cognex and Keyence have introduced advanced, automotive-specific 3D vision solutions. The Cognex 3D-A1000 dimensioning system, for example, provides real-time inspection of parts moving through lines and other environments. The automotive space is still moving toward automation and EV manufacturing, which both enables market propagation of 3D vision implementation.
The Food & Beverage segment will witness the Fastest CAGR in next forecast period 2024-2032. and owing to increasing needs for hygiene, safety, and quality assurance. Reducer of handling time and product defects 3D machine vision reduces human intervention for detecting packaging defects, monitoring fill levels, and ensuring product uniformity. SICK AG, OAL, etc. are developing camera–based solutions in food industry. The system OAL has integrated and is using for its legal-parties, food vision systems has been known as OAL's 'APRIL Eye' 3D vision system and is a proven solution for viewing food products with high accuracy, food portioning and checking the quality of the food item. Amid this growing threat of regulation and customer demands for 100% perfect goods, the food & beverage sector is rapidly adopting 3D machine vision technologies.
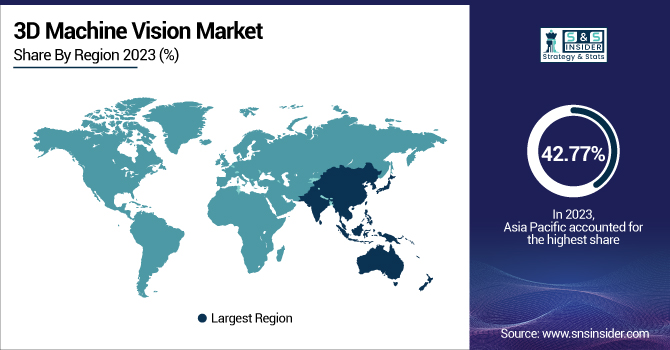
In 2023, Asia Pacific region was the dominated region for the 3D machine vision market with an revenue share of 42.77%, which is due to high rate of industrialization, manufacturing growth, and adoption of automation solutions across the economies of China, Japan, South Korea, and India. The abundance of top electronics and automotive manufacturers in the region that invest heavily in next-generation inspection tools is a key contributor to the growth. Product innovation in this space is being propelled by global competitors such as Keyence (Japan) and Hikrobot (China), with releases like Keyence's LJ-X8000 series offering ultra-high-speed 3D profiling. As more Asian Pacific industries move toward Industry 4.0, the demand for 3D machine vision systems will likely remain strong.
The market for 3D machine vision is anticipated to grow at the highest CAGR in North America during the forecast period 2024 to 2032 owing to increasing automation adoption, adoption of new technologies, and increased R&D expenditure in sectors including aerospace, automotive, and pharmaceuticals. The presence of leading companies such as Cognex Corporation and Teledyne Technologies, who are consistently introducing innovative offerings, also bodes well for the region. Cognex is an example of this with its VisionPro software release, which boosts AI-driven 3D inspection capabilities. In addition, government funding for smart manufacturing and robotics R&D accelerates adoption. During the forecast period, these drivers will make North America a high growth market for 3D machine vision.
Get Customized Report as per Your Business Requirement - Enquiry Now
Basler AG – (Basler blaze 3D Camera, Basler ToF Camera)
Cognex Corporation – (In-Sight L38 3D Vision System, VisionPro 3D Laser Displacement Sensor)
National Instruments Corporation – (NI Vision Development Module, NI Smart Camera)
OMRON Corporation – (FH-SMD 3D Vision Sensor, FH-3D Vision Sensor)
Sick AG – (Ranger3 3D Camera, TriSpector1000 3D Vision Sensor)
Allied Vision Technologies GmbH – (Alvium 1800 U-501m, Goldeye G-032 SWIR)
Softweb Solutions Inc. (An Avnet Company) – (Smart Vision Inspection System, AI-based Defect Detection System)
Visionatics Inc. – (VisionMaster 3D Inspection System, VisionMaster 3D Profilometer)
Keyence Corporation – (XT Series 3D Vision System, XG-X Series Customizable Vision System)
National Instruments Corporation – (NI Vision Development Module, NI Smart Camera)
Microscan Systems, Inc. – (MicroHAWK MV Smart Camera, Omron Microscan Vision HAWK 5X)
July 2024, SICK AG expanded its Nova software platform to support the Ruler3000, enabling fast and precise high-end 3D vision applications. This advancement allows users to deploy custom applications quickly, enhancing production efficiency.
May 2024, Allied Vision showcased its Alvium camera equipped with a liquid lens from Optotune at the Automate trade show in Chicago. This combination offers enhanced flexibility and performance for various imaging applications.
| Report Attributes | Details |
|---|---|
| Market Size in 2023 | USD 6.07 Billion |
| Market Size by 2032 | USD 19.13 Billion |
| CAGR | CAGR of 13.68 % From 2024 to 2032 |
| Base Year | 2023 |
| Forecast Period | 2024-2032 |
| Historical Data | 2020-2022 |
| Report Scope & Coverage | Market Size, Segments Analysis, Competitive Landscape, Regional Analysis, DROC & SWOT Analysis, Forecast Outlook |
| Key Segments | •By Offering - (Hardware, Software) •By Product - (PC Based, Smart Camera Based) •By Application - (Quality Assurance & Inspection, Positioning & Guidance, Measurement, Identification) •By End Use - (Automotive, Pharmaceuticals & Chemicals, Electronics & Semiconductor, Pulp & Paper, Printing & Labeling, Food & Beverage ,Glass & Metal, Postal & Logistics, Others) |
| Regional Analysis/Coverage | North America (US, Canada, Mexico), Europe (Eastern Europe [Poland, Romania, Hungary, Turkey, Rest of Eastern Europe] Western Europe] Germany, France, UK, Italy, Spain, Netherlands, Switzerland, Austria, Rest of Western Europe]), Asia Pacific (China, India, Japan, South Korea, Vietnam, Singapore, Australia, Rest of Asia Pacific), Middle East & Africa (Middle East [UAE, Egypt, Saudi Arabia, Qatar, Rest of Middle East], Africa [Nigeria, South Africa, Rest of Africa], Latin America (Brazil, Argentina, Colombia, Rest of Latin America) |
| Company Profiles | Basler AG, Cognex Corporation, National Instruments Corporation, OMRON Corporation, Sick AG, Allied Vision Technologies GmbH, Softweb Solutions Inc. (An Avnet Company), Visionatics Inc., Keyence Corporation, National Instruments Corporation |
Ans: The 3D Machine Vision Market is expected to grow at a CAGR of 13.68% from 2024-2032.
Ans: The 3D Machine Vision Market size was USD 6.07 billion in 2023 and is expected to reach USD 19.13 billion by 2032.
Ans: The major growth factor of the 3D Machine Vision Market is the increasing automation across industries demanding accurate, real-time inspection, measurement, and quality control solutions.
Ans: The Hardware segment dominated the 3D Machine Vision Market.
Ans: Asia Pacific dominated the 3D Machine Vision Market in 2023.
Table Of Content
1. Introduction
1.1 Market Definition
1.2 Scope (Inclusion and Exclusions)
1.3 Research Assumptions
2. Executive Summary
2.1 Market Overview
2.2 Regional Synopsis
2.3 Competitive Summary
3. Research Methodology
3.1 Top-Down Approach
3.2 Bottom-up Approach
3.3. Data Validation
3.4 Primary Interviews
4. Market Dynamics Impact Analysis
4.1 Market Driving Factors Analysis
4.1.1 Drivers
4.1.2 Restraints
4.1.3 Opportunities
4.1.4 Challenges
4.2 PESTLE Analysis
4.3 Porter’s Five Forces Model
5. Statistical Insights and Trends Reporting
5.1 Price Trends & Cost Analysis, 2023
5.2 Value Chain Analysis, 2023
5.3 Operational Efficiency Gains, 2023
5.4 Patent & Innovation Trends
6. Competitive Landscape
6.1 List of Major Companies, By Region
6.2 Market Share Analysis, By Region
6.3 Product Benchmarking
6.3.1 Product specifications and features
6.3.2 Pricing
6.4 Strategic Initiatives
6.4.1 Marketing and promotional activities
6.4.2 Distribution and Supply Chain Strategies
6.4.3 Expansion plans and new product launches
6.4.4 Strategic partnerships and collaborations
6.5 Technological Advancements
6.6 Market Positioning and Branding
7. 3D Machine Vision Market Segmentation, By Offering
7.1 Chapter Overview
7.2 Hardware
7.2.1 Hardware Market Trends Analysis (2020-2032)
7.2.2 Hardware Market Size Estimates and Forecasts to 2032 (USD Billion)
7.3 Software
7.3.1 Software Market Trends Analysis (2020-2032)
7.3.2 Software Market Size Estimates and Forecasts to 2032 (USD Billion)
8. 3D Machine Vision Market Segmentation, By Product
8.1 Chapter Overview
8.2 PC Based
8.2.1 PC Based Market Trends Analysis (2020-2032)
8.2.2 PC Based Market Size Estimates and Forecasts to 2032 (USD Billion)
8.3 Smart Camera Based
8.3.1 Smart Camera Based Market Trends Analysis (2020-2032)
8.3.2 Smart Camera Based Market Size Estimates and Forecasts to 2032 (USD Billion)
9. 3D Machine Vision Market Segmentation, By Application
9.1 Chapter Overview
9.2 Quality Assurance & Inspection
9.2.1 Quality Assurance & Inspection Market Trends Analysis (2020-2032)
9.2.2 Quality Assurance & Inspection Market Size Estimates and Forecasts to 2032 (USD Billion)
9.3 Positioning & Guidance
9.3.1 Positioning & Guidance Market Trends Analysis (2020-2032)
9.3.2 Positioning & Guidance Market Size Estimates and Forecasts to 2032 (USD Billion)
9.4 Measurement
9.4.1 Measurement Market Trends Analysis (2020-2032)
9.4.2 Measurement Market Size Estimates and Forecasts to 2032 (USD Billion)
9.5 Identification
9.5.1 Identification Market Trends Analysis (2020-2032)
9.5.2 Identification Market Size Estimates and Forecasts to 2032 (USD Billion)
10. 3D Machine Vision Market Segmentation, By End Use
10.1 Chapter Overview
10.2 Automotive
10.2.1 Automotive Market Trends Analysis (2020-2032)
10.2.2 Automotive Market Size Estimates and Forecasts to 2032 (USD Billion)
10.3 Pharmaceuticals & Chemicals
10.3.1 Pharmaceuticals & Chemicals Market Trends Analysis (2020-2032)
10.3.2 Pharmaceuticals & Chemicals Market Size Estimates and Forecasts to 2032 (USD Billion)
10.4 Electronics & Semiconductor
10.4.1 Electronics & Semiconductor Market Trends Analysis (2020-2032)
10.4.2 Electronics & Semiconductor Market Size Estimates and Forecasts to 2032 (USD Billion)
10.5 Pulp & Paper
10.5.1 Pulp & Paper Market Trends Analysis (2020-2032)
10.5.2 Pulp & Paper Market Size Estimates and Forecasts to 2032 (USD Billion)
10.6 Printing & Labeling
10.6.1 Printing & Labeling Market Trends Analysis (2020-2032)
10.6.2 Printing & Labeling Market Size Estimates and Forecasts to 2032 (USD Billion)
10.7 Food & Beverage
10.7.1 Food & Beverage Market Trends Analysis (2020-2032)
10.7.2 Food & Beverage Market Size Estimates and Forecasts to 2032 (USD Billion)
10.8 Glass & Metal
10.8.1 Glass & Metal Market Trends Analysis (2020-2032)
10.8.2 Glass & Metal Market Size Estimates and Forecasts to 2032 (USD Billion)
10.9 Postal & Logistics
10.9.1 Postal & Logistics Market Trends Analysis (2020-2032)
10.9.2 Postal & Logistics Market Size Estimates and Forecasts to 2032 (USD Billion)
10.10 Others
10.10.1 Others Market Trends Analysis (2020-2032)
10.10.2 Others Market Size Estimates and Forecasts to 2032 (USD Billion)
11. Regional Analysis
11.1 Chapter Overview
11.2 North America
11.2.1 Trends Analysis
11.2.2 North America 3D Machine Vision Market Estimates and Forecasts, by Country (2020-2032) (USD Billion)
11.2.3 North America 3D Machine Vision Market Estimates and Forecasts, By Offering (2020-2032) (USD Billion)
11.2.4 North America 3D Machine Vision Market Estimates and Forecasts, By Product (2020-2032) (USD Billion)
11.2.5 North America 3D Machine Vision Market Estimates and Forecasts, By Application (2020-2032) (USD Billion)
11.2.6 North America 3D Machine Vision Market Estimates and Forecasts, By End Use (2020-2032) (USD Billion)
11.2.7 USA
11.2.7.1 USA 3D Machine Vision Market Estimates and Forecasts, By Offering (2020-2032) (USD Billion)
11.2.7.2 USA 3D Machine Vision Market Estimates and Forecasts, By Product (2020-2032) (USD Billion)
11.2.7.3 USA 3D Machine Vision Market Estimates and Forecasts, By Application (2020-2032) (USD Billion)
11.2.7.4 USA 3D Machine Vision Market Estimates and Forecasts, By End Use (2020-2032) (USD Billion)
11.2.8 Canada
11.2.8.1 Canada 3D Machine Vision Market Estimates and Forecasts, By Offering (2020-2032) (USD Billion)
11.2.8.2 Canada 3D Machine Vision Market Estimates and Forecasts, By Product (2020-2032) (USD Billion)
11.2.8.3 Canada 3D Machine Vision Market Estimates and Forecasts, By Application (2020-2032) (USD Billion)
11.2.8.4 Canada 3D Machine Vision Market Estimates and Forecasts, By End Use (2020-2032) (USD Billion)
11.2.9 Mexico
11.2.9.1 Mexico 3D Machine Vision Market Estimates and Forecasts, By Offering (2020-2032) (USD Billion)
11.2.9.2 Mexico 3D Machine Vision Market Estimates and Forecasts, By Product (2020-2032) (USD Billion)
11.2.9.3 Mexico 3D Machine Vision Market Estimates and Forecasts, By Application (2020-2032) (USD Billion)
11.2.9.4 Mexico 3D Machine Vision Market Estimates and Forecasts, By End Use (2020-2032) (USD Billion)
11.3 Europe
11.3.1 Eastern Europe
11.3.1.1 Trends Analysis
11.3.1.2 Eastern Europe 3D Machine Vision Market Estimates and Forecasts, by Country (2020-2032) (USD Billion)
11.3.1.3 Eastern Europe 3D Machine Vision Market Estimates and Forecasts, By Offering (2020-2032) (USD Billion)
11.3.1.4 Eastern Europe 3D Machine Vision Market Estimates and Forecasts, By Product (2020-2032) (USD Billion)
11.3.1.5 Eastern Europe 3D Machine Vision Market Estimates and Forecasts, By Application (2020-2032) (USD Billion)
11.3.1.6 Eastern Europe 3D Machine Vision Market Estimates and Forecasts, By End Use (2020-2032) (USD Billion)
11.3.1.7 Poland
11.3.1.7.1 Poland 3D Machine Vision Market Estimates and Forecasts, By Offering (2020-2032) (USD Billion)
11.3.1.7.2 Poland 3D Machine Vision Market Estimates and Forecasts, By Product (2020-2032) (USD Billion)
11.3.1.7.3 Poland 3D Machine Vision Market Estimates and Forecasts, By Application (2020-2032) (USD Billion)
11.3.1.7.4 Poland 3D Machine Vision Market Estimates and Forecasts, By End Use (2020-2032) (USD Billion)
11.3.1.8 Romania
11.3.1.8.1 Romania 3D Machine Vision Market Estimates and Forecasts, By Offering (2020-2032) (USD Billion)
11.3.1.8.2 Romania 3D Machine Vision Market Estimates and Forecasts, By Product (2020-2032) (USD Billion)
11.3.1.8.3 Romania 3D Machine Vision Market Estimates and Forecasts, By Application (2020-2032) (USD Billion)
11.3.1.8.4 Romania 3D Machine Vision Market Estimates and Forecasts, By End Use (2020-2032) (USD Billion)
11.3.1.9 Hungary
11.3.1.9.1 Hungary 3D Machine Vision Market Estimates and Forecasts, By Offering (2020-2032) (USD Billion)
11.3.1.9.2 Hungary 3D Machine Vision Market Estimates and Forecasts, By Product (2020-2032) (USD Billion)
11.3.1.9.3 Hungary 3D Machine Vision Market Estimates and Forecasts, By Application (2020-2032) (USD Billion)
11.3.1.9.4 Hungary 3D Machine Vision Market Estimates and Forecasts, By End Use (2020-2032) (USD Billion)
11.3.1.10 Turkey
11.3.1.10.1 Turkey 3D Machine Vision Market Estimates and Forecasts, By Offering (2020-2032) (USD Billion)
11.3.1.10.2 Turkey 3D Machine Vision Market Estimates and Forecasts, By Product (2020-2032) (USD Billion)
11.3.1.10.3 Turkey 3D Machine Vision Market Estimates and Forecasts, By Application (2020-2032) (USD Billion)
11.3.1.10.4 Turkey 3D Machine Vision Market Estimates and Forecasts, By End Use (2020-2032) (USD Billion)
11.3.1.11 Rest of Eastern Europe
11.3.1.11.1 Rest of Eastern Europe 3D Machine Vision Market Estimates and Forecasts, By Offering (2020-2032) (USD Billion)
11.3.1.11.2 Rest of Eastern Europe 3D Machine Vision Market Estimates and Forecasts, By Product (2020-2032) (USD Billion)
11.3.1.11.3 Rest of Eastern Europe 3D Machine Vision Market Estimates and Forecasts, By Application (2020-2032) (USD Billion)
11.3.1.11.4 Rest of Eastern Europe 3D Machine Vision Market Estimates and Forecasts, By End Use (2020-2032) (USD Billion)
11.3.2 Western Europe
11.3.2.1 Trends Analysis
11.3.2.2 Western Europe 3D Machine Vision Market Estimates and Forecasts, by Country (2020-2032) (USD Billion)
11.3.2.3 Western Europe 3D Machine Vision Market Estimates and Forecasts, By Offering (2020-2032) (USD Billion)
11.3.2.4 Western Europe 3D Machine Vision Market Estimates and Forecasts, By Product (2020-2032) (USD Billion)
11.3.2.5 Western Europe 3D Machine Vision Market Estimates and Forecasts, By Application (2020-2032) (USD Billion)
11.3.2.6 Western Europe 3D Machine Vision Market Estimates and Forecasts, By End Use (2020-2032) (USD Billion)
11.3.2.7 Germany
11.3.2.7.1 Germany 3D Machine Vision Market Estimates and Forecasts, By Offering (2020-2032) (USD Billion)
11.3.2.7.2 Germany 3D Machine Vision Market Estimates and Forecasts, By Product (2020-2032) (USD Billion)
11.3.2.7.3 Germany 3D Machine Vision Market Estimates and Forecasts, By Application (2020-2032) (USD Billion)
11.3.2.7.4 Germany 3D Machine Vision Market Estimates and Forecasts, By End Use (2020-2032) (USD Billion)
11.3.2.8 France
11.3.2.8.1 France 3D Machine Vision Market Estimates and Forecasts, By Offering (2020-2032) (USD Billion)
11.3.2.8.2 France 3D Machine Vision Market Estimates and Forecasts, By Product (2020-2032) (USD Billion)
11.3.2.8.3 France 3D Machine Vision Market Estimates and Forecasts, By Application (2020-2032) (USD Billion)
11.3.2.8.4 France 3D Machine Vision Market Estimates and Forecasts, By End Use (2020-2032) (USD Billion)
11.3.2.9 UK
11.3.2.9.1 UK 3D Machine Vision Market Estimates and Forecasts, By Offering (2020-2032) (USD Billion)
11.3.2.9.2 UK 3D Machine Vision Market Estimates and Forecasts, By Product (2020-2032) (USD Billion)
11.3.2.9.3 UK 3D Machine Vision Market Estimates and Forecasts, By Application (2020-2032) (USD Billion)
11.3.2.9.4 UK 3D Machine Vision Market Estimates and Forecasts, By End Use (2020-2032) (USD Billion)
11.3.2.10 Italy
11.3.2.10.1 Italy 3D Machine Vision Market Estimates and Forecasts, By Offering (2020-2032) (USD Billion)
11.3.2.10.2 Italy 3D Machine Vision Market Estimates and Forecasts, By Product (2020-2032) (USD Billion)
11.3.2.10.3 Italy 3D Machine Vision Market Estimates and Forecasts, By Application (2020-2032) (USD Billion)
11.3.2.10.4 Italy 3D Machine Vision Market Estimates and Forecasts, By End Use (2020-2032) (USD Billion)
11.3.2.11 Spain
11.3.2.11.1 Spain 3D Machine Vision Market Estimates and Forecasts, By Offering (2020-2032) (USD Billion)
11.3.2.11.2 Spain 3D Machine Vision Market Estimates and Forecasts, By Product (2020-2032) (USD Billion)
11.3.2.11.3 Spain 3D Machine Vision Market Estimates and Forecasts, By Application (2020-2032) (USD Billion)
11.3.2.11.4 Spain 3D Machine Vision Market Estimates and Forecasts, By End Use (2020-2032) (USD Billion)
11.3.2.12 Netherlands
11.3.2.12.1 Netherlands 3D Machine Vision Market Estimates and Forecasts, By Offering (2020-2032) (USD Billion)
11.3.2.12.2 Netherlands 3D Machine Vision Market Estimates and Forecasts, By Product (2020-2032) (USD Billion)
11.3.2.12.3 Netherlands 3D Machine Vision Market Estimates and Forecasts, By Application (2020-2032) (USD Billion)
11.3.2.12.4 Netherlands 3D Machine Vision Market Estimates and Forecasts, By End Use (2020-2032) (USD Billion)
11.3.2.13 Switzerland
11.3.2.13.1 Switzerland 3D Machine Vision Market Estimates and Forecasts, By Offering (2020-2032) (USD Billion)
11.3.2.13.2 Switzerland 3D Machine Vision Market Estimates and Forecasts, By Product (2020-2032) (USD Billion)
11.3.2.13.3 Switzerland 3D Machine Vision Market Estimates and Forecasts, By Application (2020-2032) (USD Billion)
11.3.2.13.4 Switzerland 3D Machine Vision Market Estimates and Forecasts, By End Use (2020-2032) (USD Billion)
11.3.2.14 Austria
11.3.2.14.1 Austria 3D Machine Vision Market Estimates and Forecasts, By Offering (2020-2032) (USD Billion)
11.3.2.14.2 Austria 3D Machine Vision Market Estimates and Forecasts, By Product (2020-2032) (USD Billion)
11.3.2.14.3 Austria 3D Machine Vision Market Estimates and Forecasts, By Application (2020-2032) (USD Billion)
11.3.2.14.4 Austria 3D Machine Vision Market Estimates and Forecasts, By End Use (2020-2032) (USD Billion)
11.3.2.15 Rest of Western Europe
11.3.2.15.1 Rest of Western Europe 3D Machine Vision Market Estimates and Forecasts, By Offering (2020-2032) (USD Billion)
11.3.2.15.2 Rest of Western Europe 3D Machine Vision Market Estimates and Forecasts, By Product (2020-2032) (USD Billion)
11.3.2.15.3 Rest of Western Europe 3D Machine Vision Market Estimates and Forecasts, By Application (2020-2032) (USD Billion)
11.3.2.15.4 Rest of Western Europe 3D Machine Vision Market Estimates and Forecasts, By End Use (2020-2032) (USD Billion)
11.4 Asia Pacific
11.4.1 Trends Analysis
11.4.2 Asia Pacific 3D Machine Vision Market Estimates and Forecasts, by Country (2020-2032) (USD Billion)
11.4.3 Asia Pacific 3D Machine Vision Market Estimates and Forecasts, By Offering (2020-2032) (USD Billion)
11.4.4 Asia Pacific 3D Machine Vision Market Estimates and Forecasts, By Product (2020-2032) (USD Billion)
11.4.5 Asia Pacific 3D Machine Vision Market Estimates and Forecasts, By Application (2020-2032) (USD Billion)
11.4.6 Asia Pacific 3D Machine Vision Market Estimates and Forecasts, By End Use (2020-2032) (USD Billion)
11.4.7 China
11.4.7.1 China 3D Machine Vision Market Estimates and Forecasts, By Offering (2020-2032) (USD Billion)
11.4.7.2 China 3D Machine Vision Market Estimates and Forecasts, By Product (2020-2032) (USD Billion)
11.4.7.3 China 3D Machine Vision Market Estimates and Forecasts, By Application (2020-2032) (USD Billion)
11.4.7.4 China 3D Machine Vision Market Estimates and Forecasts, By End Use (2020-2032) (USD Billion)
11.4.8 India
11.4.8.1 India 3D Machine Vision Market Estimates and Forecasts, By Offering (2020-2032) (USD Billion)
11.4.8.2 India 3D Machine Vision Market Estimates and Forecasts, By Product (2020-2032) (USD Billion)
11.4.8.3 India 3D Machine Vision Market Estimates and Forecasts, By Application (2020-2032) (USD Billion)
11.4.8.4 India 3D Machine Vision Market Estimates and Forecasts, By End Use (2020-2032) (USD Billion)
11.4.9 Japan
11.4.9.1 Japan 3D Machine Vision Market Estimates and Forecasts, By Offering (2020-2032) (USD Billion)
11.4.9.2 Japan 3D Machine Vision Market Estimates and Forecasts, By Product (2020-2032) (USD Billion)
11.4.9.3 Japan 3D Machine Vision Market Estimates and Forecasts, By Application (2020-2032) (USD Billion)
11.4.9.4 Japan 3D Machine Vision Market Estimates and Forecasts, By End Use (2020-2032) (USD Billion)
11.4.10 South Korea
11.4.10.1 South Korea 3D Machine Vision Market Estimates and Forecasts, By Offering (2020-2032) (USD Billion)
11.4.10.2 South Korea 3D Machine Vision Market Estimates and Forecasts, By Product (2020-2032) (USD Billion)
11.4.10.3 South Korea 3D Machine Vision Market Estimates and Forecasts, By Application (2020-2032) (USD Billion)
11.4.10.4 South Korea 3D Machine Vision Market Estimates and Forecasts, By End Use (2020-2032) (USD Billion)
11.4.11 Vietnam
11.4.11.1 Vietnam 3D Machine Vision Market Estimates and Forecasts, By Offering (2020-2032) (USD Billion)
11.4.11.2 Vietnam 3D Machine Vision Market Estimates and Forecasts, By Product (2020-2032) (USD Billion)
11.4.11.3 Vietnam 3D Machine Vision Market Estimates and Forecasts, By Application (2020-2032) (USD Billion)
11.4.11.4 Vietnam 3D Machine Vision Market Estimates and Forecasts, By End Use (2020-2032) (USD Billion)
11.4.12 Singapore
11.4.12.1 Singapore 3D Machine Vision Market Estimates and Forecasts, By Offering (2020-2032) (USD Billion)
11.4.12.2 Singapore 3D Machine Vision Market Estimates and Forecasts, By Product (2020-2032) (USD Billion)
11.4.12.3 Singapore 3D Machine Vision Market Estimates and Forecasts, By Application (2020-2032) (USD Billion)
11.4.12.4 Singapore 3D Machine Vision Market Estimates and Forecasts, By End Use (2020-2032) (USD Billion)
11.4.13 Australia
11.4.13.1 Australia 3D Machine Vision Market Estimates and Forecasts, By Offering (2020-2032) (USD Billion)
11.4.13.2 Australia 3D Machine Vision Market Estimates and Forecasts, By Product (2020-2032) (USD Billion)
11.4.13.3 Australia 3D Machine Vision Market Estimates and Forecasts, By Application (2020-2032) (USD Billion)
11.4.13.4 Australia 3D Machine Vision Market Estimates and Forecasts, By End Use (2020-2032) (USD Billion)
11.4.14 Rest of Asia Pacific
11.4.14.1 Rest of Asia Pacific 3D Machine Vision Market Estimates and Forecasts, By Offering (2020-2032) (USD Billion)
11.4.14.2 Rest of Asia Pacific 3D Machine Vision Market Estimates and Forecasts, By Product (2020-2032) (USD Billion)
11.4.14.3 Rest of Asia Pacific 3D Machine Vision Market Estimates and Forecasts, By Application (2020-2032) (USD Billion)
11.4.14.4 Rest of Asia Pacific 3D Machine Vision Market Estimates and Forecasts, By End Use (2020-2032) (USD Billion)
11.5 Middle East and Africa
11.5.1 Middle East
11.5.1.1 Trends Analysis
11.5.1.2 Middle East 3D Machine Vision Market Estimates and Forecasts, by Country (2020-2032) (USD Billion)
11.5.1.3 Middle East 3D Machine Vision Market Estimates and Forecasts, By Offering (2020-2032) (USD Billion)
11.5.1.4 Middle East 3D Machine Vision Market Estimates and Forecasts, By Product (2020-2032) (USD Billion)
11.5.1.5 Middle East 3D Machine Vision Market Estimates and Forecasts, By Application (2020-2032) (USD Billion)
11.5.1.6 Middle East 3D Machine Vision Market Estimates and Forecasts, By End Use (2020-2032) (USD Billion)
11.5.1.7 UAE
11.5.1.7.1 UAE 3D Machine Vision Market Estimates and Forecasts, By Offering (2020-2032) (USD Billion)
11.5.1.7.2 UAE 3D Machine Vision Market Estimates and Forecasts, By Product (2020-2032) (USD Billion)
11.5.1.7.3 UAE 3D Machine Vision Market Estimates and Forecasts, By Application (2020-2032) (USD Billion)
11.5.1.7.4 UAE 3D Machine Vision Market Estimates and Forecasts, By End Use (2020-2032) (USD Billion)
11.5.1.8 Egypt
11.5.1.8.1 Egypt 3D Machine Vision Market Estimates and Forecasts, By Offering (2020-2032) (USD Billion)
11.5.1.8.2 Egypt 3D Machine Vision Market Estimates and Forecasts, By Product (2020-2032) (USD Billion)
11.5.1.8.3 Egypt 3D Machine Vision Market Estimates and Forecasts, By Application (2020-2032) (USD Billion)
11.5.1.8.4 Egypt 3D Machine Vision Market Estimates and Forecasts, By End Use (2020-2032) (USD Billion)
11.5.1.9 Saudi Arabia
11.5.1.9.1 Saudi Arabia 3D Machine Vision Market Estimates and Forecasts, By Offering (2020-2032) (USD Billion)
11.5.1.9.2 Saudi Arabia 3D Machine Vision Market Estimates and Forecasts, By Product (2020-2032) (USD Billion)
11.5.1.9.3 Saudi Arabia 3D Machine Vision Market Estimates and Forecasts, By Application (2020-2032) (USD Billion)
11.5.1.9.4 Saudi Arabia 3D Machine Vision Market Estimates and Forecasts, By End Use (2020-2032) (USD Billion)
11.5.1.10 Qatar
11.5.1.10.1 Qatar 3D Machine Vision Market Estimates and Forecasts, By Offering (2020-2032) (USD Billion)
11.5.1.10.2 Qatar 3D Machine Vision Market Estimates and Forecasts, By Product (2020-2032) (USD Billion)
11.5.1.10.3 Qatar 3D Machine Vision Market Estimates and Forecasts, By Application (2020-2032) (USD Billion)
11.5.1.10.4 Qatar 3D Machine Vision Market Estimates and Forecasts, By End Use (2020-2032) (USD Billion)
11.5.1.11 Rest of Middle East
11.5.1.11.1 Rest of Middle East 3D Machine Vision Market Estimates and Forecasts, By Offering (2020-2032) (USD Billion)
11.5.1.11.2 Rest of Middle East 3D Machine Vision Market Estimates and Forecasts, By Product (2020-2032) (USD Billion)
11.5.1.11.3 Rest of Middle East 3D Machine Vision Market Estimates and Forecasts, By Application (2020-2032) (USD Billion)
11.5.1.11.4 Rest of Middle East 3D Machine Vision Market Estimates and Forecasts, By End Use (2020-2032) (USD Billion)
11.5.2 Africa
11.5.2.1 Trends Analysis
11.5.2.2 Africa 3D Machine Vision Market Estimates and Forecasts, by Country (2020-2032) (USD Billion)
11.5.2.3 Africa 3D Machine Vision Market Estimates and Forecasts, By Offering (2020-2032) (USD Billion)
11.5.2.4 Africa 3D Machine Vision Market Estimates and Forecasts, By Product (2020-2032) (USD Billion)
11.5.2.5 Africa 3D Machine Vision Market Estimates and Forecasts, By Application (2020-2032) (USD Billion)
11.5.2.6 Africa 3D Machine Vision Market Estimates and Forecasts, By End Use (2020-2032) (USD Billion)
11.5.2.7 South Africa
11.5.2.7.1 South Africa 3D Machine Vision Market Estimates and Forecasts, By Offering (2020-2032) (USD Billion)
11.5.2.7.2 South Africa 3D Machine Vision Market Estimates and Forecasts, By Product (2020-2032) (USD Billion)
11.5.2.7.3 South Africa 3D Machine Vision Market Estimates and Forecasts, By Application (2020-2032) (USD Billion)
11.5.2.7.4 South Africa 3D Machine Vision Market Estimates and Forecasts, By End Use (2020-2032) (USD Billion)
11.5.2.8 Nigeria
11.5.2.8.1 Nigeria 3D Machine Vision Market Estimates and Forecasts, By Offering (2020-2032) (USD Billion)
11.5.2.8.2 Nigeria 3D Machine Vision Market Estimates and Forecasts, By Product (2020-2032) (USD Billion)
11.5.2.8.3 Nigeria 3D Machine Vision Market Estimates and Forecasts, By Application (2020-2032) (USD Billion)
11.5.2.8.4 Nigeria 3D Machine Vision Market Estimates and Forecasts, By End Use (2020-2032) (USD Billion)
11.5.2.9 Rest of Africa
11.5.2.9.1 Rest of Africa 3D Machine Vision Market Estimates and Forecasts, By Offering (2020-2032) (USD Billion)
11.5.2.9.2 Rest of Africa 3D Machine Vision Market Estimates and Forecasts, By Product (2020-2032) (USD Billion)
11.5.2.9.3 Rest of Africa 3D Machine Vision Market Estimates and Forecasts, By Application (2020-2032) (USD Billion)
11.5.2.9.4 Rest of Africa 3D Machine Vision Market Estimates and Forecasts, By End Use (2020-2032) (USD Billion)
11.6 Latin America
11.6.1 Trends Analysis
11.6.2 Latin America 3D Machine Vision Market Estimates and Forecasts, by Country (2020-2032) (USD Billion)
11.6.3 Latin America 3D Machine Vision Market Estimates and Forecasts, By Offering (2020-2032) (USD Billion)
11.6.4 Latin America 3D Machine Vision Market Estimates and Forecasts, By Product (2020-2032) (USD Billion)
11.6.5 Latin America 3D Machine Vision Market Estimates and Forecasts, By Application (2020-2032) (USD Billion)
11.6.6 Latin America 3D Machine Vision Market Estimates and Forecasts, By End Use (2020-2032) (USD Billion)
11.6.7 Brazil
11.6.7.1 Brazil 3D Machine Vision Market Estimates and Forecasts, By Offering (2020-2032) (USD Billion)
11.6.7.2 Brazil 3D Machine Vision Market Estimates and Forecasts, By Product (2020-2032) (USD Billion)
11.6.7.3 Brazil 3D Machine Vision Market Estimates and Forecasts, By Application (2020-2032) (USD Billion)
11.6.7.4 Brazil 3D Machine Vision Market Estimates and Forecasts, By End Use (2020-2032) (USD Billion)
11.6.8 Argentina
11.6.8.1 Argentina 3D Machine Vision Market Estimates and Forecasts, By Offering (2020-2032) (USD Billion)
11.6.8.2 Argentina 3D Machine Vision Market Estimates and Forecasts, By Product (2020-2032) (USD Billion)
11.6.8.3 Argentina 3D Machine Vision Market Estimates and Forecasts, By Application (2020-2032) (USD Billion)
11.6.8.4 Argentina 3D Machine Vision Market Estimates and Forecasts, By End Use (2020-2032) (USD Billion)
11.6.9 Colombia
11.6.9.1 Colombia 3D Machine Vision Market Estimates and Forecasts, By Offering (2020-2032) (USD Billion)
11.6.9.2 Colombia 3D Machine Vision Market Estimates and Forecasts, By Product (2020-2032) (USD Billion)
11.6.9.3 Colombia 3D Machine Vision Market Estimates and Forecasts, By Application (2020-2032) (USD Billion)
11.6.9.4 Colombia 3D Machine Vision Market Estimates and Forecasts, By End Use (2020-2032) (USD Billion)
11.6.10 Rest of Latin America
11.6.10.1 Rest of Latin America 3D Machine Vision Market Estimates and Forecasts, By Offering (2020-2032) (USD Billion)
11.6.10.2 Rest of Latin America 3D Machine Vision Market Estimates and Forecasts, By Product (2020-2032) (USD Billion)
11.6.10.3 Rest of Latin America 3D Machine Vision Market Estimates and Forecasts, By Application (2020-2032) (USD Billion)
11.6.10.4 Rest of Latin America 3D Machine Vision Market Estimates and Forecasts, By End Use (2020-2032) (USD Billion)
12. Company Profiles
12.1 Basler AG
12.1.1 Company Overview
12.1.2 Financial
12.1.3 Products/ Services Offered
12.1.4 SWOT Analysis
12.2 Cognex Corporation
12.2.1 Company Overview
12.2.2 Financial
12.2.3 Products/ Services Offered
12.2.4 SWOT Analysis
12.3 National Instruments Corporation
12.3.1 Company Overview
12.3.2 Financial
12.3.3 Products/ Services Offered
12.3.4 SWOT Analysis
12.4 OMRON Corporation
12.4.1 Company Overview
12.4.2 Financial
12.4.3 Products/ Services Offered
12.4.4 SWOT Analysis
12.5 Sick AG
12.5.1 Company Overview
12.5.2 Financial
12.5.3 Products/ Services Offered
12.5.4 SWOT Analysis
12.6 Allied Vision Technologies GmbH
12.6.1 Company Overview
12.6.2 Financial
12.6.3 Products/ Services Offered
12.6.4 SWOT Analysis
12.7 Softweb Solutions Inc. (An Avnet Company)
12.7.1 Company Overview
12.7.2 Financial
12.7.3 Products/ Services Offered
12.7.4 SWOT Analysis
12.8 Visionatics Inc.
12.8.1 Company Overview
12.8.2 Financial
12.8.3 Products/ Services Offered
12.8.4 SWOT Analysis
12.9 Keyence Corporation
12.9.1 Company Overview
12.9.2 Financial
12.9.3 Products/ Services Offered
12.9.4 SWOT Analysis
12.10 Microscan Systems, Inc.
12.10.1 Company Overview
12.10.2 Financial
12.10.3 Products/ Services Offered
12.10.4 SWOT Analysis
13. Use Cases and Best Practices
14. Conclusion
An accurate research report requires proper strategizing as well as implementation. There are multiple factors involved in the completion of good and accurate research report and selecting the best methodology to compete the research is the toughest part. Since the research reports we provide play a crucial role in any company’s decision-making process, therefore we at SNS Insider always believe that we should choose the best method which gives us results closer to reality. This allows us to reach at a stage wherein we can provide our clients best and accurate investment to output ratio.
Each report that we prepare takes a timeframe of 350-400 business hours for production. Starting from the selection of titles through a couple of in-depth brain storming session to the final QC process before uploading our titles on our website we dedicate around 350 working hours. The titles are selected based on their current market cap and the foreseen CAGR and growth.
The 5 steps process:
Step 1: Secondary Research:
Secondary Research or Desk Research is as the name suggests is a research process wherein, we collect data through the readily available information. In this process we use various paid and unpaid databases which our team has access to and gather data through the same. This includes examining of listed companies’ annual reports, Journals, SEC filling etc. Apart from this our team has access to various associations across the globe across different industries. Lastly, we have exchange relationships with various university as well as individual libraries.

Step 2: Primary Research
When we talk about primary research, it is a type of study in which the researchers collect relevant data samples directly, rather than relying on previously collected data. This type of research is focused on gaining content specific facts that can be sued to solve specific problems. Since the collected data is fresh and first hand therefore it makes the study more accurate and genuine.
We at SNS Insider have divided Primary Research into 2 parts.
Part 1 wherein we interview the KOLs of major players as well as the upcoming ones across various geographic regions. This allows us to have their view over the market scenario and acts as an important tool to come closer to the accurate market numbers. As many as 45 paid and unpaid primary interviews are taken from both the demand and supply side of the industry to make sure we land at an accurate judgement and analysis of the market.
This step involves the triangulation of data wherein our team analyses the interview transcripts, online survey responses and observation of on filed participants. The below mentioned chart should give a better understanding of the part 1 of the primary interview.

Part 2: In this part of primary research the data collected via secondary research and the part 1 of the primary research is validated with the interviews from individual consultants and subject matter experts.
Consultants are those set of people who have at least 12 years of experience and expertise within the industry whereas Subject Matter Experts are those with at least 15 years of experience behind their back within the same space. The data with the help of two main processes i.e., FGDs (Focused Group Discussions) and IDs (Individual Discussions). This gives us a 3rd party nonbiased primary view of the market scenario making it a more dependable one while collation of the data pointers.
Step 3: Data Bank Validation
Once all the information is collected via primary and secondary sources, we run that information for data validation. At our intelligence centre our research heads track a lot of information related to the market which includes the quarterly reports, the daily stock prices, and other relevant information. Our data bank server gets updated every fortnight and that is how the information which we collected using our primary and secondary information is revalidated in real time.

Step 4: QA/QC Process
After all the data collection and validation our team does a final level of quality check and quality assurance to get rid of any unwanted or undesired mistakes. This might include but not limited to getting rid of the any typos, duplication of numbers or missing of any important information. The people involved in this process include technical content writers, research heads and graphics people. Once this process is completed the title gets uploader on our platform for our clients to read it.
Step 5: Final QC/QA Process:
This is the last process and comes when the client has ordered the study. In this process a final QA/QC is done before the study is emailed to the client. Since we believe in giving our clients a good experience of our research studies, therefore, to make sure that we do not lack at our end in any way humanly possible we do a final round of quality check and then dispatch the study to the client.
Key Segments:
By Offering
Hardware
Software
By Product
PC Based
Smart Camera Based
By Application
Quality Assurance & Inspection
Positioning & Guidance
Measurement
Identification
By End Use
Automotive
Pharmaceuticals & Chemicals
Electronics & Semiconductor
Pulp & Paper
Printing & Labelling
Food & Beverage (Packaging and Bottling)
Glass & Metal
Postal & Logistics
Others
Request for Segment Customization as per your Business Requirement: Segment Customization Request
Regional Coverage:
North America
US
Canada
Mexico
Europe
Eastern Europe
Poland
Romania
Hungary
Turkey
Rest of Eastern Europe
Western Europe
Germany
France
UK
Italy
Spain
Netherlands
Switzerland
Austria
Rest of Western Europe
Asia Pacific
China
India
Japan
South Korea
Vietnam
Singapore
Australia
Rest of Asia Pacific
Middle East & Africa
Middle East
UAE
Egypt
Saudi Arabia
Qatar
Rest of Middle East
Africa
Nigeria
South Africa
Rest of Africa
Latin America
Brazil
Argentina
Colombia
Rest of Latin America
Request for Country Level Research Report: Country Level Customization Request
Available Customization
With the given market data, SNS Insider offers customization as per the company’s specific needs. The following customization options are available for the report:
Detailed Volume Analysis
Criss-Cross segment analysis (e.g. Product X Application)
Competitive Product Benchmarking
Geographic Analysis
Additional countries in any of the regions
Customized Data Representation
Detailed analysis and profiling of additional market players
Agriculture 4.0 Market was valued at USD 67.2 billion in 2023 and is expected to reach USD 175.54 billion by 2032, growing at a CAGR of 11.30% from 2024-2032.
The Dynamic Random-Access Memory Market was valued at USD 103.10 billion in 2023 and is expected to reach USD 386.45 billion by 2032, growing at a CAGR of 15.91% over the forecast period 2024-2032.
The Underwater Robotics Market Size was valued at USD 4 billion in 2023 and is expected to grow at a CAGR of 14.59% to reach USD 13.59 billion by 2032.
The Wearable Payment Device Market size was valued at USD 55.49 billion in 2023. It is expected to reach USD 174.83 billion by 2032 and grow at a CAGR of 13.6% over the forecast period 2024-2032.
The Automated Border Control Market Size was valued at USD 2.06 Billion in 2023 and is expected to grow at a CAGR of 12.73% to reach USD 6.03 Billion by 2032
The Home Security Systems Market was valued at USD 54.9 billion in 2023 and is projected to grow at 7.94% CAGR to reach USD 109.18 billion by 2032.

Hi! Click one of our member below to chat on Phone
© 2025 All Rights Reserved by SNS Insider Pvt Ltd


