image

3D Imaging Market Report Scope & Overview:

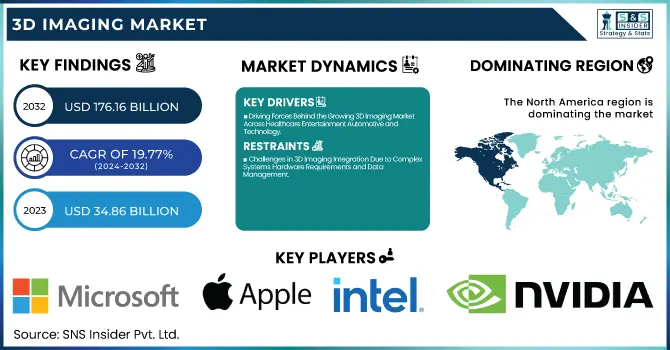
The 3D Imaging Market Size was valued at USD 34.86 Billion in 2023 and is expected to reach USD 176.16 Billion by 2032 and grow at a CAGR of 19.77% over the forecast period 2024-2032. The 3D Imaging Market is changing quickly with rapid development in performance, efficiency, and acceptance. New and improved hardware advances and higher-resolution, higher-frame-rate depth cameras, some with tight depth accuracy tolerances are leading to innovation across verticals. More efficient data processing, lower latency, and faster rendering times are driving overall performance and efficiency improvements. Its application scope broadens due to increasing adoption and integration across healthcare, automotive, and entertainment sectors. Lastly, growth is also driven by niche application-specific innovations such as 3D medical imaging, defect detection of 3D models in manufacturing, and motion tracking for AR/VR experiences. Together, these technological advancements are enhancing the quality of visualization, accuracy of operations, and user experience across industries.

Market Dynamics

Key Drivers: 

  • Driving Forces Behind the Growing 3D Imaging Market Across Healthcare Entertainment Automotive and Technology

The 3D imaging market is being driven by several factors that are pushing the industry ever forward. The growth of the 3D Imaging market is highly impacted by the rise in demand for 3D imaging technology for medical diagnostics, surgical & dental planning, etc. 3D imaging systems such as MRI, CT scans, and ultrasound help to improve the accuracy of treatment procedures. Moreover, increasing demand for 3D content for entertainment, gaming, and virtual reality (VR) applications is contributing to the growth of the market. 3D imaging is also becoming increasingly common in the automotive space, being used in vehicle design, navigation, and safety systems, among others. In addition, technological advancements in sensors, cameras, and imaging software are enhancing the accuracy and affordability of 3D imaging solutions, also supporting the growth of the market.

Restrain:

  • Challenges in 3D Imaging Integration Due to Complex Systems Hardware Requirements and Data Management

The most important reason is the complexity of the 3D imaging system. They may include powerful hardware, such as special cameras, sensors, and high-performance computing devices, that make integration difficult. For businesses, particularly those lacking technical knowledge, achieving seamless integration between these components can prove to be quite difficult. Moreover, the large amount of data produced by 3D imaging systems needs big storage spaces and good data management practices which could be challenging for some organizations.

Opportunity: 

  • Expanding Opportunities in 3D Imaging Across Construction Retail Defense and AI-Driven Innovations

There are huge opportunities in the 3D imaging market with numerous industries such as construction, retail, and defense among others. 3D imaging solutions in construction allow for precise mapping and modeling of structures, making project processes far more effective. The retail industry has also adopted 3D imaging to offer virtual try-ons and 3D visualization to heighten the consumer experience. In addition, Artificial intelligence (AI) is becoming the focal point for 3D, in regards to automation and sophistication of data analysis. The 3D imaging idea industry is anticipated to show a big boom this is due to the enhanced recognition of involved enjoyment especially in fashion designing, video games, and films.

Challenges:

  • Addressing Privacy Security Skilled Workforce and Technical Challenges in the Growing 3D Imaging Market

Possibly another important challenge is the privacy and security of 3D imaging applications. For industries like healthcare and retail using 3D imaging to capture patients for diagnostics or customers for optimization, this data protection is even more critical to protect their regulatory compliance standards. In addition, there is increasing demand for skilled professionals who can effectively operate 3D imaging systems and analyze complex visual information. Access to trained personnel may reduce adoption speed, especially in smaller companies. Moreover, some technical limitations, such as resolution restrictions in certain applications may affect the clarity of images and consequently the use of 3D imaging in areas that require a high level of precision. All of these needs will have to be dealt with if the market is to continue growing.

Segments Analysis

By Offering

The hardware segment dominated the 3D imaging market, accounting for 46.8% of the overall 3D imaging market in 2023. The growth is attributed to the widespread use of sophisticated imaging equipment such as 3D cameras, sensors, and scanners in multiple industries. Hardware components or equipment are vital in capturing high-resolution 3D visuals, particularly in areas such as healthcare, automotive, and entertainment. This value-based growth was supplemented by the increasing demand for 3D imaging hardware for medical diagnostics and industrial inspection.

The software segment is expected to grow at the fastest CAGR running from 2024 to 2032. The increase has been attributed to the growing demand for effective solutions for image processing, visualization, and 3D modeling. Software developments like AI integration and faster & better rendering methods are improving the efficiency & usability of images, which is increasing the application of images across various industries.

By Deployment

In 2023, the on-premise held the largest share of 75.9%. The number one supported market for this dominance comes with industries prime of the few if you want reliability requiring the most for your data security, content command with formatting systems, with secure & constant operation without any internet depth. Industries like healthcare,  manufacturing, and defense process sensitive information, and they rely mostly on on-premise solutions to meet stringent regulatory compliance requirements. Further, organizations with five to ten-year infrastructure investments prefer on-premise deployments where they can easily plug in and out with existing systems.

The cloud segment is projected to grow at the fastest CAGR from 2024 to 2032. Factors such as scalability, cost-effectiveness, and remote accessibility are fueling the demand for cloud-based solutions. As organizations look for flexible and scalable solutions for 3D imaging, cloud platforms are gaining popularity for their ability to facilitate real-time data sharing, advanced analytics, and better collaboration.

By Organization Size

The 3D imaging market was led by large enterprises in 2023, capturing 54.5% of the total share. This led to their dominance due to heavy investments in innovative imaging equipment, strong infrastructural networks, and a workforce. 3D imaging is widely used by large enterprises in healthcare, automotive, media, and others for purposes such as diagnostics, design prototyping, and content creation. The readiness to adapt top-range hardware and software solutions further solidifies its market hold.

The SMEs are anticipated to have the fastest CAGR from 2024 to 2032. Increased availability of affordable 3D imaging solutions and infrastructure cost reduction through cloud-based platforms are the factors driving this growth. The increasing implementation of 3D imagers in marketing, visualization of products, and customer engagement in small and medium-scale enterprises is rapidly boosting their market growth.

By End-use

The healthcare and life sciences segment accounted for the largest share of 51.6% of the 3D imaging market in 2023. The dominance is attributed to the large-scale usage of 3D imaging technologies in medical diagnostics, surgical planning, and research. Innovative imaging technologies including MRI, CT scans, and ultrasound are among the primary drivers of improving diagnostic precision and patient outcomes. The segment held the largest share due to the increasing trend for minimally invasive procedures as well as visualization tools.

Media and entertainment segment is anticipated to have the fastest growth rate (CAGR), between 2024 and 2032. This growth is being driven by high demand for immersive content, especially in the fields of gaming, films, and VR (virtual reality). This segment is expected to expand significantly due to the increasing use of 3D imaging to create better visual effects, animation, and AR experiences.
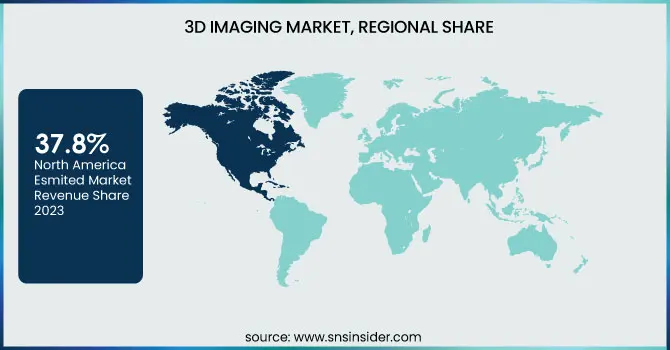
Regional Analysis

In 2023, North America acquired the maximum market share of 37.8% in 3D imaging market. The region dominated the 3D Imaging Market share due to the vast healthcare infrastructure, the presence of key technology players, and rising adoption of 3D imaging solutions in various industries including healthcare, automotive, and media. As an example, medical giants such as GE Healthcare and Siemens Healthineers have considerably embedded 3D imaging in hospitals in the U.S. and Canada, especially in medical diagnostics and surgical planning. Moreover, the entertainment sector in the N. America extensively uses 3D imaging for film and games, and high-grade visual effect production, the major players such as Walt Disney Studios and Pixar are using this technology.

Asia Pacific is anticipated to grow at the fastest CAGR in the forecast period from 2024 to 2032. Driving this growth are rapid technological advancements, investments in healthcare infrastructure, and growing demand for 3D imaging in key application industries such as manufacturing and entertainment. 3D Imaging adoption is further ahead in countries such as China, Japan, and South Korea Similarly, Canon Inc. in Japan provides highly advanced 3D medical imaging devices and organizations like Tencent Games in China are including 3D imaging for better gaming experience therefore, propelling the growth of the market in this region.

Key players

Some of the major players in the 3D Imaging Market are:

  • Microsoft (Azure Kinect DK, HoloLens 2)

  • Apple Inc. (TrueDepth Camera, LiDAR Scanner)

  • Intel Corporation (RealSense Depth Cameras, RealSense LiDAR Camera L515)

  • NVIDIA Corporation (Omniverse, RTX GPUs)

  • Sony Corporation (IMX556PLR Depth Sensor, Xperia PRO-I)

  • Google LLC (ARCore Depth API, Google Pixel 8 Pro)

  • Samsung Electronics (ISOCELL Vizion 33D, Galaxy S23 Ultra)

  • STMicroelectronics (VL53L5CX Time-of-Flight Sensor, FlightSense Sensors)

  • Qualcomm Technologies (Snapdragon XR2 Platform, Spectra ISP)

  • Matterport Inc. (Pro3 Camera, Matterport Axis)

  • Trimble Inc. (X7 3D Laser Scanner, Trimble TX8)

  • Leica Geosystems (BLK360 Imaging Laser Scanner, RTC360)

  • FARO Technologies (Focus Premium Laser Scanner, Freestyle 2)

  • Topcon Corporation (GLS-2200 Scanner, GTL-1200)

  • Zebra Imaging (ZScape Holographic Prints, RealView Holographic Display)

Recent Trends

  • In February 2025, Apple will integrate AI into Vision Pro and Apple Intelligence will enhance Vision Pro's 3D capabilities with features like Genmojis and the Image Playground app.

  • In January 2024, Intel's new USD 3.5 billion facility focuses on advanced semiconductor packaging, including Foveros 3D technology, enhancing its manufacturing capabilities.

3D Imaging Market Report Scope:

Report Attributes Details
Market Size in 2023 USD 34.86 Billion
Market Size by 2032 USD 176.16 Billion
CAGR CAGR of 19.77% From 2024 to 2032
Base Year 2023
Forecast Period 2024-2032
Historical Data 2020-2022
Report Scope & Coverage Market Size, Segments Analysis, Competitive  Landscape, Regional Analysis, DROC & SWOT Analysis, Forecast Outlook
Key Segments • By Offering (Hardware, Software, Services)
• By Deployment (On-premise, Cloud)
• By Organization Size (Large Enterprises, Small and Medium-sized Enterprises (SMEs))
• By End-use (Automotive and Transportation, Manufacturing, Healthcare and Life Sciences, Architecture and Construction, Media and Entertainment, Security & Surveillance, Others)
Regional Analysis/Coverage North America (US, Canada, Mexico), Europe (Eastern Europe [Poland, Romania, Hungary, Turkey, Rest of Eastern Europe] Western Europe] Germany, France, UK, Italy, Spain, Netherlands, Switzerland, Austria, Rest of Western Europe]), Asia Pacific (China, India, Japan, South Korea, Vietnam, Singapore, Australia, Rest of Asia Pacific), Middle East & Africa (Middle East [UAE, Egypt, Saudi Arabia, Qatar, Rest of Middle East], Africa [Nigeria, South Africa, Rest of Africa], Latin America (Brazil, Argentina, Colombia, Rest of Latin America)
Company Profiles Microsoft, Apple Inc., Intel Corporation, NVIDIA Corporation, Sony Corporation, Google LLC, Samsung Electronics, STMicroelectronics, Qualcomm Technologies, Matterport Inc., Trimble Inc., Leica Geosystems, FARO Technologies, Topcon Corporation, Zebra Imaging.

Frequently Asked Questions

Ans:  The 3D Imaging Market is expected to grow at a CAGR of 19.77%.

Ans: 3D Imaging Market size was USD 34.86 billion in 2023 and is expected to Reach USD 176.16 billion by 2032.

Ans: The major key drivers for the growth of the 3D imaging market include rising demand in healthcare diagnostics.

Ans: The Hardware segment dominated the Industrial battery market in 2023.

Ans: In 2023, the North American region led the 3D Imaging market, capturing approximately 37.85% of the total market share.

Table of Contents:

1. Introduction

1.1 Market Definition

1.2 Scope (Inclusion and Exclusions)

1.3 Research Assumptions

2. Executive Summary

2.1 Market Overview

2.2 Regional Synopsis

2.3 Competitive Summary

3. Research Methodology

3.1 Top-Down Approach

3.2 Bottom-up Approach

3.3. Data Validation

3.4 Primary Interviews

4. Market Dynamics Impact Analysis

4.1 Market Driving Factors Analysis

4.1.1 Drivers

4.1.2 Restraints

4.1.3 Opportunities

4.1.4 Challenges

4.2 PESTLE Analysis

4.3 Porter’s Five Forces Model

5. Statistical Insights and Trends Reporting

5.1 Performance and Efficiency

5.2 Adoption and Integration

5.3 Hardware Performance

5.4 Application-Specific

6. Competitive Landscape

6.1 List of Major Companies, By Region

6.2 Market Share Analysis, By Region

6.3 Product Benchmarking

6.3.1 Product specifications and features

6.3.2 Pricing

6.4 Strategic Initiatives

6.4.1 Marketing and promotional activities

6.4.2 Distribution and Supply Chain Strategies

6.4.3 Expansion plans and new product launches

6.4.4 Strategic partnerships and collaborations

6.5 Technological Advancements

6.6 Market Positioning and Branding

7. 3D Imaging Market Segmentation, By Offering

7.1 Chapter Overview

7.2 Hardware

7.2.1 Hardware Market Trends Analysis (2020-2032)

7.2.2 Hardware Market Size Estimates and Forecasts to 2032 (USD Billion)

7.3 Software

7.3.1 Software Market Trends Analysis (2020-2032)

7.3.2 Software Market Size Estimates and Forecasts to 2032 (USD Billion)

7.4 Services

7.4.1 Services Market Trends Analysis (2020-2032)

7.4.2 Services Market Size Estimates and Forecasts to 2032 (USD Billion)

8. 3D Imaging Market Segmentation, By Deployment

8.1 Chapter Overview

8.2 On-premise

8.2.1 On-premise Market Trends Analysis (2020-2032)

8.2.2 On-premise Market Size Estimates and Forecasts to 2032 (USD Billion)

8.3 Cloud

8.3.1 Cloud Market Trends Analysis (2020-2032)

8.3.2 Cloud Market Size Estimates and Forecasts to 2032 (USD Billion)

9. 3D Imaging Market Segmentation, By Organization Size

9.1 Chapter Overview

9.2 Large Enterprises

9.2.1 Large Enterprises Market Trends Analysis (2020-2032)

9.2.2 Large Enterprises Market Size Estimates and Forecasts to 2032 (USD Billion)

9.3 Small and Medium-sized Enterprises (SMEs)

9.3.1 Small and Medium-sized Enterprises (SMEs) Market Trends Analysis (2020-2032)

9.3.2 Small and Medium-sized Enterprises (SMEs) Market Size Estimates and Forecasts to 2032 (USD Billion)

10. 3D Imaging Market Segmentation, By End-use

10.1 Chapter Overview

10.2 Automotive and Transportation

10.2.1 Automotive and Transportation Market Trends Analysis (2020-2032)

10.2.2 Automotive and Transportation Market Size Estimates and Forecasts to 2032 (USD Billion)

10.3 Manufacturing

10.3.1 Manufacturing Market Trends Analysis (2020-2032)

10.3.2 Manufacturing Market Size Estimates and Forecasts to 2032 (USD Billion)

10.4 Healthcare and Life Sciences

10.4.1 Healthcare and Life Sciences Market Trends Analysis (2020-2032)

10.4.2 Healthcare and Life Sciences Market Size Estimates and Forecasts to 2032 (USD Billion)

10.5 Architecture and Construction

10.5.1 Architecture and Construction Market Trends Analysis (2020-2032)

10.5.2 Architecture and Construction Market Size Estimates and Forecasts to 2032 (USD Billion)

10.6 Media and Entertainment

10.6.1 Media and Entertainment Market Trends Analysis (2020-2032)

10.6.2 Media and Entertainment Market Size Estimates and Forecasts to 2032 (USD Billion)

10.7 Security & Surveillance

10.7.1 Security & Surveillance Market Trends Analysis (2020-2032)

10.7.2 Security & Surveillance Market Size Estimates and Forecasts to 2032 (USD Billion)

10.8 Others

10.8.1 Others Market Trends Analysis (2020-2032)

10.8.2 Others Market Size Estimates and Forecasts to 2032 (USD Billion)

11. Regional Analysis

11.1 Chapter Overview

11.2 North America

11.2.1 Trends Analysis

11.2.2 North America 3D Imaging Market Estimates and Forecasts, by Country (2020-2032) (USD Billion)

11.2.3 North America 3D Imaging Market Estimates and Forecasts, By Offering (2020-2032) (USD Billion) 

11.2.4 North America 3D Imaging Market Estimates and Forecasts, By Deployment (2020-2032) (USD Billion)

11.2.5 North America 3D Imaging Market Estimates and Forecasts, By Organization Size (2020-2032) (USD Billion)

11.2.6 North America 3D Imaging Market Estimates and Forecasts, By End-use (2020-2032) (USD Billion)

11.2.7 USA

11.2.7.1 USA 3D Imaging Market Estimates and Forecasts, By Offering (2020-2032) (USD Billion)

11.2.7.2 USA 3D Imaging Market Estimates and Forecasts, By Deployment (2020-2032) (USD Billion)

11.2.7.3 USA 3D Imaging Market Estimates and Forecasts, By Organization Size (2020-2032) (USD Billion)

11.2.7.4 USA 3D Imaging Market Estimates and Forecasts, By End-use (2020-2032) (USD Billion)

11.2.8 Canada

11.2.8.1 Canada 3D Imaging Market Estimates and Forecasts, By Offering (2020-2032) (USD Billion)

11.2.8.2 Canada 3D Imaging Market Estimates and Forecasts, By Deployment (2020-2032) (USD Billion)

11.2.8.3 Canada 3D Imaging Market Estimates and Forecasts, By Organization Size (2020-2032) (USD Billion)

11.2.8.4 Canada 3D Imaging Market Estimates and Forecasts, By End-use (2020-2032) (USD Billion)

11.2.9 Mexico

11.2.9.1 Mexico 3D Imaging Market Estimates and Forecasts, By Offering (2020-2032) (USD Billion)

11.2.9.2 Mexico 3D Imaging Market Estimates and Forecasts, By Deployment (2020-2032) (USD Billion)

11.2.9.3 Mexico 3D Imaging Market Estimates and Forecasts, By Organization Size (2020-2032) (USD Billion)

11.2.9.4 Mexico 3D Imaging Market Estimates and Forecasts, By End-use (2020-2032) (USD Billion)

11.3 Europe

11.3.1 Eastern Europe

11.3.1.1 Trends Analysis

11.3.1.2 Eastern Europe 3D Imaging Market Estimates and Forecasts, by Country (2020-2032) (USD Billion)

11.3.1.3 Eastern Europe 3D Imaging Market Estimates and Forecasts, By Offering (2020-2032) (USD Billion) 

11.3.1.4 Eastern Europe 3D Imaging Market Estimates and Forecasts, By Deployment (2020-2032) (USD Billion)

11.3.1.5 Eastern Europe 3D Imaging Market Estimates and Forecasts, By Organization Size (2020-2032) (USD Billion)

11.3.1.6 Eastern Europe 3D Imaging Market Estimates and Forecasts, By End-use (2020-2032) (USD Billion)

11.3.1.7 Poland

11.3.1.7.1 Poland 3D Imaging Market Estimates and Forecasts, By Offering (2020-2032) (USD Billion)

11.3.1.7.2 Poland 3D Imaging Market Estimates and Forecasts, By Deployment (2020-2032) (USD Billion)

11.3.1.7.3 Poland 3D Imaging Market Estimates and Forecasts, By Organization Size (2020-2032) (USD Billion)

11.3.1.7.4 Poland 3D Imaging Market Estimates and Forecasts, By End-use (2020-2032) (USD Billion)

11.3.1.8 Romania

11.3.1.8.1 Romania 3D Imaging Market Estimates and Forecasts, By Offering (2020-2032) (USD Billion)

11.3.1.8.2 Romania 3D Imaging Market Estimates and Forecasts, By Deployment (2020-2032) (USD Billion)

11.3.1.8.3 Romania 3D Imaging Market Estimates and Forecasts, By Organization Size (2020-2032) (USD Billion)

11.3.1.8.4 Romania 3D Imaging Market Estimates and Forecasts, By End-use (2020-2032) (USD Billion)

11.3.1.9 Hungary

11.3.1.9.1 Hungary 3D Imaging Market Estimates and Forecasts, By Offering (2020-2032) (USD Billion)

11.3.1.9.2 Hungary 3D Imaging Market Estimates and Forecasts, By Deployment (2020-2032) (USD Billion)

11.3.1.9.3 Hungary 3D Imaging Market Estimates and Forecasts, By Organization Size (2020-2032) (USD Billion)

11.3.1.9.4 Hungary 3D Imaging Market Estimates and Forecasts, By End-use (2020-2032) (USD Billion)

11.3.1.10 Turkey

11.3.1.10.1 Turkey 3D Imaging Market Estimates and Forecasts, By Offering (2020-2032) (USD Billion)

11.3.1.10.2 Turkey 3D Imaging Market Estimates and Forecasts, By Deployment (2020-2032) (USD Billion)

11.3.1.10.3 Turkey 3D Imaging Market Estimates and Forecasts, By Organization Size (2020-2032) (USD Billion)

11.3.1.10.4 Turkey 3D Imaging Market Estimates and Forecasts, By End-use (2020-2032) (USD Billion)

11.3.1.11 Rest of Eastern Europe

11.3.1.11.1 Rest of Eastern Europe 3D Imaging Market Estimates and Forecasts, By Offering (2020-2032) (USD Billion)

11.3.1.11.2 Rest of Eastern Europe 3D Imaging Market Estimates and Forecasts, By Deployment (2020-2032) (USD Billion)

11.3.1.11.3 Rest of Eastern Europe 3D Imaging Market Estimates and Forecasts, By Organization Size (2020-2032) (USD Billion)

11.3.1.11.4 Rest of Eastern Europe 3D Imaging Market Estimates and Forecasts, By End-use (2020-2032) (USD Billion)

11.3.2 Western Europe

11.3.2.1 Trends Analysis

11.3.2.2 Western Europe 3D Imaging Market Estimates and Forecasts, by Country (2020-2032) (USD Billion)

11.3.2.3 Western Europe 3D Imaging Market Estimates and Forecasts, By Offering (2020-2032) (USD Billion) 

11.3.2.4 Western Europe 3D Imaging Market Estimates and Forecasts, By Deployment (2020-2032) (USD Billion)

11.3.2.5 Western Europe 3D Imaging Market Estimates and Forecasts, By Organization Size (2020-2032) (USD Billion)

11.3.2.6 Western Europe 3D Imaging Market Estimates and Forecasts, By End-use (2020-2032) (USD Billion)

11.3.2.7 Germany

11.3.2.7.1 Germany 3D Imaging Market Estimates and Forecasts, By Offering (2020-2032) (USD Billion)

11.3.2.7.2 Germany 3D Imaging Market Estimates and Forecasts, By Deployment (2020-2032) (USD Billion)

11.3.2.7.3 Germany 3D Imaging Market Estimates and Forecasts, By Organization Size (2020-2032) (USD Billion)

11.3.2.7.4 Germany 3D Imaging Market Estimates and Forecasts, By End-use (2020-2032) (USD Billion)

11.3.2.8 France

11.3.2.8.1 France 3D Imaging Market Estimates and Forecasts, By Offering (2020-2032) (USD Billion)

11.3.2.8.2 France 3D Imaging Market Estimates and Forecasts, By Deployment (2020-2032) (USD Billion)

11.3.2.8.3 France 3D Imaging Market Estimates and Forecasts, By Organization Size (2020-2032) (USD Billion)

11.3.2.8.4 France 3D Imaging Market Estimates and Forecasts, By End-use (2020-2032) (USD Billion)

11.3.2.9 UK

11.3.2.9.1 UK 3D Imaging Market Estimates and Forecasts, By Offering (2020-2032) (USD Billion)

11.3.2.9.2 UK 3D Imaging Market Estimates and Forecasts, By Deployment (2020-2032) (USD Billion)

11.3.2.9.3 UK 3D Imaging Market Estimates and Forecasts, By Organization Size (2020-2032) (USD Billion)

11.3.2.9.4 UK 3D Imaging Market Estimates and Forecasts, By End-use (2020-2032) (USD Billion)

11.3.2.10 Italy

11.3.2.10.1 Italy 3D Imaging Market Estimates and Forecasts, By Offering (2020-2032) (USD Billion)

11.3.2.10.2 Italy 3D Imaging Market Estimates and Forecasts, By Deployment (2020-2032) (USD Billion)

11.3.2.10.3 Italy 3D Imaging Market Estimates and Forecasts, By Organization Size (2020-2032) (USD Billion)

11.3.2.10.4 Italy 3D Imaging Market Estimates and Forecasts, By End-use (2020-2032) (USD Billion)

11.3.2.11 Spain

11.3.2.11.1 Spain 3D Imaging Market Estimates and Forecasts, By Offering (2020-2032) (USD Billion)

11.3.2.11.2 Spain 3D Imaging Market Estimates and Forecasts, By Deployment (2020-2032) (USD Billion)

11.3.2.11.3 Spain 3D Imaging Market Estimates and Forecasts, By Organization Size (2020-2032) (USD Billion)

11.3.2.11.4 Spain 3D Imaging Market Estimates and Forecasts, By End-use (2020-2032) (USD Billion)

11.3.2.12 Netherlands

11.3.2.12.1 Netherlands 3D Imaging Market Estimates and Forecasts, By Offering (2020-2032) (USD Billion)

11.3.2.12.2 Netherlands 3D Imaging Market Estimates and Forecasts, By Deployment (2020-2032) (USD Billion)

11.3.2.12.3 Netherlands 3D Imaging Market Estimates and Forecasts, By Organization Size (2020-2032) (USD Billion)

11.3.2.12.4 Netherlands 3D Imaging Market Estimates and Forecasts, By End-use (2020-2032) (USD Billion)

11.3.2.13 Switzerland

11.3.2.13.1 Switzerland 3D Imaging Market Estimates and Forecasts, By Offering (2020-2032) (USD Billion)

11.3.2.13.2 Switzerland 3D Imaging Market Estimates and Forecasts, By Deployment (2020-2032) (USD Billion)

11.3.2.13.3 Switzerland 3D Imaging Market Estimates and Forecasts, By Organization Size (2020-2032) (USD Billion)

11.3.2.13.4 Switzerland 3D Imaging Market Estimates and Forecasts, By End-use (2020-2032) (USD Billion)

11.3.2.14 Austria

11.3.2.14.1 Austria 3D Imaging Market Estimates and Forecasts, By Offering (2020-2032) (USD Billion)

11.3.2.14.2 Austria 3D Imaging Market Estimates and Forecasts, By Deployment (2020-2032) (USD Billion)

11.3.2.14.3 Austria 3D Imaging Market Estimates and Forecasts, By Organization Size (2020-2032) (USD Billion)

11.3.2.14.4 Austria 3D Imaging Market Estimates and Forecasts, By End-use (2020-2032) (USD Billion)

11.3.2.15 Rest of Western Europe

11.3.2.15.1 Rest of Western Europe 3D Imaging Market Estimates and Forecasts, By Offering (2020-2032) (USD Billion)

11.3.2.15.2 Rest of Western Europe 3D Imaging Market Estimates and Forecasts, By Deployment (2020-2032) (USD Billion)

11.3.2.15.3 Rest of Western Europe 3D Imaging Market Estimates and Forecasts, By Organization Size (2020-2032) (USD Billion)

11.3.2.15.4 Rest of Western Europe 3D Imaging Market Estimates and Forecasts, By End-use (2020-2032) (USD Billion)

11.4 Asia-Pacific

11.4.1 Trends Analysis

11.4.2 Asia-Pacific 3D Imaging Market Estimates and Forecasts, by Country (2020-2032) (USD Billion)

11.4.3 Asia-Pacific 3D Imaging Market Estimates and Forecasts, By Offering (2020-2032) (USD Billion) 

11.4.4 Asia-Pacific 3D Imaging Market Estimates and Forecasts, By Deployment (2020-2032) (USD Billion)

11.4.5 Asia-Pacific 3D Imaging Market Estimates and Forecasts, By Organization Size (2020-2032) (USD Billion)

11.4.6 Asia-Pacific 3D Imaging Market Estimates and Forecasts, By End-use (2020-2032) (USD Billion)

11.4.7 China

11.4.7.1 China 3D Imaging Market Estimates and Forecasts, By Offering (2020-2032) (USD Billion)

11.4.7.2 China 3D Imaging Market Estimates and Forecasts, By Deployment (2020-2032) (USD Billion)

11.4.7.3 China 3D Imaging Market Estimates and Forecasts, By Organization Size (2020-2032) (USD Billion)

11.4.7.4 China 3D Imaging Market Estimates and Forecasts, By End-use (2020-2032) (USD Billion)

11.4.8 India

11.4.8.1 India 3D Imaging Market Estimates and Forecasts, By Offering (2020-2032) (USD Billion)

11.4.8.2 India 3D Imaging Market Estimates and Forecasts, By Deployment (2020-2032) (USD Billion)

11.4.8.3 India 3D Imaging Market Estimates and Forecasts, By Organization Size (2020-2032) (USD Billion)

11.4.8.4 India 3D Imaging Market Estimates and Forecasts, By End-use (2020-2032) (USD Billion)

11.4.9 Japan

11.4.9.1 Japan 3D Imaging Market Estimates and Forecasts, By Offering (2020-2032) (USD Billion)

11.4.9.2 Japan 3D Imaging Market Estimates and Forecasts, By Deployment (2020-2032) (USD Billion)

11.4.9.3 Japan 3D Imaging Market Estimates and Forecasts, By Organization Size (2020-2032) (USD Billion)

11.4.9.4 Japan 3D Imaging Market Estimates and Forecasts, By End-use (2020-2032) (USD Billion)

11.4.10 South Korea

11.4.10.1 South Korea 3D Imaging Market Estimates and Forecasts, By Offering (2020-2032) (USD Billion)

11.4.10.2 South Korea 3D Imaging Market Estimates and Forecasts, By Deployment (2020-2032) (USD Billion)

11.4.10.3 South Korea 3D Imaging Market Estimates and Forecasts, By Organization Size (2020-2032) (USD Billion)

11.4.10.4 South Korea 3D Imaging Market Estimates and Forecasts, By End-use (2020-2032) (USD Billion)

11.4.11 Vietnam

11.4.11.1 Vietnam 3D Imaging Market Estimates and Forecasts, By Offering (2020-2032) (USD Billion)

11.4.11.2 Vietnam 3D Imaging Market Estimates and Forecasts, By Deployment (2020-2032) (USD Billion)

11.4.11.3 Vietnam 3D Imaging Market Estimates and Forecasts, By Organization Size (2020-2032) (USD Billion)

11.4.11.4 Vietnam 3D Imaging Market Estimates and Forecasts, By End-use (2020-2032) (USD Billion)

11.4.12 Singapore

11.4.12.1 Singapore 3D Imaging Market Estimates and Forecasts, By Offering (2020-2032) (USD Billion)

11.4.12.2 Singapore 3D Imaging Market Estimates and Forecasts, By Deployment (2020-2032) (USD Billion)

11.4.12.3 Singapore 3D Imaging Market Estimates and Forecasts, By Organization Size (2020-2032) (USD Billion)

11.4.12.4 Singapore 3D Imaging Market Estimates and Forecasts, By End-use (2020-2032) (USD Billion)

11.4.13 Australia

11.4.13.1 Australia 3D Imaging Market Estimates and Forecasts, By Offering (2020-2032) (USD Billion)

11.4.13.2 Australia 3D Imaging Market Estimates and Forecasts, By Deployment (2020-2032) (USD Billion)

11.4.13.3 Australia 3D Imaging Market Estimates and Forecasts, By Organization Size (2020-2032) (USD Billion)

11.4.13.4 Australia 3D Imaging Market Estimates and Forecasts, By End-use (2020-2032) (USD Billion)

11.4.14 Rest of Asia-Pacific

11.4.14.1 Rest of Asia-Pacific 3D Imaging Market Estimates and Forecasts, By Offering (2020-2032) (USD Billion)

11.4.14.2 Rest of Asia-Pacific 3D Imaging Market Estimates and Forecasts, By Deployment (2020-2032) (USD Billion)

11.4.14.3 Rest of Asia-Pacific 3D Imaging Market Estimates and Forecasts, By Organization Size (2020-2032) (USD Billion)

11.4.14.4 Rest of Asia-Pacific 3D Imaging Market Estimates and Forecasts, By End-use (2020-2032) (USD Billion)

11.5 Middle East and Africa

11.5.1 Middle East

11.5.1.1 Trends Analysis

11.5.1.2 Middle East 3D Imaging Market Estimates and Forecasts, by Country (2020-2032) (USD Billion)

11.5.1.3 Middle East 3D Imaging Market Estimates and Forecasts, By Offering (2020-2032) (USD Billion) 

11.5.1.4 Middle East 3D Imaging Market Estimates and Forecasts, By Deployment (2020-2032) (USD Billion)

11.5.1.5 Middle East 3D Imaging Market Estimates and Forecasts, By Organization Size (2020-2032) (USD Billion)

11.5.1.6 Middle East 3D Imaging Market Estimates and Forecasts, By End-use (2020-2032) (USD Billion)

11.5.1.7 UAE

11.5.1.7.1 UAE 3D Imaging Market Estimates and Forecasts, By Offering (2020-2032) (USD Billion)

11.5.1.7.2 UAE 3D Imaging Market Estimates and Forecasts, By Deployment (2020-2032) (USD Billion)

11.5.1.7.3 UAE 3D Imaging Market Estimates and Forecasts, By Organization Size (2020-2032) (USD Billion)

11.5.1.7.4 UAE 3D Imaging Market Estimates and Forecasts, By End-use (2020-2032) (USD Billion)

11.5.1.8 Egypt

11.5.1.8.1 Egypt 3D Imaging Market Estimates and Forecasts, By Offering (2020-2032) (USD Billion)

11.5.1.8.2 Egypt 3D Imaging Market Estimates and Forecasts, By Deployment (2020-2032) (USD Billion)

11.5.1.8.3 Egypt 3D Imaging Market Estimates and Forecasts, By Organization Size (2020-2032) (USD Billion)

11.5.1.8.4 Egypt 3D Imaging Market Estimates and Forecasts, By End-use (2020-2032) (USD Billion)

11.5.1.9 Saudi Arabia

11.5.1.9.1 Saudi Arabia 3D Imaging Market Estimates and Forecasts, By Offering (2020-2032) (USD Billion)

11.5.1.9.2 Saudi Arabia 3D Imaging Market Estimates and Forecasts, By Deployment (2020-2032) (USD Billion)

11.5.1.9.3 Saudi Arabia 3D Imaging Market Estimates and Forecasts, By Organization Size (2020-2032) (USD Billion)

11.5.1.9.4 Saudi Arabia 3D Imaging Market Estimates and Forecasts, By End-use (2020-2032) (USD Billion)

11.5.1.10 Qatar

11.5.1.10.1 Qatar 3D Imaging Market Estimates and Forecasts, By Offering (2020-2032) (USD Billion)

11.5.1.10.2 Qatar 3D Imaging Market Estimates and Forecasts, By Deployment (2020-2032) (USD Billion)

11.5.1.10.3 Qatar 3D Imaging Market Estimates and Forecasts, By Organization Size (2020-2032) (USD Billion)

11.5.1.10.4 Qatar 3D Imaging Market Estimates and Forecasts, By End-use (2020-2032) (USD Billion)

11.5.1.11 Rest of Middle East

11.5.1.11.1 Rest of Middle East 3D Imaging Market Estimates and Forecasts, By Offering (2020-2032) (USD Billion)

11.5.1.11.2 Rest of Middle East 3D Imaging Market Estimates and Forecasts, By Deployment (2020-2032) (USD Billion)

11.5.1.11.3 Rest of Middle East 3D Imaging Market Estimates and Forecasts, By Organization Size (2020-2032) (USD Billion)

11.5.1.11.4 Rest of Middle East 3D Imaging Market Estimates and Forecasts, By End-use (2020-2032) (USD Billion)

11.5.2 Africa

11.5.2.1 Trends Analysis

11.5.2.2 Africa 3D Imaging Market Estimates and Forecasts, by Country (2020-2032) (USD Billion)

11.5.2.3 Africa 3D Imaging Market Estimates and Forecasts, By Offering (2020-2032) (USD Billion) 

11.5.2.4 Africa 3D Imaging Market Estimates and Forecasts, By Deployment (2020-2032) (USD Billion)

11.5.2.5 Africa 3D Imaging Market Estimates and Forecasts, By Organization Size (2020-2032) (USD Billion)

11.5.2.6 Africa 3D Imaging Market Estimates and Forecasts, By End-use (2020-2032) (USD Billion)

11.5.2.7 South Africa

11.5.2.7.1 South Africa 3D Imaging Market Estimates and Forecasts, By Offering (2020-2032) (USD Billion)

11.5.2.7.2 South Africa 3D Imaging Market Estimates and Forecasts, By Deployment (2020-2032) (USD Billion)

11.5.2.7.3 South Africa 3D Imaging Market Estimates and Forecasts, By Organization Size (2020-2032) (USD Billion)

11.5.2.7.4 South Africa 3D Imaging Market Estimates and Forecasts, By End-use (2020-2032) (USD Billion)

11.5.2.8 Nigeria

11.5.2.8.1 Nigeria 3D Imaging Market Estimates and Forecasts, By Offering (2020-2032) (USD Billion)

11.5.2.8.2 Nigeria 3D Imaging Market Estimates and Forecasts, By Deployment (2020-2032) (USD Billion)

11.5.2.8.3 Nigeria 3D Imaging Market Estimates and Forecasts, By Organization Size (2020-2032) (USD Billion)

11.5.2.8.4 Nigeria 3D Imaging Market Estimates and Forecasts, By End-use (2020-2032) (USD Billion)

11.5.2.9 Rest of Africa

11.5.2.9.1 Rest of Africa 3D Imaging Market Estimates and Forecasts, By Offering (2020-2032) (USD Billion)

11.5.2.9.2 Rest of Africa 3D Imaging Market Estimates and Forecasts, By Deployment (2020-2032) (USD Billion)

11.5.2.9.3 Rest of Africa 3D Imaging Market Estimates and Forecasts, By Organization Size (2020-2032) (USD Billion)

11.5.2.9.4 Rest of Africa 3D Imaging Market Estimates and Forecasts, By End-use (2020-2032) (USD Billion)

11.6 Latin America

11.6.1 Trends Analysis

11.6.2 Latin America 3D Imaging Market Estimates and Forecasts, by Country (2020-2032) (USD Billion)

11.6.3 Latin America 3D Imaging Market Estimates and Forecasts, By Offering (2020-2032) (USD Billion) 

11.6.4 Latin America 3D Imaging Market Estimates and Forecasts, By Deployment (2020-2032) (USD Billion)

11.6.5 Latin America 3D Imaging Market Estimates and Forecasts, By Organization Size (2020-2032) (USD Billion)

11.6.6 Latin America 3D Imaging Market Estimates and Forecasts, By End-use (2020-2032) (USD Billion)

11.6.7 Brazil

11.6.7.1 Brazil 3D Imaging Market Estimates and Forecasts, By Offering (2020-2032) (USD Billion)

11.6.7.2 Brazil 3D Imaging Market Estimates and Forecasts, By Deployment (2020-2032) (USD Billion)

11.6.7.3 Brazil 3D Imaging Market Estimates and Forecasts, By Organization Size (2020-2032) (USD Billion)

11.6.7.4 Brazil 3D Imaging Market Estimates and Forecasts, By End-use (2020-2032) (USD Billion)

11.6.8 Argentina

11.6.8.1 Argentina 3D Imaging Market Estimates and Forecasts, By Offering (2020-2032) (USD Billion)

11.6.8.2 Argentina 3D Imaging Market Estimates and Forecasts, By Deployment (2020-2032) (USD Billion)

11.6.8.3 Argentina 3D Imaging Market Estimates and Forecasts, By Organization Size (2020-2032) (USD Billion)

11.6.8.4 Argentina 3D Imaging Market Estimates and Forecasts, By End-use (2020-2032) (USD Billion)

11.6.9 Colombia

11.6.9.1 Colombia 3D Imaging Market Estimates and Forecasts, By Offering (2020-2032) (USD Billion)

11.6.9.2 Colombia 3D Imaging Market Estimates and Forecasts, By Deployment (2020-2032) (USD Billion)

11.6.9.3 Colombia 3D Imaging Market Estimates and Forecasts, By Organization Size (2020-2032) (USD Billion)

11.6.9.4 Colombia 3D Imaging Market Estimates and Forecasts, By End-use (2020-2032) (USD Billion)

11.6.10 Rest of Latin America

11.6.10.1 Rest of Latin America 3D Imaging Market Estimates and Forecasts, By Offering (2020-2032) (USD Billion)

11.6.10.2 Rest of Latin America 3D Imaging Market Estimates and Forecasts, By Deployment (2020-2032) (USD Billion)

11.6.10.3 Rest of Latin America 3D Imaging Market Estimates and Forecasts, By Organization Size (2020-2032) (USD Billion)

11.6.10.4 Rest of Latin America 3D Imaging Market Estimates and Forecasts, By End-use (2020-2032) (USD Billion)

12. Company Profiles

12.1 Microsoft

12.1.1 Company Overview

12.1.2 Financial

12.1.3 Products/ Services Offered

12.1.4 SWOT Analysis

12.2 Apple Inc.

12.2.1 Company Overview

12.2.2 Financial

12.2.3 Products/ Services Offered

12.2.4 SWOT Analysis

12.3 Intel Corporation

12.3.1 Company Overview

12.3.2 Financial

12.3.3 Products/ Services Offered

12.3.4 SWOT Analysis

12.4 NVIDIA Corporation

12.4.1 Company Overview

12.4.2 Financial

12.4.3 Products/ Services Offered

12.4.4 SWOT Analysis

12.5 Sony Corporation

12.5.1 Company Overview

12.5.2 Financial

12.5.3 Products/ Services Offered

12.5.4 SWOT Analysis

12.6 Google LLC

12.6.1 Company Overview

12.6.2 Financial

12.6.3 Products/ Services Offered

12.6.4 SWOT Analysis

12.7 Samsung Electronics

12.7.1 Company Overview

12.7.2 Financial

12.7.3 Products/ Services Offered

12.7.4 SWOT Analysis

12.8 STMicroelectronics

12.8.1 Company Overview

12.8.2 Financial

12.8.3 Products/ Services Offered

12.8.4 SWOT Analysis

12.9 Qualcomm Technologies

12.9.1 Company Overview

12.9.2 Financial

12.9.3 Products/ Services Offered

12.9.4 SWOT Analysis

12.10 Matterport Inc

12.10.1 Company Overview

12.10.2 Financial

12.10.3 Products/ Services Offered

12.10.4 SWOT Analysis

13. Use Cases and Best Practices

14. Conclusion

An accurate research report requires proper strategizing as well as implementation. There are multiple factors involved in the completion of good and accurate research report and selecting the best methodology to compete the research is the toughest part. Since the research reports we provide play a crucial role in any company’s decision-making process, therefore we at SNS Insider always believe that we should choose the best method which gives us results closer to reality. This allows us to reach at a stage wherein we can provide our clients best and accurate investment to output ratio.

Each report that we prepare takes a timeframe of 350-400 business hours for production. Starting from the selection of titles through a couple of in-depth brain storming session to the final QC process before uploading our titles on our website we dedicate around 350 working hours. The titles are selected based on their current market cap and the foreseen CAGR and growth.


The 5 steps process:

Step 1: Secondary Research:

Secondary Research or Desk Research is as the name suggests is a research process wherein, we collect data through the readily available information. In this process we use various paid and unpaid databases which our team has access to and gather data through the same. This includes examining of listed companies’ annual reports, Journals, SEC filling etc. Apart from this our team has access to various associations across the globe across different industries. Lastly, we have exchange relationships with various university as well as individual libraries.

Secondary Research

Step 2: Primary Research

When we talk about primary research, it is a type of study in which the researchers collect relevant data samples directly, rather than relying on previously collected data.  This type of research is focused on gaining content specific facts that can be sued to solve specific problems. Since the collected data is fresh and first hand therefore it makes the study more accurate and genuine.

We at SNS Insider have divided Primary Research into 2 parts.

Part 1 wherein we interview the KOLs of major players as well as the upcoming ones across various geographic regions. This allows us to have their view over the market scenario and acts as an important tool to come closer to the accurate market numbers. As many as 45 paid and unpaid primary interviews are taken from both the demand and supply side of the industry to make sure we land at an accurate judgement and analysis of the market.

This step involves the triangulation of data wherein our team analyses the interview transcripts, online survey responses and observation of on filed participants. The below mentioned chart should give a better understanding of the part 1 of the primary interview.

Primary Research

Part 2: In this part of primary research the data collected via secondary research and the part 1 of the primary research is validated with the interviews from individual consultants and subject matter experts.

Consultants are those set of people who have at least 12 years of experience and expertise within the industry whereas Subject Matter Experts are those with at least 15 years of experience behind their back within the same space. The data with the help of two main processes i.e., FGDs (Focused Group Discussions) and IDs (Individual Discussions). This gives us a 3rd party nonbiased primary view of the market scenario making it a more dependable one while collation of the data pointers.

Step 3: Data Bank Validation

Once all the information is collected via primary and secondary sources, we run that information for data validation. At our intelligence centre our research heads track a lot of information related to the market which includes the quarterly reports, the daily stock prices, and other relevant information. Our data bank server gets updated every fortnight and that is how the information which we collected using our primary and secondary information is revalidated in real time.

Data Bank Validation

Step 4: QA/QC Process

After all the data collection and validation our team does a final level of quality check and quality assurance to get rid of any unwanted or undesired mistakes. This might include but not limited to getting rid of the any typos, duplication of numbers or missing of any important information. The people involved in this process include technical content writers, research heads and graphics people. Once this process is completed the title gets uploader on our platform for our clients to read it.

Step 5: Final QC/QA Process:

This is the last process and comes when the client has ordered the study. In this process a final QA/QC is done before the study is emailed to the client. Since we believe in giving our clients a good experience of our research studies, therefore, to make sure that we do not lack at our end in any way humanly possible we do a final round of quality check and then dispatch the study to the client.

Key Segments:

By Offering

  • Hardware

  • Software

  • Services

By Deployment

  • On-premise

  • Cloud

By Organization Size

  • Large Enterprises

  • Small and Medium-sized Enterprises (SMEs)

By End-use

  • Automotive and Transportation

  • Manufacturing

  • Healthcare and Life Sciences

  • Architecture and Construction

  • Media and Entertainment

  • Security & Surveillance

  • Others

Request for Segment Customization as per your Business Requirement: Segment Customization Request

Regional Coverage:

North America

  • US

  • Canada

  • Mexico

Europe

  • Eastern Europe

    • Poland

    • Romania

    • Hungary

    • Turkey

    • Rest of Eastern Europe

  • Western Europe

    • Germany

    • France

    • UK

    • Italy

    • Spain

    • Netherlands

    • Switzerland

    • Austria

    • Rest of Western Europe

Asia Pacific

  • China

  • India

  • Japan

  • South Korea

  • Vietnam

  • Singapore

  • Australia

  • Rest of Asia Pacific

Middle East & Africa

  • Middle East

    • UAE

    • Egypt

    • Saudi Arabia

    • Qatar

    • Rest of Middle East

  • Africa

    • Nigeria

    • South Africa

    • Rest of Africa

Latin America

  • Brazil

  • Argentina

  • Colombia

  • Rest of Latin America

Request for Country Level Research Report: Country Level Customization Request

Available Customization

With the given market data, SNS Insider offers customization as per the company’s specific needs. The following customization options are available for the report:

  • Detailed Volume Analysis

  • Criss-Cross segment analysis (e.g. Product X Application)

  • Competitive Product Benchmarking

  • Geographic Analysis

  • Additional countries in any of the regions

  • Customized Data Representation

  • Detailed analysis and profiling of additional market players


  •            5000 (33% Discount)


  •            8950 (40% Discount)


  •            3050 (23% Discount)

Start a Conversation

Hi! Click one of our member below to chat on Phone