Get E-PDF Sample Report on 3D Display Market - Request Sample Report
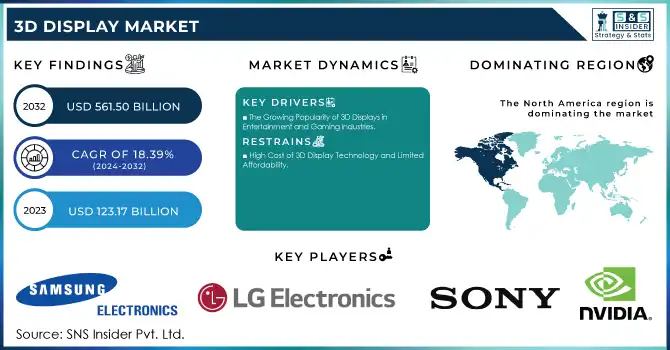
The 3D Display Market Size was valued at USD 123.17 Billion in 2023 and is expected to reach USD 561.50 Billion by 2032 and grow at a CAGR of 18.39% over the forecast period 2024-2032.
The 3D Display Market in the years 2023 and 2024 is still continuing to grow rapidly, through the advancement of technology and the increasing needs for immersive visual experiences in entertainment, healthcare, automotive, retail, and many more sectors. The countries that contribute the most are the United States, China, South Korea, and Japan. Government-backed initiatives and private investments are driving developments in 3D display technologies, which have become integral to applications such as virtual reality, augmented reality, and medical imaging. For example, the U.S. Department of Energy in 2023 funded research to improve energy-efficient display technologies, while Japan's METI launched subsidies for companies developing innovative 3D display systems.
Advances in the technology field also catch much attention and include improved glasses-free 3D display systems, holographic technologies, and OLED-based 3D displays. Samsung exhibits OLED monitors for 3D gaming without glasses or headset. The 3D monitors with an OLED panel enable stereoscopic display in 4K resolution without any aids. In 2023, firms such as LG, Sony, and Samsung were launching highly advanced products consisting of stereoscopic displays tailored for gaming and head-mounted displays designed particularly for AR and VR environments. Companies in South Korea have gained a large increase in manufacturing 3D OLED panels, which is a crucial piece in high-end consumer devices. China also invested in its 3D visualization technologies both for industrial and health care applications showing its interest in leadership in the marketplace.
The future of the 3D display market is vast, especially when it comes to expanding applications such as automotive HUDs, advanced medical imaging systems, and business virtual collaboration platforms. A 2023 report by the European Commission revealed that industries applying 3D visualization began to gain efficiency and accuracy in their processes. Another new growth avenue for the market will be the increasing integration of AI with 3D displays to produce adaptive, real-time content.
Key Drivers:
The Growing Popularity of 3D Displays in Entertainment and Gaming Industries.
The highest demand driver for 3D displays is the increased adoption in entertainment and gaming. Since 58% of gaming enthusiasts across the globe are interested in experiencing 3D, big industry players are releasing 3D-compatible monitors and AR/VR headsets to address consumer demand. The immersive nature of 3D visuals maximizes user engagement, and entertainment companies use 3D displays for movies, live events, and streaming applications.
Moreover, the Japanese and South Korean governments have made initiatives towards promoting innovation in gaming technology. These initiatives have increased the adoption of 3D displays by several folds. For example, in 2023, South Korea has registered an increase of 21% in the usage of AR/VR devices. The segment is highly dependent on 3D display technology. This is indicative of the industry's shift towards creating interactive and hyper-realistic experiences. This is why 3D displays are a necessary component of the digital entertainment ecosystem.
Increasing Demand for 3D Displays in Healthcare Applications
3D displays have completely transformed medical imaging and surgical procedures in healthcare. The U.S. National Institutes of Health suggests that 3D imaging provides a 32% more accurate diagnosis than the conventional 2D imaging techniques. In 2023, the adoption of 3D displays for healthcare applications like robotic surgeries, radiology, and patient education was widely used by global healthcare systems. Such demand is further encouraged by government-backed projects such as the Horizon 2020 initiative sponsored by the EU, which encourages advanced visualization tools in healthcare.
The provision of depth perception and anatomical visualization via a 3D display strongly reinforces clinical outcomes. For instance, Chinese hospitals, in 2024, recorded a surge of 17% from successes in surgeries with the employment of 3D visual presentation devices. It shows how patient care and surgery precision can transform their careers when in charge.
Restrain:
High Cost of 3D Display Technology and Limited Affordability
The significant market restraint is the very high cost of 3D display technology, which has not improved despite recent advancements. The processes for developing and manufacturing 3D displays involve expensive components such as high-resolution panels and advanced projection systems that make these products inaccessible to small businesses and consumers in emerging economies. For example, according to the 2023 report by the Indian Ministry of Electronics and IT, the adoption of 3D display technology in India is still limited, citing the challenge of affordability.
The cost of supporting hardware, such as AR/VR headsets or specialized monitors, is also added to the overall cost. Although governments in developed nations provide subsidies and incentives to encourage technology adoption, this support is often missing in developing countries. This issue requires significant investment in R&D to reduce production costs and make the technology more accessible globally, thus allowing for broader market penetration.
By Product
The Stereoscopic Display segment was the market leader in 2023, with 63% of market share, driven by its wide application in gaming, entertainment, and advertising. The stereoscopic display uses glasses-based or glasses-free technology to provide immersive visuals, which makes it very popular among consumers.
The projected growth of head-mounted displays will be the fastest when they reach a CAGR of 19.32% for the estimated period from 2024 to 2032. Growth factors include enhanced adoption in virtual reality applications as well as augmented reality and in gaming and simulations related to training.
By Technology
In 2023, LED took the lead in the market, with a market share of 29.67% due to its energy efficiency and widespread use across all industries. LEDs provide brightness and color accuracy, making them suitable for outdoor advertising and consumer electronics applications.
Organic LED (OLED) displays are expected to grow with the fastest CAGR of 5.59% during the forecasting period from 2024 to 2032, through their flexibility, superior contrast ratios, and lightweight design. OLEDs are increasingly getting used in smartphones, wearables, and next-generation TVs, with the impetus coming from investments in research and development by manufacturers based in Japan and South Korea.
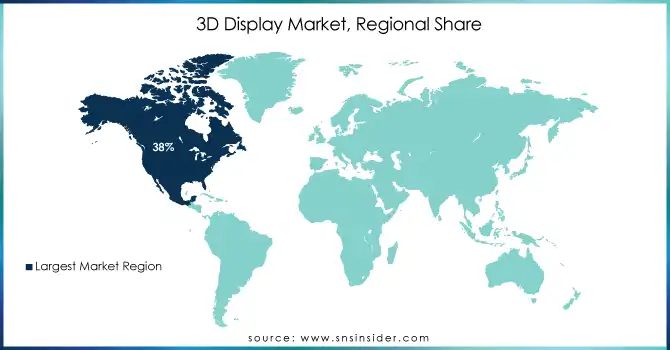
North America dominated 3D Display Market in 2023 with 38% of market share. Early adoption of advanced technology along with robust investments in R&D is the reason for such dominance. The U.S., in particular, leads the world in AR/VR application development and medical imaging technology powered by 3D displays.
Asia Pacific, on the other hand, is expected to expand with a CAGR of 19.14% over the forecast period from 2024 to 2032, driven by growing demand in countries like China, Japan, and India, supported by government initiatives and private investment in adopting technology. This can be seen in the examples: The "Make in India" program promotes local production of electronic components, for example, displays, whereas the emphasis on digital innovation by China accelerates further regional market expansion.
Get Customized Report as Per Your Business Requirement - Request For Customized Report
Key Players
Some of the major players in the 3D Display Market are
Samsung Electronics (3D TVs, OLED displays)
LG Electronics (3D OLED TVs, gaming monitors)
Sony Corporation (3D cameras, stereoscopic displays)
Panasonic Corporation (3D projectors, LED displays)
Barco NV (3D video walls, cinema projectors)
AU Optronics (3D LCD panels, touch displays)
Toshiba Corporation (3D laptops, 4K displays)
EON Reality (3D virtual reality solutions, simulation systems)
Koninklijke Philips (3D medical imaging displays, signage displays)
SHARP Corporation (3D mobile displays, LED-backlit panels)
Hisense (3D smart TVs, laser TVs)
nVIDIA Corporation (3D graphics processing units, stereoscopic 3D solutions)
Fujitsu Limited (3D imaging solutions, holographic displays)
Planar Systems (3D video walls, digital signage)
Looking Glass Factory (holographic displays, 3D light-field displays)
Zebra Imaging (holographic projection systems, 3D mapping)
3DFusion (glasses-free 3D displays, volumetric displays)
RealView Imaging (medical holography, 3D surgical displays)
Dimenco (autostereoscopic displays, 3D visualization tools)
Vizio Inc. (3D smart TVs, UHD displays)
Major Suppliers (Components, Technologies)
Corning Incorporated (glass substrates, optical components)
3M Company (optical films, adhesive solutions)
Dow Inc. (encapsulation materials, adhesives)
Merck KGaA (liquid crystal materials, organic electronics)
Nitto Denko Corporation (polarizer films, optical filters)
Asahi Glass Co., Ltd. (glass substrates, optical coatings)
Shin-Etsu Chemical (silicon wafers, optical materials)
Sumitomo Chemical (OLED materials, polymer films)
Universal Display Corporation (OLED emitters, host materials)
Nichia Corporation (LED components, phosphors)
Major Clients
Netflix
Walt Disney Studios
Tencent Games
Samsung Electronics (B2B for components)
Tesla Inc.
Medtronic
Sony Interactive Entertainment
Microsoft (Xbox division)
Boeing
Intel Corporation
Recent Trends
December 2024: At Gamescom 2024 in Cologne, Germany, Samsung Electronics unveiled its newest gaming monitors, with particular emphasis on the groundbreaking Odyssey 3D, which can offer a glass-free viewing of 3D contents. The innovative light field display (LFD) technology allows the Odyssey 3D to create lifelike images that appear three-dimensional from normal 2D content. This is achieved through a lenticular lens1 at the front panel. With Eye Tracking and View Mapping technology, Odyssey 3D ensures an optimally optimized 3D experience without the need to wear separate 3D glasses.
September 2023: Sony India launched a new product, ELF-SR2 Spatial Reality Display. This is a 27-in 4K screen, showing lifelike 3D content without any requirement of special glasses or any VR equipment. Images carried by the display show sharp and great 3D effect.
| Report Attributes | Details |
|---|---|
| Market Size in 2023 | USD 123.17 Billion |
| Market Size by 2032 | USD 561.50 Billion |
| CAGR | CAGR of 18.39% From 2024 to 2032 |
| Base Year | 2023 |
| Forecast Period | 2024-2032 |
| Historical Data | 2020-2022 |
| Report Scope & Coverage | Market Size, Segments Analysis, Competitive Landscape, Regional Analysis, DROC & SWOT Analysis, Forecast Outlook |
| Key Segments | • By Product (Volumetric Display, Stereoscopic Display, Head-Mounted Display), • By Application (Television, Smartphones, Monitor, Mobile Computing Devices, Projectors, Others), • By Technology (Digital Light Processing, Plasma Display Panel, Organic LED, Light Emitting Diode) • By Access Method (Micro Display, Conventional/Screen Based Display) • By End-use (Consumer Electronics, Automotive and Transportation, Medical, Aerospace & Defense, Industrial, Others) |
| Regional Analysis/Coverage | North America (US, Canada, Mexico), Europe (Eastern Europe [Poland, Romania, Hungary, Turkey, Rest of Eastern Europe] Western Europe] Germany, France, UK, Italy, Spain, Netherlands, Switzerland, Austria, Rest of Western Europe]), Asia Pacific (China, India, Japan, South Korea, Vietnam, Singapore, Australia, Rest of Asia Pacific), Middle East & Africa (Middle East [UAE, Egypt, Saudi Arabia, Qatar, Rest of Middle East], Africa [Nigeria, South Africa, Rest of Africa], Latin America (Brazil, Argentina, Colombia, Rest of Latin America) |
| Company Profiles | Samsung Electronics, LG Electronics, Sony Corporation, Panasonic Corporation, Barco NV, AU Optronics, Toshiba Corporation, EON Reality, Koninklijke Philips, SHARP Corporation, Hisense, nVIDIA Corporation, Fujitsu Limited, Planar Systems, Looking Glass Factory, Zebra Imaging, 3DFusion, RealView Imaging, Dimenco, Vizio Inc. |
| Key Drivers | • The Growing Popularity of 3D Displays in Entertainment and Gaming Industries. • Increasing Demand for 3D Displays in Healthcare Applications. |
| Restraints | • High Cost of 3D Display Technology and Limited Affordability. |
Ans: 3D Display Market size was USD 123.17 Billion in 2023 and is expected to Reach USD 561.50 Billion by 2032.
Ans: The major growth factors of the 3D Display Market is Growing Popularity of 3D Displays in Entertainment and Gaming Industries.
ANS: AUO Corporation, BOE Technology Group Co., Ltd., Innolux Corporation, Japan Display Inc., LG Electronics, SAMSUNG, SHARP CORPORATION, Sony Corporation, Truly Semiconductor Co., Ltd., Vision ox Company
Ans: The 3D Display Market is expected to grow at a CAGR of 18.39% during 2024-2032.
Ans: North America dominated the 3D Display Market in 2023.
Table Of Content
1. Introduction
1.1 Market Definition
1.2 Scope (Inclusion and Exclusions)
1.3 Research Assumptions
2. Executive Summary
2.1 Market Overview
2.2 Regional Synopsis
2.3 Competitive Summary
3. Research Methodology
3.1 Top-Down Approach
3.2 Bottom-up Approach
3.3. Data Validation
3.4 Primary Interviews
4. Market Dynamics Impact Analysis
4.1 Market Driving Factors Analysis
4.1.1 Drivers
4.1.2 Restraints
4.1.3 Opportunities
4.1.4 Challenges
4.2 PESTLE Analysis
4.3 Porter’s Five Forces Model
5. Statistical Insights and Trends Reporting
5.1 Adoption Trends and Consumer Behavior
5.2 Supply Chain Insights
5.3 Technological Insights
6. Competitive Landscape
6.1 List of Major Companies, by Region
6.2 Market Share Analysis, by Region
6.3 Product Benchmarking
6.3.1 Product specifications and features
6.3.2 Pricing
6.4 Strategic Initiatives
6.4.1 Marketing and promotional activities
6.4.2 Distribution and supply chain strategies
6.4.3 Expansion plans and new product launches
6.4.4 Strategic partnerships and collaborations
6.5 Technological Advancements
6.6 Market Positioning and Branding
7. 3D Display Market Segmentation, by Product
7.1 Chapter Overview
7.2 Volumetric Display
7.2.1 Volumetric Display Market Trends Analysis (2020-2032)
7.2.2 Volumetric Display Market Size Estimates and Forecasts to 2032 (USD Billion)
7.3 Stereoscopic Display
7.3.1 Stereoscopic Display Market Trends Analysis (2020-2032)
7.3.2 Stereoscopic Display Market Size Estimates and Forecasts to 2032 (USD Billion)
7.4 Head-Mounted Display
7.4.1 Head-Mounted Display Market Trends Analysis (2020-2032)
7.4.2 Head-Mounted Display Market Size Estimates and Forecasts to 2032 (USD Billion)
8. 3D Display Market Segmentation, by Application
8.1 Chapter Overview
8.2 Television
8.2.1 Television Market Trends Analysis (2020-2032)
8.2.2 Television Market Size Estimates And Forecasts To 2032 (USD Billion)
8.3 Smartphones
8.3.1 Smartphones Market Trends Analysis (2020-2032)
8.3.2 Smartphones Market Size Estimates And Forecasts To 2032 (USD Billion)
8.4 Monitor
8.4.1 Monitor Market Trends Analysis (2020-2032)
8.4.2 Monitor Market Size Estimates And Forecasts To 2032 (USD Billion)
8.5 Mobile Computing Devices
8.5.1 Mobile Computing Devices Market Trends Analysis (2020-2032)
8.5.2 Mobile Computing Devices Market Size Estimates And Forecasts To 2032 (USD Billion)
8.6 Projectors
8.6.1 Projectors Market Trends Analysis (2020-2032)
8.6.2 Projectors Market Size Estimates And Forecasts To 2032 (USD Billion)
8.7 Others
8.7.1 Others Market Trends Analysis (2020-2032)
8.7.2 Others Market Size Estimates And Forecasts To 2032 (USD Billion)
9. 3D Display Market Segmentation, by Technology
9.1 Chapter Overview
9.2 Digital Light Processing
9.2.1 Digital Light Processing Market Trends Analysis (2020-2032)
9.2.2 Digital Light Processing Market Size Estimates And Forecasts To 2032 (USD Billion)
9.3 Plasma Display Panel
9.3.1 Plasma Display Panel Market Trends Analysis (2020-2032)
9.3.2 Plasma Display Panel Market Size Estimates And Forecasts To 2032 (USD Billion)
9.3 Organic LED
9.3.1 Organic LED Market Trends Analysis (2020-2032)
9.3.2 Organic LED Market Size Estimates And Forecasts To 2032 (USD Billion)
9.4 Light Emitting Diode
9.4.1 Light Emitting Diode Market Trends Analysis (2020-2032)
9.4.2 Light Emitting Diode Market Size Estimates And Forecasts To 2032 (USD Billion)
10. 3D Display Market Segmentation, by Access Method
10.1 Chapter Overview
10.2 Micro Display
10.2.1 Micro Display Market Trends Analysis (2020-2032)
10.2.2 Micro Display Market Size Estimates And Forecasts To 2032 (USD Billion)
10.3 Conventional/Screen Based Display
10.3.1 Conventional/Screen Based Display Market Trends Analysis (2020-2032)
10.3.2 Conventional/Screen Based Display Market Size Estimates And Forecasts To 2032 (USD Billion)
11. 3D Display Market Segmentation, by End-use
11.1 Chapter Overview
11.2 Consumer Electronics
11.2.1 Consumer Electronics Market Trends Analysis (2020-2032)
11.2.2 Consumer Electronics Market Size Estimates And Forecasts To 2032 (USD Billion)
11.3 Automotive and Transportation
11.3.1 Automotive and Transportation Market Trends Analysis (2020-2032)
11.3.2 Automotive and Transportation Market Size Estimates And Forecasts To 2032 (USD Billion)
11.4 Medical
11.4.1 Medical Market Trends Analysis (2020-2032)
11.4.2 Medical Market Size Estimates And Forecasts To 2032 (USD Billion)
11.5 Aerospace & Defense
11.5.1 Aerospace & Defense Market Trends Analysis (2020-2032)
11.5.2 Aerospace & Defense Market Size Estimates And Forecasts To 2032 (USD Billion)
11.6 Industrial
11.6.1 Industrial Market Trends Analysis (2020-2032)
11.6.2 Industrial Market Size Estimates And Forecasts To 2032 (USD Billion)
11.7 Others
11.7.1 Others Market Trends Analysis (2020-2032)
11.7.2 Others Market Size Estimates And Forecasts To 2032 (USD Billion)
12. Regional Analysis
12.1 Chapter Overview
12.2 North America
12.2.1 Trends Analysis
12.2.2 North America 3D Display Market Estimates And Forecasts, by Country (2020-2032) (USD Billion)
12.2.3 North America 3D Display Market Estimates And Forecasts, by Product (2020-2032) (USD Billion)
12.2.4 North America 3D Display Market Estimates And Forecasts, by Application (2020-2032) (USD Billion)
12.2.5 North America 3D Display Market Estimates And Forecasts, by Technology (2020-2032) (USD Billion)
12.2.6 North America 3D Display Market Estimates And Forecasts, by Access Method (2020-2032) (USD Billion)
12.2.7 North America 3D Display Market Estimates And Forecasts, by End-use (2020-2032) (USD Billion)
12.2.8 USA
12.2.8.1 USA 3D Display Market Estimates And Forecasts, by Product (2020-2032) (USD Billion)
12.2.8.2 USA 3D Display Market Estimates And Forecasts, by Application (2020-2032) (USD Billion)
12.2.8.3 USA 3D Display Market Estimates And Forecasts, by Technology (2020-2032) (USD Billion)
12.2.8.4 USA 3D Display Market Estimates And Forecasts, by Access Method (2020-2032) (USD Billion)
12.2.8.5 USA 3D Display Market Estimates And Forecasts, by End-use (2020-2032) (USD Billion)
12.2.9 Canada
12.2.9.1 Canada 3D Display Market Estimates And Forecasts, by Product (2020-2032) (USD Billion)
12.2.9.2 Canada 3D Display Market Estimates And Forecasts, by Application (2020-2032) (USD Billion)
12.2.9.3 Canada 3D Display Market Estimates And Forecasts, by Technology (2020-2032) (USD Billion)
12.2.9.4 Canada 3D Display Market Estimates And Forecasts, by Access Method (2020-2032) (USD Billion)
12.2.9.5 Canada 3D Display Market Estimates And Forecasts, by End-use (2020-2032) (USD Billion)
12.2.10 Mexico
12.2.10.1 Mexico 3D Display Market Estimates And Forecasts, by Product (2020-2032) (USD Billion)
12.2.10.2 Mexico 3D Display Market Estimates And Forecasts, by Application (2020-2032) (USD Billion)
12.2.10.3 Mexico 3D Display Market Estimates And Forecasts, by Technology (2020-2032) (USD Billion)
12.2.10.4 Mexico 3D Display Market Estimates And Forecasts, by Access Method (2020-2032) (USD Billion)
12.2.10.5 Mexico 3D Display Market Estimates And Forecasts, by End-use (2020-2032) (USD Billion)
12.3 Europe
12.3.1 Eastern Europe
12.3.1.1 Trends Analysis
12.3.1.2 Eastern Europe 3D Display Market Estimates And Forecasts, by Country (2020-2032) (USD Billion)
12.3.1.3 Eastern Europe 3D Display Market Estimates And Forecasts, by Product (2020-2032) (USD Billion)
12.3.1.4 Eastern Europe 3D Display Market Estimates And Forecasts, by Application (2020-2032) (USD Billion)
12.3.1.5 Eastern Europe 3D Display Market Estimates And Forecasts, by Technology (2020-2032) (USD Billion)
12.3.1.6 Eastern Europe 3D Display Market Estimates And Forecasts, by Access Method (2020-2032) (USD Billion)
12.3.1.7 Eastern Europe 3D Display Market Estimates And Forecasts, by End-use (2020-2032) (USD Billion)
12.3.1.8 Poland
12.3.1.8.1 Poland 3D Display Market Estimates And Forecasts, by Product (2020-2032) (USD Billion)
12.3.1.8.2 Poland 3D Display Market Estimates And Forecasts, by Application (2020-2032) (USD Billion)
12.3.1.8.3 Poland 3D Display Market Estimates And Forecasts, by Technology (2020-2032) (USD Billion)
12.3.1.8.4 Poland 3D Display Market Estimates And Forecasts, by Access Method (2020-2032) (USD Billion)
12.3.1.8.5 Poland 3D Display Market Estimates And Forecasts, by End-use (2020-2032) (USD Billion)
12.3.1.9 Romania
12.3.1.9.1 Romania 3D Display Market Estimates And Forecasts, by Product (2020-2032) (USD Billion)
12.3.1.9.2 Romania 3D Display Market Estimates And Forecasts, by Application (2020-2032) (USD Billion)
12.3.1.9.3 Romania 3D Display Market Estimates And Forecasts, by Technology (2020-2032) (USD Billion)
12.3.1.9.4 Romania 3D Display Market Estimates And Forecasts, by Access Method (2020-2032) (USD Billion)
12.3.1.9.5 Romania 3D Display Market Estimates And Forecasts, by End-use (2020-2032) (USD Billion)
12.3.1.10 Hungary
12.3.1.10.1 Hungary 3D Display Market Estimates And Forecasts, by Product (2020-2032) (USD Billion)
12.3.1.10.2 Hungary 3D Display Market Estimates And Forecasts, by Application (2020-2032) (USD Billion)
12.3.1.10.3 Hungary 3D Display Market Estimates And Forecasts, by Technology (2020-2032) (USD Billion)
12.3.1.10.4 Hungary 3D Display Market Estimates And Forecasts, by Access Method (2020-2032) (USD Billion)
12.3.1.10.5 Hungary 3D Display Market Estimates And Forecasts, by End-use (2020-2032) (USD Billion)
12.3.1.11 Turkey
12.3.1.11.1 Turkey 3D Display Market Estimates And Forecasts, by Product (2020-2032) (USD Billion)
12.3.1.11.2 Turkey 3D Display Market Estimates And Forecasts, by Application (2020-2032) (USD Billion)
12.3.1.11.3 Turkey 3D Display Market Estimates And Forecasts, by Technology (2020-2032) (USD Billion)
12.3.1.11.4 Turkey 3D Display Market Estimates And Forecasts, by Access Method (2020-2032) (USD Billion)
12.3.1.11.5 Turkey 3D Display Market Estimates And Forecasts, by End-use (2020-2032) (USD Billion)
12.3.1.12 Rest Of Eastern Europe
12.3.1.12.1 Rest Of Eastern Europe 3D Display Market Estimates And Forecasts, by Product (2020-2032) (USD Billion)
12.3.1.12.2 Rest Of Eastern Europe 3D Display Market Estimates And Forecasts, by Application (2020-2032) (USD Billion)
12.3.1.12.3 Rest Of Eastern Europe 3D Display Market Estimates And Forecasts, by Technology (2020-2032) (USD Billion)
12.3.1.12.4 Rest Of Eastern Europe 3D Display Market Estimates And Forecasts, by Access Method (2020-2032) (USD Billion)
12.3.1.12.5 Rest Of Eastern Europe 3D Display Market Estimates And Forecasts, by End-use (2020-2032) (USD Billion)
12.3.2 Western Europe
12.3.2.1 Trends Analysis
12.3.2.2 Western Europe 3D Display Market Estimates And Forecasts, by Country (2020-2032) (USD Billion)
12.3.2.3 Western Europe 3D Display Market Estimates And Forecasts, by Product (2020-2032) (USD Billion)
12.3.2.4 Western Europe 3D Display Market Estimates And Forecasts, by Application (2020-2032) (USD Billion)
12.3.2.5 Western Europe 3D Display Market Estimates And Forecasts, by Technology (2020-2032) (USD Billion)
12.3.2.6 Western Europe 3D Display Market Estimates And Forecasts, by Access Method (2020-2032) (USD Billion)
12.3.2.7 Western Europe 3D Display Market Estimates And Forecasts, by End-use (2020-2032) (USD Billion)
12.3.2.8 Germany
12.3.2.8.1 Germany 3D Display Market Estimates And Forecasts, by Product (2020-2032) (USD Billion)
12.3.2.8.2 Germany 3D Display Market Estimates And Forecasts, by Application (2020-2032) (USD Billion)
12.3.2.8.3 Germany 3D Display Market Estimates And Forecasts, by Technology (2020-2032) (USD Billion)
12.3.2.8.4 Germany 3D Display Market Estimates And Forecasts, by Access Method (2020-2032) (USD Billion)
12.3.2.8.5 Germany 3D Display Market Estimates And Forecasts, by End-use (2020-2032) (USD Billion)
12.3.2.9 France
12.3.2.9.1 France 3D Display Market Estimates And Forecasts, by Product (2020-2032) (USD Billion)
12.3.2.9.2 France 3D Display Market Estimates And Forecasts, by Application (2020-2032) (USD Billion)
12.3.2.9.3 France 3D Display Market Estimates And Forecasts, by Technology (2020-2032) (USD Billion)
12.3.2.9.4 France 3D Display Market Estimates And Forecasts, by Access Method (2020-2032) (USD Billion)
12.3.2.9.5 France 3D Display Market Estimates And Forecasts, by End-use (2020-2032) (USD Billion)
12.3.2.10 UK
12.3.2.10.1 UK 3D Display Market Estimates And Forecasts, by Product (2020-2032) (USD Billion)
12.3.2.10.2 UK 3D Display Market Estimates And Forecasts, by Application (2020-2032) (USD Billion)
12.3.2.10.3 UK 3D Display Market Estimates And Forecasts, by Technology (2020-2032) (USD Billion)
12.3.2.10.4 UK 3D Display Market Estimates And Forecasts, by Access Method (2020-2032) (USD Billion)
12.3.2.10.5 UK 3D Display Market Estimates And Forecasts, by End-use (2020-2032) (USD Billion)
12.3.2.11 Italy
12.3.2.11.1 Italy 3D Display Market Estimates And Forecasts, by Product (2020-2032) (USD Billion)
12.3.2.11.2 Italy 3D Display Market Estimates And Forecasts, by Application (2020-2032) (USD Billion)
12.3.2.11.3 Italy 3D Display Market Estimates And Forecasts, by Technology (2020-2032) (USD Billion)
12.3.2.11.4 Italy 3D Display Market Estimates And Forecasts, by Access Method (2020-2032) (USD Billion)
12.3.2.11.5 Italy 3D Display Market Estimates And Forecasts, by End-use (2020-2032) (USD Billion)
12.3.2.12 Spain
12.3.2.12.1 Spain 3D Display Market Estimates And Forecasts, by Product (2020-2032) (USD Billion)
12.3.2.12.2 Spain 3D Display Market Estimates And Forecasts, by Application (2020-2032) (USD Billion)
12.3.2.12.3 Spain 3D Display Market Estimates And Forecasts, by Technology (2020-2032) (USD Billion)
12.3.2.12.4 Spain 3D Display Market Estimates And Forecasts, by Access Method (2020-2032) (USD Billion)
12.3.2.12.5 Spain 3D Display Market Estimates And Forecasts, by End-use (2020-2032) (USD Billion)
12.3.2.13 Netherlands
12.3.2.13.1 Netherlands 3D Display Market Estimates And Forecasts, by Product (2020-2032) (USD Billion)
12.3.2.13.2 Netherlands 3D Display Market Estimates And Forecasts, by Application (2020-2032) (USD Billion)
12.3.2.13.3 Netherlands 3D Display Market Estimates And Forecasts, by Technology (2020-2032) (USD Billion)
12.3.2.13.4 Netherlands 3D Display Market Estimates And Forecasts, by Access Method (2020-2032) (USD Billion)
12.3.2.13.5 Netherlands 3D Display Market Estimates And Forecasts, by End-use (2020-2032) (USD Billion)
12.3.2.14 Switzerland
12.3.2.14.1 Switzerland 3D Display Market Estimates And Forecasts, by Product (2020-2032) (USD Billion)
12.3.2.14.2 Switzerland 3D Display Market Estimates And Forecasts, by Application (2020-2032) (USD Billion)
12.3.2.14.3 Switzerland 3D Display Market Estimates And Forecasts, by Technology (2020-2032) (USD Billion)
12.3.2.14.4 Switzerland 3D Display Market Estimates And Forecasts, by Access Method (2020-2032) (USD Billion)
12.3.2.12.5 Switzerland 3D Display Market Estimates And Forecasts, by End-use (2020-2032) (USD Billion)
12.3.2.15 Austria
12.3.2.15.1 Austria 3D Display Market Estimates And Forecasts, by Product (2020-2032) (USD Billion)
12.3.2.15.2 Austria 3D Display Market Estimates And Forecasts, by Application (2020-2032) (USD Billion)
12.3.2.15.3 Austria 3D Display Market Estimates And Forecasts, by Technology (2020-2032) (USD Billion)
12.3.2.15.4 Austria 3D Display Market Estimates And Forecasts, by Access Method (2020-2032) (USD Billion)
12.3.2.15.5 Austria 3D Display Market Estimates And Forecasts, by End-use (2020-2032) (USD Billion)
12.3.2.16 Rest Of Western Europe
12.3.2.16.1 Rest Of Western Europe 3D Display Market Estimates And Forecasts, by Product (2020-2032) (USD Billion)
12.3.2.16.2 Rest Of Western Europe 3D Display Market Estimates And Forecasts, by Application (2020-2032) (USD Billion)
12.3.2.16.3 Rest Of Western Europe 3D Display Market Estimates And Forecasts, by Technology (2020-2032) (USD Billion)
12.3.2.16.4 Rest Of Western Europe 3D Display Market Estimates And Forecasts, by Access Method (2020-2032) (USD Billion)
12.3.2.16.5 Rest Of Western Europe 3D Display Market Estimates And Forecasts, by End-use (2020-2032) (USD Billion)
12.4 Asia Pacific
12.4.1 Trends Analysis
12.4.2 Asia Pacific 3D Display Market Estimates And Forecasts, by Country (2020-2032) (USD Billion)
12.4.3 Asia Pacific 3D Display Market Estimates And Forecasts, by Product (2020-2032) (USD Billion)
12.4.4 Asia Pacific 3D Display Market Estimates And Forecasts, by Application (2020-2032) (USD Billion)
12.4.5 Asia Pacific 3D Display Market Estimates And Forecasts, by Technology (2020-2032) (USD Billion)
12.4.6 Asia Pacific 3D Display Market Estimates And Forecasts, by Access Method (2020-2032) (USD Billion)
12.4.7 Asia Pacific 3D Display Market Estimates And Forecasts, by End-use (2020-2032) (USD Billion)
12.4.8 China
12.4.8.1 China 3D Display Market Estimates And Forecasts, by Product (2020-2032) (USD Billion)
12.4.8.2 China 3D Display Market Estimates And Forecasts, by Application (2020-2032) (USD Billion)
12.4.8.3 China 3D Display Market Estimates And Forecasts, by Technology (2020-2032) (USD Billion)
12.4.8.4 China 3D Display Market Estimates And Forecasts, by Access Method (2020-2032) (USD Billion)
12.4.8.5 China 3D Display Market Estimates And Forecasts, by End-use (2020-2032) (USD Billion)
12.4.9 India
12.4.9.1 India 3D Display Market Estimates And Forecasts, by Product (2020-2032) (USD Billion)
12.4.9.2 India 3D Display Market Estimates And Forecasts, by Application (2020-2032) (USD Billion)
12.4.9.3 India 3D Display Market Estimates And Forecasts, by Technology (2020-2032) (USD Billion)
12.4.9.4 India 3D Display Market Estimates And Forecasts, by Access Method (2020-2032) (USD Billion)
12.4.9.5 India 3D Display Market Estimates And Forecasts, by End-use (2020-2032) (USD Billion)
12.4.10 Japan
12.4.10.1 Japan 3D Display Market Estimates And Forecasts, by Product (2020-2032) (USD Billion)
12.4.10.2 Japan 3D Display Market Estimates And Forecasts, by Application (2020-2032) (USD Billion)
12.4.10.3 Japan 3D Display Market Estimates And Forecasts, by Technology (2020-2032) (USD Billion)
12.4.10.4 Japan 3D Display Market Estimates And Forecasts, by Access Method (2020-2032) (USD Billion)
12.4.10.5 Japan 3D Display Market Estimates And Forecasts, by End-use (2020-2032) (USD Billion)
12.4.11 South Korea
12.4.11.1 South Korea 3D Display Market Estimates And Forecasts, by Product (2020-2032) (USD Billion)
12.4.11.2 South Korea 3D Display Market Estimates And Forecasts, by Application (2020-2032) (USD Billion)
12.4.11.3 South Korea 3D Display Market Estimates And Forecasts, by Technology (2020-2032) (USD Billion)
12.4.11.4 South Korea 3D Display Market Estimates And Forecasts, by Access Method (2020-2032) (USD Billion)
12.4.11.5 South Korea 3D Display Market Estimates And Forecasts, by End-use (2020-2032) (USD Billion)
12.4.12 Vietnam
12.4.12.1 Vietnam 3D Display Market Estimates And Forecasts, by Product (2020-2032) (USD Billion)
12.4.12.2 Vietnam 3D Display Market Estimates And Forecasts, by Application (2020-2032) (USD Billion)
12.4.12.3 Vietnam 3D Display Market Estimates And Forecasts, by Technology (2020-2032) (USD Billion)
12.4.12.4 Vietnam 3D Display Market Estimates And Forecasts, by Access Method (2020-2032) (USD Billion)
12.4.12.5 Vietnam 3D Display Market Estimates And Forecasts, by End-use (2020-2032) (USD Billion)
12.4.13 Singapore
12.4.13.1 Singapore 3D Display Market Estimates And Forecasts, by Product (2020-2032) (USD Billion)
12.4.13.2 Singapore 3D Display Market Estimates And Forecasts, by Application (2020-2032) (USD Billion)
12.4.13.3 Singapore 3D Display Market Estimates And Forecasts, by Technology (2020-2032) (USD Billion)
12.4.13.4 Singapore 3D Display Market Estimates And Forecasts, by Access Method (2020-2032) (USD Billion)
12.4.13.5 Singapore 3D Display Market Estimates And Forecasts, by End-use (2020-2032) (USD Billion)
12.4.14 Australia
12.4.14.1 Australia 3D Display Market Estimates And Forecasts, by Product (2020-2032) (USD Billion)
12.4.14.2 Australia 3D Display Market Estimates And Forecasts, by Application (2020-2032) (USD Billion)
12.4.14.3 Australia 3D Display Market Estimates And Forecasts, by Technology (2020-2032) (USD Billion)
12.4.14.4 Australia 3D Display Market Estimates And Forecasts, by Access Method (2020-2032) (USD Billion)
12.4.14.5 Australia 3D Display Market Estimates And Forecasts, by End-use (2020-2032) (USD Billion)
12.4.15 Rest Of Asia Pacific
12.4.15.1 Rest Of Asia Pacific 3D Display Market Estimates And Forecasts, by Product (2020-2032) (USD Billion)
12.4.15.2 Rest Of Asia Pacific 3D Display Market Estimates And Forecasts, by Application (2020-2032) (USD Billion)
12.4.15.3 Rest Of Asia Pacific 3D Display Market Estimates And Forecasts, by Technology (2020-2032) (USD Billion)
12.4.15.4 Rest Of Asia Pacific 3D Display Market Estimates And Forecasts, by Access Method (2020-2032) (USD Billion)
12.4.15.5 Rest Of Asia Pacific 3D Display Market Estimates And Forecasts, by End-use (2020-2032) (USD Billion)
12.5 Middle East And Africa
12.5.1 Middle East
12.5.1.1 Trends Analysis
12.5.1.2 Middle East 3D Display Market Estimates And Forecasts, by Country (2020-2032) (USD Billion)
12.5.1.3 Middle East 3D Display Market Estimates And Forecasts, by Product (2020-2032) (USD Billion)
12.5.1.4 Middle East 3D Display Market Estimates And Forecasts, by Application (2020-2032) (USD Billion)
12.5.1.5 Middle East 3D Display Market Estimates And Forecasts, by Technology (2020-2032) (USD Billion)
12.5.1.6 Middle East 3D Display Market Estimates And Forecasts, by Access Method (2020-2032) (USD Billion)
12.5.1.7 Middle East 3D Display Market Estimates And Forecasts, by End-use (2020-2032) (USD Billion)
12.5.1.8 UAE
12.5.1.8.1 UAE 3D Display Market Estimates And Forecasts, by Product (2020-2032) (USD Billion)
12.5.1.8.2 UAE 3D Display Market Estimates And Forecasts, by Application (2020-2032) (USD Billion)
12.5.1.8.3 UAE 3D Display Market Estimates And Forecasts, by Technology (2020-2032) (USD Billion)
12.5.1.8.4 UAE 3D Display Market Estimates And Forecasts, by Access Method (2020-2032) (USD Billion)
12.5.1.8.5 UAE 3D Display Market Estimates And Forecasts, by End-use (2020-2032) (USD Billion)
12.5.1.9 Egypt
12.5.1.9.1 Egypt 3D Display Market Estimates And Forecasts, by Product (2020-2032) (USD Billion)
12.5.1.9.2 Egypt 3D Display Market Estimates And Forecasts, by Application (2020-2032) (USD Billion)
12.5.1.9.3 Egypt 3D Display Market Estimates And Forecasts, by Technology (2020-2032) (USD Billion)
12.5.1.9.4 Egypt 3D Display Market Estimates And Forecasts, by Access Method (2020-2032) (USD Billion)
12.5.1.9.5 Egypt 3D Display Market Estimates And Forecasts, by End-use (2020-2032) (USD Billion)
12.5.1.10 Saudi Arabia
12.5.1.10.1 Saudi Arabia 3D Display Market Estimates And Forecasts, by Product (2020-2032) (USD Billion)
12.5.1.10.2 Saudi Arabia 3D Display Market Estimates And Forecasts, by Application (2020-2032) (USD Billion)
12.5.1.10.3 Saudi Arabia 3D Display Market Estimates And Forecasts, by Technology (2020-2032) (USD Billion)
12.5.1.10.4 Saudi Arabia 3D Display Market Estimates And Forecasts, by Access Method (2020-2032) (USD Billion)
12.5.1.10.5 Saudi Arabia 3D Display Market Estimates And Forecasts, by End-use (2020-2032) (USD Billion)
12.5.1.11 Qatar
12.5.1.11.1 Qatar 3D Display Market Estimates And Forecasts, by Product (2020-2032) (USD Billion)
12.5.1.11.2 Qatar 3D Display Market Estimates And Forecasts, by Application (2020-2032) (USD Billion)
12.5.1.11.3 Qatar 3D Display Market Estimates And Forecasts, by Technology (2020-2032) (USD Billion)
12.5.1.11.4 Qatar 3D Display Market Estimates And Forecasts, by Access Method (2020-2032) (USD Billion)
12.5.1.11.5 Qatar 3D Display Market Estimates And Forecasts, by End-use (2020-2032) (USD Billion)
12.5.1.12 Rest Of Middle East
12.5.1.12.1 Rest Of Middle East 3D Display Market Estimates And Forecasts, by Product (2020-2032) (USD Billion)
12.5.1.12.2 Rest Of Middle East 3D Display Market Estimates And Forecasts, by Application (2020-2032) (USD Billion)
12.5.1.12.3 Rest Of Middle East 3D Display Market Estimates And Forecasts, by Technology (2020-2032) (USD Billion)
12.5.1.12.4 Rest Of Middle East 3D Display Market Estimates And Forecasts, by Access Method (2020-2032) (USD Billion)
12.5.1.12.5 Rest Of Middle East 3D Display Market Estimates And Forecasts, by End-use (2020-2032) (USD Billion)
12.5.2 Africa
12.5.2.1 Trends Analysis
12.5.2.2 Africa 3D Display Market Estimates And Forecasts, by Country (2020-2032) (USD Billion)
12.5.2.3 Africa 3D Display Market Estimates And Forecasts, by Product (2020-2032) (USD Billion)
12.5.2.4 Africa 3D Display Market Estimates And Forecasts, by Application (2020-2032) (USD Billion)
12.5.2.5 Africa 3D Display Market Estimates And Forecasts, by Technology (2020-2032) (USD Billion)
12.5.2.6 Africa 3D Display Market Estimates And Forecasts, by Access Method (2020-2032) (USD Billion)
12.5.2.7 Africa 3D Display Market Estimates And Forecasts, by End-use (2020-2032) (USD Billion)
12.5.2.8 South Africa
12.5.2.8.1 South Africa 3D Display Market Estimates And Forecasts, by Product (2020-2032) (USD Billion)
12.5.2.8.2 South Africa 3D Display Market Estimates And Forecasts, by Application (2020-2032) (USD Billion)
12.5.2.8.3 South Africa 3D Display Market Estimates And Forecasts, by Technology (2020-2032) (USD Billion)
12.5.2.8.4 South Africa 3D Display Market Estimates And Forecasts, by Access Method (2020-2032) (USD Billion)
12.5.2.8.5 South Africa 3D Display Market Estimates And Forecasts, by End-use (2020-2032) (USD Billion)
12.5.2.9 Nigeria
12.5.2.9.1 Nigeria 3D Display Market Estimates And Forecasts, by Product (2020-2032) (USD Billion)
12.5.2.9.2 Nigeria 3D Display Market Estimates And Forecasts, by Application (2020-2032) (USD Billion)
12.5.2.9.3 Nigeria 3D Display Market Estimates And Forecasts, by Technology (2020-2032) (USD Billion)
12.5.2.9.4 Nigeria 3D Display Market Estimates And Forecasts, by Access Method (2020-2032) (USD Billion)
12.5.2.9.5 Nigeria 3D Display Market Estimates And Forecasts, by End-use (2020-2032) (USD Billion)
12.5.2.10 Rest Of Africa
12.5.2.10.1 Rest Of Africa 3D Display Market Estimates And Forecasts, by Product (2020-2032) (USD Billion)
12.5.2.10.2 Rest Of Africa 3D Display Market Estimates And Forecasts, by Application (2020-2032) (USD Billion)
12.5.2.10.3 Rest Of Africa 3D Display Market Estimates And Forecasts, by Technology (2020-2032) (USD Billion)
12.5.2.10.4 Rest Of Africa 3D Display Market Estimates And Forecasts, by Access Method (2020-2032) (USD Billion)
12.5.2.10.5 Rest Of Africa 3D Display Market Estimates And Forecasts, by End-use (2020-2032) (USD Billion)
12.6 Latin America
12.6.1 Trends Analysis
12.6.2 Latin America 3D Display Market Estimates And Forecasts, by Country (2020-2032) (USD Billion)
12.6.3 Latin America 3D Display Market Estimates And Forecasts, by Product (2020-2032) (USD Billion)
12.6.4 Latin America 3D Display Market Estimates And Forecasts, by Application (2020-2032) (USD Billion)
12.6.5 Latin America 3D Display Market Estimates And Forecasts, by Technology (2020-2032) (USD Billion)
12.6.6 Latin America 3D Display Market Estimates And Forecasts, by Access Method (2020-2032) (USD Billion)
12.6.7 Latin America 3D Display Market Estimates And Forecasts, by End-use (2020-2032) (USD Billion)
12.6.8 Brazil
12.6.8.1 Brazil 3D Display Market Estimates And Forecasts, by Product (2020-2032) (USD Billion)
12.6.8.2 Brazil 3D Display Market Estimates And Forecasts, by Application (2020-2032) (USD Billion)
12.6.8.3 Brazil 3D Display Market Estimates And Forecasts, by Technology (2020-2032) (USD Billion)
12.6.8.4 Brazil 3D Display Market Estimates And Forecasts, by Access Method (2020-2032) (USD Billion)
12.6.8.5 Brazil 3D Display Market Estimates And Forecasts, by End-use (2020-2032) (USD Billion)
12.6.9 Argentina
12.6.9.1 Argentina 3D Display Market Estimates And Forecasts, by Product (2020-2032) (USD Billion)
12.6.9.2 Argentina 3D Display Market Estimates And Forecasts, by Application (2020-2032) (USD Billion)
12.6.9.3 Argentina 3D Display Market Estimates And Forecasts, by Technology (2020-2032) (USD Billion)
12.6.9.4 Argentina 3D Display Market Estimates And Forecasts, by Access Method (2020-2032) (USD Billion)
12.6.9.5 Argentina 3D Display Market Estimates And Forecasts, by End-use (2020-2032) (USD Billion)
12.6.10 Colombia
12.6.10.1 Colombia 3D Display Market Estimates And Forecasts, by Product (2020-2032) (USD Billion)
12.6.10.2 Colombia 3D Display Market Estimates And Forecasts, by Application (2020-2032) (USD Billion)
12.6.10.3 Colombia 3D Display Market Estimates And Forecasts, by Technology (2020-2032) (USD Billion)
12.6.10.4 Colombia 3D Display Market Estimates And Forecasts, by Access Method (2020-2032) (USD Billion)
12.6.10.5 Colombia 3D Display Market Estimates And Forecasts, by End-use (2020-2032) (USD Billion)
12.6.11 Rest Of Latin America
12.6.11.1 Rest Of Latin America 3D Display Market Estimates And Forecasts, by Product (2020-2032) (USD Billion)
12.6.11.2 Rest Of Latin America 3D Display Market Estimates And Forecasts, by Application (2020-2032) (USD Billion)
12.6.11.3 Rest Of Latin America 3D Display Market Estimates And Forecasts, by Technology (2020-2032) (USD Billion)
12.6.11.4 Rest Of Latin America 3D Display Market Estimates And Forecasts, by Access Method (2020-2032) (USD Billion)
12.6.11.5 Rest Of Latin America 3D Display Market Estimates And Forecasts, by End-use (2020-2032) (USD Billion)
13. Company Profiles
13.1 Samsung Electronics
13.1.1 Company Overview
13.1.2 Financial
13.1.3 Products/ Services Offered
13.1.4 SWOT Analysis
13.2 LG Electronics
13.2.1 Company Overview
13.2.2 Financial
13.2.3 Products/ Services Offered
13.2.4 SWOT Analysis
13.3 Sony Corporation
13.3.1 Company Overview
13.3.2 Financial
13.3.3 Products/ Services Offered
13.3.4 SWOT Analysis
13.4 Panasonic Corporation
13.4.1 Company Overview
13.4.2 Financial
13.4.3 Products/ Services Offered
13.4.4 SWOT Analysis
13.5 Barco NV
13.5.1 Company Overview
13.5.2 Financial
13.5.3 Products/ Services Offered
13.5.4 SWOT Analysis
13.6 AU Optronics
13.6.1 Company Overview
13.6.2 Financial
13.6.3 Products/ Services Offered
13.6.4 SWOT Analysis
13.7 Toshiba Corporation
13.7.1 Company Overview
13.7.2 Financial
13.7.3 Products/ Services Offered
13.7.4 SWOT Analysis
13.8 EON Reality
13.8.1 Company Overview
13.8.2 Financial
13.8.3 Products/ Services Offered
13.8.4 SWOT Analysis
13.9 Koninklijke Philips
13.9.1 Company Overview
13.9.2 Financial
13.9.3 Products/ Services Offered
13.9.4 SWOT Analysis
13.10 SHARP Corporation
13.10.1 Company Overview
13.10.2 Financial
13.10.3 Products/ Services Offered
13.10.4 SWOT Analysis
14. Use Cases and Best Practices
15. Conclusion
An accurate research report requires proper strategizing as well as implementation. There are multiple factors involved in the completion of good and accurate research report and selecting the best methodology to compete the research is the toughest part. Since the research reports we provide play a crucial role in any company’s decision-making process, therefore we at SNS Insider always believe that we should choose the best method which gives us results closer to reality. This allows us to reach at a stage wherein we can provide our clients best and accurate investment to output ratio.
Each report that we prepare takes a timeframe of 350-400 business hours for production. Starting from the selection of titles through a couple of in-depth brain storming session to the final QC process before uploading our titles on our website we dedicate around 350 working hours. The titles are selected based on their current market cap and the foreseen CAGR and growth.
The 5 steps process:
Step 1: Secondary Research:
Secondary Research or Desk Research is as the name suggests is a research process wherein, we collect data through the readily available information. In this process we use various paid and unpaid databases which our team has access to and gather data through the same. This includes examining of listed companies’ annual reports, Journals, SEC filling etc. Apart from this our team has access to various associations across the globe across different industries. Lastly, we have exchange relationships with various university as well as individual libraries.

Step 2: Primary Research
When we talk about primary research, it is a type of study in which the researchers collect relevant data samples directly, rather than relying on previously collected data. This type of research is focused on gaining content specific facts that can be sued to solve specific problems. Since the collected data is fresh and first hand therefore it makes the study more accurate and genuine.
We at SNS Insider have divided Primary Research into 2 parts.
Part 1 wherein we interview the KOLs of major players as well as the upcoming ones across various geographic regions. This allows us to have their view over the market scenario and acts as an important tool to come closer to the accurate market numbers. As many as 45 paid and unpaid primary interviews are taken from both the demand and supply side of the industry to make sure we land at an accurate judgement and analysis of the market.
This step involves the triangulation of data wherein our team analyses the interview transcripts, online survey responses and observation of on filed participants. The below mentioned chart should give a better understanding of the part 1 of the primary interview.

Part 2: In this part of primary research the data collected via secondary research and the part 1 of the primary research is validated with the interviews from individual consultants and subject matter experts.
Consultants are those set of people who have at least 12 years of experience and expertise within the industry whereas Subject Matter Experts are those with at least 15 years of experience behind their back within the same space. The data with the help of two main processes i.e., FGDs (Focused Group Discussions) and IDs (Individual Discussions). This gives us a 3rd party nonbiased primary view of the market scenario making it a more dependable one while collation of the data pointers.
Step 3: Data Bank Validation
Once all the information is collected via primary and secondary sources, we run that information for data validation. At our intelligence centre our research heads track a lot of information related to the market which includes the quarterly reports, the daily stock prices, and other relevant information. Our data bank server gets updated every fortnight and that is how the information which we collected using our primary and secondary information is revalidated in real time.

Step 4: QA/QC Process
After all the data collection and validation our team does a final level of quality check and quality assurance to get rid of any unwanted or undesired mistakes. This might include but not limited to getting rid of the any typos, duplication of numbers or missing of any important information. The people involved in this process include technical content writers, research heads and graphics people. Once this process is completed the title gets uploader on our platform for our clients to read it.
Step 5: Final QC/QA Process:
This is the last process and comes when the client has ordered the study. In this process a final QA/QC is done before the study is emailed to the client. Since we believe in giving our clients a good experience of our research studies, therefore, to make sure that we do not lack at our end in any way humanly possible we do a final round of quality check and then dispatch the study to the client.
Market Segmentation
By Product
Volumetric Display
Stereoscopic Display
Head-Mounted Display
By Application
Television
Smartphones
Monitor
Mobile Computing Devices
Projectors
Others
By Technology
Digital Light Processing
Plasma Display Panel
Organic LED
Light Emitting Diode
By Access Method
Micro Display
Conventional/Screen-Based Display
By End-use
Consumer Electronics
Automotive and Transportation
Medical
Aerospace & Defense
Industrial
Others
Request for Segment Customization as per your Business Requirement: Segment Customization Request
REGIONAL COVERAGE:
North America
US
Canada
Mexico
Europe
Eastern Europe
Poland
Romania
Hungary
Turkey
Rest of Eastern Europe
Western Europe
Germany
France
UK
Italy
Spain
Netherlands
Switzerland
Austria
Rest of Western Europe
Asia Pacific
China
India
Japan
South Korea
Vietnam
Singapore
Australia
Rest of Asia Pacific
Middle East & Africa
Middle East
UAE
Egypt
Saudi Arabia
Qatar
Rest of the Middle East
Africa
Nigeria
South Africa
Rest of Africa
Latin America
Brazil
Argentina
Colombia
Rest of Latin America
Request for Country Level Research Report: Country Level Customization Request
Available Customization
With the given market data, SNS Insider offers customization as per the company’s specific needs. The following customization options are available for the report:
Product Analysis
Criss-Cross segment analysis (e.g. Product X Application)
Product Matrix which gives a detailed comparison of product portfolio of each company
Geographic Analysis
Additional countries in any of the regions
Company Information
Detailed analysis and profiling of additional market players (Up to five)
The Fire Sprinkler Systems Market size was valued at USD 11.49 Billion in 2023 and expected to grow at a CAGR of 9.68% to reach USD 26.40 Billion by 2032.
The Smart Home Projector Market size was valued at USD 761.40 million in 2023. It is expected to hit USD 3250.52 million by 2032 and grow at a CAGR of 17.5% over the forecast period of 2024-2032.
The Artificial Intelligence Sensor Market was valued at USD 3.9 Billion in 2023 and is expected to reach USD 98.7 Billion by 2032, growing at a CAGR of 43.06% from 2024-2032.
The Connected Living Room Market Size was USD 50.55 billion in 2023 and is expected to reach USD 101.95 Bn by 2032 and grow at a CAGR of 8.12% by 2024-2032.
The Semiconductor Market was valued at USD 584.79 billion in 2023 and is expected to reach USD 1876.48 billion by 2032, growing at a CAGR of 13.86% over the forecast period 2024-2032.
The Advanced Process Control Market was valued at USD 2.24 billion in 2023 and is expected to grow at a CAGR of 10.37% to reach USD 5.43 billion by 2032.

Hi! Click one of our member below to chat on Phone
© 2025 All Rights Reserved by SNS Insider Pvt Ltd


