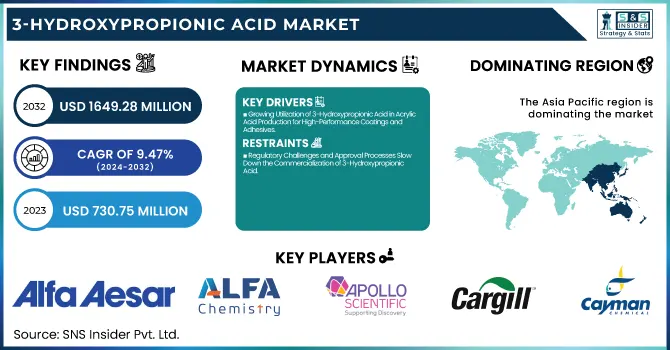
The 3-Hydroxypropionic Acid Market Size was valued at USD 730.75 Million in 2023 and is expected to reach USD 1,649.28 Million by 2032, growing at a CAGR of 9.47% over the forecast period of 2024-2032.
The 3-Hydroxypropionic Acid Market is evolving with rising applications in pharmaceuticals, biodegradable polymers, and chemical intermediates. Our report explores price trends of raw materials, analyzing cost fluctuations affecting production. A detailed import and export data by region highlights key trading hubs and supply chain shifts. The market is also shaped by investment and funding trends, with growing R&D efforts driving innovation. Additionally, the impact of inflation and economic factors provides insights into pricing dynamics and demand fluctuations. As industries advance, automation and digitalization in manufacturing are enhancing efficiency and scalability. This comprehensive study delivers valuable intelligence, helping stakeholders navigate emerging opportunities and challenges in this rapidly growing market.
Drivers
Growing Utilization of 3-Hydroxypropionic Acid in Acrylic Acid Production for High-Performance Coatings and Adhesives
The demand for acrylic acid, a key derivative of 3-Hydroxypropionic Acid, is rising across various industries, including paints, coatings, adhesives, and sealants. Acrylic acid and its esters are widely used in the production of superabsorbent polymers, which find applications in personal care products such as diapers and sanitary pads. With the shift towards bio-based chemical production, 3-Hydroxypropionic Acid is emerging as a sustainable precursor to acrylic acid, reducing dependence on petroleum-derived chemicals. Additionally, the growth of the construction and automotive industries is fueling demand for high-performance coatings and adhesives, further driving the adoption of 3-Hydroxypropionic Acid. The increasing emphasis on sustainable and low-VOC (volatile organic compound) coatings has also propelled research into bio-based acrylic acid production. Industry players are leveraging biotechnological advancements to enhance fermentation processes, improving the yield and cost-effectiveness of 3-Hydroxypropionic Acid, thereby strengthening its market potential.
Restraints
Regulatory Challenges and Approval Processes Slow Down the Commercialization of 3-Hydroxypropionic Acid
The commercialization of 3-Hydroxypropionic Acid is hindered by regulatory complexities and lengthy approval processes, particularly in industries such as food, pharmaceuticals, and biodegradable packaging. Regulatory bodies such as the U.S. Food and Drug Administration (FDA) and the European Chemicals Agency (ECHA) impose stringent safety and quality standards on bio-based chemicals, requiring extensive testing and compliance. The process of obtaining approvals for new applications can be time-consuming and expensive, delaying market entry. Additionally, regional variations in environmental regulations create challenges for manufacturers looking to expand globally. Compliance with multiple regulatory frameworks adds administrative burdens and increases operational costs. These regulatory hurdles make it difficult for emerging players to enter the market, slowing down the overall commercialization and industrial adoption of 3-Hydroxypropionic Acid.
Opportunities
Rising Investments in Bio-Based Chemicals and Circular Economy Initiatives Drive Market Expansion
Governments, research institutions, and private investors are increasingly funding bio-based chemical research and development, creating new opportunities for the 3-Hydroxypropionic Acid Market. As industries transition towards circular economy models, bio-based chemicals such as 3-Hydroxypropionic Acid are gaining prominence as sustainable alternatives to fossil-based compounds. Several funding initiatives are supporting the development of scalable fermentation technologies and biorefinery projects, enabling cost-effective production. Large chemical manufacturers are also partnering with biotechnology firms to accelerate commercialization efforts. The increasing alignment of bio-based chemical innovations with global sustainability goals is expected to create long-term growth prospects for 3-Hydroxypropionic Acid, driving market expansion across multiple industries.
Challenge
Competition from Alternative Bio-Based Chemicals and Petroleum-Derived Substitutes Limits Market Penetration
The 3-Hydroxypropionic Acid Market faces stiff competition from alternative bio-based chemicals and petroleum-derived substitutes, which offer cost advantages and established supply chains. Compounds such as lactic acid, succinic acid, and bio-based acrylic acid serve as competing alternatives, each with its own industrial applications. Additionally, traditional petroleum-based chemicals continue to dominate due to their lower production costs and extensive manufacturing infrastructure. The price sensitivity of end-users, especially in cost-driven industries such as packaging and textiles, further limits the widespread adoption of 3-Hydroxypropionic Acid. Addressing this challenge requires ongoing innovations to reduce production costs and enhance product performance, ensuring competitiveness in the evolving bio-based chemical market.
By Source
Petroleum segment dominated the 3-Hydroxypropionic Acid Market in 2023 with a 54.8% market share. The dominance of petroleum-based 3-Hydroxypropionic Acid is primarily due to its cost-effectiveness and established industrial infrastructure for large-scale chemical synthesis. While bio-based alternatives are gaining traction, the high production cost and limited scalability of fermentation-based processes have restricted their market penetration. Organizations such as the American Chemistry Council (ACC) and the European Chemical Industry Council (Cefic) have reported continued reliance on petroleum-derived feedstocks for specialty chemicals, including 3-Hydroxypropionic Acid, due to their consistent supply and lower production costs. Additionally, the absence of stringent regulations specifically targeting petroleum-based 3-Hydroxypropionic Acid has further solidified its market dominance.
By Form
Liquid form dominated the 3-Hydroxypropionic Acid Market in 2023 with a 58.5% market share. Liquid 3-Hydroxypropionic Acid is preferred due to its enhanced solubility and ease of incorporation into various industrial processes, particularly in the production of acrylic acid, biodegradable polymers, and chemical intermediates. The U.S. Environmental Protection Agency (EPA) has recognized the increasing utilization of liquid bio-based chemicals in sustainable manufacturing, but petroleum-based liquid formulations remain the industry standard. Furthermore, several research institutions, including the National Renewable Energy Laboratory (NREL), have highlighted the growing efficiency of liquid-phase catalytic processes, which favor liquid 3-Hydroxypropionic Acid over its powdered counterpart.
By Application
Acrylic Acid application dominated the 3-Hydroxypropionic Acid Market in 2023 with a 40.3% market share. The increasing demand for acrylic acid in coatings, adhesives, and superabsorbent polymers has driven the widespread adoption of 3-Hydroxypropionic Acid as a bio-based alternative to fossil-derived acrylic acid. The European Union’s Green Deal and initiatives by the U.S. Department of Energy (DOE) have encouraged research into sustainable acrylic acid production, further boosting the use of 3-Hydroxypropionic Acid in this segment. Companies like BASF and Arkema have invested in developing bio-based acrylic acid technologies, reinforcing its dominance in the market. The growing construction and hygiene product sectors also contribute to the sustained demand for acrylic acid-based products.
By End-Use Industry
Chemical industry dominated the 3-Hydroxypropionic Acid Market in 2023 with a 35.4% market share. The chemical industry remains the largest consumer of 3-Hydroxypropionic Acid, driven by its applications in acrylic acid, solvents, and biodegradable plastics. The International Council of Chemical Associations (ICCA) has highlighted the increasing integration of bio-based chemicals into industrial formulations, yet petroleum-based 3-Hydroxypropionic Acid continues to be widely used due to its affordability and established production pathways. Government-backed sustainability initiatives, such as the European Bioeconomy Strategy, are expected to accelerate the transition toward bio-based chemicals, but in 2023, the chemical industry’s reliance on cost-effective petroleum-based derivatives ensured its market leadership.
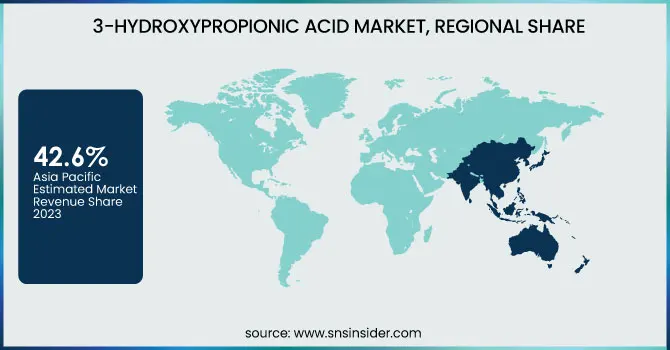
Asia Pacific dominated the 3-Hydroxypropionic Acid Market in 2023 with a market share of 42.6%. The region’s dominance is driven by rapid industrialization, growing chemical manufacturing, and strong demand from sectors such as agriculture, pharmaceuticals, and packaging. Countries like China, Japan, and India lead the market, with China holding the largest share due to its robust chemical industry and increasing investments in bio-based chemicals. According to the China National Chemical Information Center (CNCIC), the country produced over 60% of global bio-based chemicals in 2023, strengthening its position in 3-Hydroxypropionic Acid production. Japan’s government-backed initiatives, such as the Green Growth Strategy, support the expansion of sustainable chemicals, while India's Make in India initiative has boosted domestic chemical manufacturing. Additionally, China’s Ministry of Industry and Information Technology (MIIT) has reported significant investments in bio-based polymer research, further propelling the demand for 3-Hydroxypropionic Acid in the region.
On the other hand, North America emerged as the fastest-growing region in the 3-Hydroxypropionic Acid Market, with a substantial growth rate during the forecast period. The region’s rapid growth is attributed to increasing adoption of biodegradable polymers, government regulations promoting sustainability, and significant R&D investments. The United States dominates the North American market, driven by advancements in bio-based chemical production, high demand for acrylic acid, and strong presence of key players such as Cargill, Novozymes, and Thermo Fisher Scientific. The U.S. Department of Energy (DOE) and Environmental Protection Agency (EPA) have implemented policies supporting bio-based alternatives, accelerating market expansion. Canada is also witnessing growth due to its Bioeconomy Strategy, which promotes the adoption of sustainable chemicals. Furthermore, the U.S. National Renewable Energy Laboratory (NREL) has reported increased research funding for bio-based 3-Hydroxypropionic Acid, highlighting its potential in reducing dependency on fossil-based chemicals in North America.
Alfa Aesar (Thermo Fisher Scientific Inc.)
Alfa Chemistry
Apollo Scientific
Beijing PhaBuilder Biotechnology Co., Ltd.
Cargill, Incorporated
Cayman Chemical Company
Fluoropharm Co., Ltd.
Hangzhou Dayang Chemical
Haihang Industry
LG Chem
Merck KGaA
Novozymes
Oakwood Products Inc.
ShanDong Fine Chemical
Shanxi Jinjin Chemical Co., Ltd.
Sigma-Aldrich
Spectrum Chemical Manufacturing Corp
TCI N.V. (Tokyo Chemical Industry Co., Ltd.)
Toronto Research Chemicals Inc.
Zhengzhou Alfa Chemical Co., Ltd.
Report Attributes | Details |
---|---|
Market Size in 2023 | USD 730.75 Million |
Market Size by 2032 | USD 1,649.28 Million |
CAGR | CAGR of 9.47% From 2024 to 2032 |
Base Year | 2023 |
Forecast Period | 2024-2032 |
Historical Data | 2020-2022 |
Report Scope & Coverage | Market Size, Segments Analysis, Competitive Landscape, Regional Analysis, DROC & SWOT Analysis, Forecast Outlook |
Key Segments | •By Source (Petroleum, Bio-based) •By Form (Powder, Liquid) •By Application (Acrylic Acid, Biodegradable Polymers, Chemical Intermediates, Others) •By End-Use Industry (Pharmaceuticals, Agriculture, Chemical, Packaging, Others) |
Regional Analysis/Coverage | North America (US, Canada, Mexico), Europe (Eastern Europe [Poland, Romania, Hungary, Turkey, Rest of Eastern Europe] Western Europe] Germany, France, UK, Italy, Spain, Netherlands, Switzerland, Austria, Rest of Western Europe]), Asia Pacific (China, India, Japan, South Korea, Vietnam, Singapore, Australia, Rest of Asia Pacific), Middle East & Africa (Middle East [UAE, Egypt, Saudi Arabia, Qatar, Rest of Middle East], Africa [Nigeria, South Africa, Rest of Africa], Latin America (Brazil, Argentina, Colombia, Rest of Latin America) |
Company Profiles | Beijing PhaBuilder Biotechnology Co., Ltd., Cargill, Incorporated, LG Chem, Merck KGaA, Thermo Fisher Scientific Inc., Tokyo Chemical Industry Co., Ltd. (TCI), Zhengzhou Alfa Chemical Co., Ltd., Fluoropharm Co., Ltd., Spectrum Chemical, Oakwood Products Inc. and other key players |
Ans: The 3-Hydroxypropionic Acid Market was valued at USD 730.75 Million in 2023.
Ans: The 3-Hydroxypropionic Acid Market is expected to reach USD 1,649.28 Million by 2032.
Ans: The 3-Hydroxypropionic Acid Market is projected to grow at a CAGR of 9.47% over the forecast period.
Ans: The liquid form of 3-Hydroxypropionic Acid held a 58.5% market share in 2023 due to its superior solubility and usability.
Ans: North America is the fastest-growing region in the 3-Hydroxypropionic Acid Market due to rising demand for bio-based chemicals.
Table of Contents
1. Introduction
1.1 Market Definition
1.2 Scope (Inclusion and Exclusions)
1.3 Research Assumptions
2. Executive Summary
2.1 Market Overview
2.2 Regional Synopsis
2.3 Competitive Summary
3. Research Methodology
3.1 Top-Down Approach
3.2 Bottom-up Approach
3.3. Data Validation
3.4 Primary Interviews
4. Market Dynamics Impact Analysis
4.1 Market Driving Factors Analysis
4.1.1 Drivers
4.1.2 Restraints
4.1.3 Opportunities
4.1.4 Challenges
4.2 PESTLE Analysis
4.3 Porter’s Five Forces Model
5. Statistical Insights and Trends Reporting
5.1 Price Trends of Raw End-Use Industrys
5.2 Import and Export Data by Region
5.3 Investment and Funding Trends
5.4 Impact of Inflation and Economic Factors
5.5 Automation and Digitalization in Manufacturing
6. Competitive Landscape
6.1 List of Major Companies, By Region
6.2 Market Share Analysis, By Region
6.3 Product Benchmarking
6.3.1 Product specifications and features
6.3.2 Pricing
6.4 Strategic Initiatives
6.4.1 Marketing and promotional activities
6.4.2 Distribution and supply chain strategies
6.4.3 Expansion plans and new product launches
6.4.4 Strategic partnerships and collaborations
6.5 Technological Advancements
6.6 Market Positioning and Branding
7. 3-Hydroxypropionic Acid Market Segmentation, by Source
7.1 Chapter Overview
7.2 Petroleum
7.2.1 Petroleum Market Trends Analysis (2020-2032)
7.2.2 Petroleum Market Size Estimates and Forecasts to 2032 (USD Million)
7.3 Bio-based
7.3.1 Bio-based Market Trends Analysis (2020-2032)
7.3.2 Bio-based Market Size Estimates and Forecasts to 2032 (USD Million)
8. 3-Hydroxypropionic Acid Market Segmentation, by Form
8.1 Chapter Overview
8.2 Powder
8.2.1 Powder Market Trends Analysis (2020-2032)
8.2.2 Powder Market Size Estimates and Forecasts to 2032 (USD Million)
8.3 Liquid
8.3.1 Liquid Market Trends Analysis (2020-2032)
8.3.2 Liquid Market Size Estimates and Forecasts to 2032 (USD Million)
9. 3-Hydroxypropionic Acid Market Segmentation, by Application
9.1 Chapter Overview
9.2 Acrylic Acid
9.2.1 Acrylic Acid Market Trends Analysis (2020-2032)
9.2.2 Acrylic Acid Market Size Estimates and Forecasts to 2032 (USD Million)
9.3 Biodegradable Polymers
9.3.1 Biodegradable Polymers Market Trends Analysis (2020-2032)
9.3.2 Biodegradable Polymers Market Size Estimates and Forecasts to 2032 (USD Million)
9.4 Chemical Intermediates
9.4.1 Chemical Intermediates Market Trends Analysis (2020-2032)
9.4.2 Chemical Intermediates Market Size Estimates and Forecasts to 2032 (USD Million)
9.5 Others
9.5.1 Others Market Trends Analysis (2020-2032)
9.5.2 Others Market Size Estimates and Forecasts to 2032 (USD Million)
10. 3-Hydroxypropionic Acid Market Segmentation, by End-Use Industry
10.1 Chapter Overview
10.2 Pharmaceuticals
10.2.1 Pharmaceuticals Market Trends Analysis (2020-2032)
10.2.2 Pharmaceuticals Market Size Estimates and Forecasts to 2032 (USD Million)
10.3 Agriculture
10.3.1 Agriculture Market Trends Analysis (2020-2032)
10.3.2 Agriculture Market Size Estimates and Forecasts to 2032 (USD Million)
10.4 Chemical
10.4.1 Chemical Market Trends Analysis (2020-2032)
10.4.2 Chemical Market Size Estimates and Forecasts to 2032 (USD Million)
10.5 Packaging
10.5.1 Packaging Market Trends Analysis (2020-2032)
10.5.2 Packaging Market Size Estimates and Forecasts to 2032 (USD Million)
10.6 Others
10.6.1 Others Market Trends Analysis (2020-2032)
10.6.2 Others Market Size Estimates and Forecasts to 2032 (USD Million)
11. Regional Analysis
11.1 Chapter Overview
11.2 North America
11.2.1 Trends Analysis
11.2.2 North America 3-Hydroxypropionic Acid Market Estimates and Forecasts, by Country (2020-2032) (USD Million)
11.2.3 North America 3-Hydroxypropionic Acid Market Estimates and Forecasts, by Source (2020-2032) (USD Million)
11.2.4 North America 3-Hydroxypropionic Acid Market Estimates and Forecasts, by Form (2020-2032) (USD Million)
11.2.5 North America 3-Hydroxypropionic Acid Market Estimates and Forecasts, by Application (2020-2032) (USD Million)
11.2.6 North America 3-Hydroxypropionic Acid Market Estimates and Forecasts, by End-Use Industry (2020-2032) (USD Million)
11.2.7 USA
11.2.7.1 USA 3-Hydroxypropionic Acid Market Estimates and Forecasts, by Source (2020-2032) (USD Million)
11.2.7.2 USA 3-Hydroxypropionic Acid Market Estimates and Forecasts, by Form (2020-2032) (USD Million)
11.2.7.3 USA 3-Hydroxypropionic Acid Market Estimates and Forecasts, by Application (2020-2032) (USD Million)
11.2.7.4 USA 3-Hydroxypropionic Acid Market Estimates and Forecasts, by End-Use Industry (2020-2032) (USD Million)
11.2.8 Canada
11.2.8.1 Canada 3-Hydroxypropionic Acid Market Estimates and Forecasts, by Source (2020-2032) (USD Million)
11.2.8.2 Canada 3-Hydroxypropionic Acid Market Estimates and Forecasts, by Form (2020-2032) (USD Million)
11.2.8.3 Canada 3-Hydroxypropionic Acid Market Estimates and Forecasts, by Application (2020-2032) (USD Million)
11.2.8.4 Canada 3-Hydroxypropionic Acid Market Estimates and Forecasts, by End-Use Industry (2020-2032) (USD Million)
11.2.9 Mexico
11.2.9.1 Mexico 3-Hydroxypropionic Acid Market Estimates and Forecasts, by Source (2020-2032) (USD Million)
11.2.9.2 Mexico 3-Hydroxypropionic Acid Market Estimates and Forecasts, by Form (2020-2032) (USD Million)
11.2.9.3 Mexico 3-Hydroxypropionic Acid Market Estimates and Forecasts, by Application (2020-2032) (USD Million)
11.2.9.4 Mexico 3-Hydroxypropionic Acid Market Estimates and Forecasts, by End-Use Industry (2020-2032) (USD Million)
11.3 Europe
11.3.1 Eastern Europe
11.3.1.1 Trends Analysis
11.3.1.2 Eastern Europe 3-Hydroxypropionic Acid Market Estimates and Forecasts, by Country (2020-2032) (USD Million)
11.3.1.3 Eastern Europe 3-Hydroxypropionic Acid Market Estimates and Forecasts, by Source (2020-2032) (USD Million)
11.3.1.4 Eastern Europe 3-Hydroxypropionic Acid Market Estimates and Forecasts, by Form (2020-2032) (USD Million)
11.3.1.5 Eastern Europe 3-Hydroxypropionic Acid Market Estimates and Forecasts, by Application (2020-2032) (USD Million)
11.3.1.6 Eastern Europe 3-Hydroxypropionic Acid Market Estimates and Forecasts, by End-Use Industry (2020-2032) (USD Million)
11.3.1.7 Poland
11.3.1.7.1 Poland 3-Hydroxypropionic Acid Market Estimates and Forecasts, by Source (2020-2032) (USD Million)
11.3.1.7.2 Poland 3-Hydroxypropionic Acid Market Estimates and Forecasts, by Form (2020-2032) (USD Million)
11.3.1.7.3 Poland 3-Hydroxypropionic Acid Market Estimates and Forecasts, by Application (2020-2032) (USD Million)
11.3.1.7.4 Poland 3-Hydroxypropionic Acid Market Estimates and Forecasts, by End-Use Industry (2020-2032) (USD Million)
11.3.1.8 Romania
11.3.1.8.1 Romania 3-Hydroxypropionic Acid Market Estimates and Forecasts, by Source (2020-2032) (USD Million)
11.3.1.8.2 Romania 3-Hydroxypropionic Acid Market Estimates and Forecasts, by Form (2020-2032) (USD Million)
11.3.1.8.3 Romania 3-Hydroxypropionic Acid Market Estimates and Forecasts, by Application (2020-2032) (USD Million)
11.3.1.8.4 Romania 3-Hydroxypropionic Acid Market Estimates and Forecasts, by End-Use Industry (2020-2032) (USD Million)
11.3.1.9 Hungary
11.3.1.9.1 Hungary 3-Hydroxypropionic Acid Market Estimates and Forecasts, by Source (2020-2032) (USD Million)
11.3.1.9.2 Hungary 3-Hydroxypropionic Acid Market Estimates and Forecasts, by Form (2020-2032) (USD Million)
11.3.1.9.3 Hungary 3-Hydroxypropionic Acid Market Estimates and Forecasts, by Application (2020-2032) (USD Million)
11.3.1.9.4 Hungary 3-Hydroxypropionic Acid Market Estimates and Forecasts, by End-Use Industry (2020-2032) (USD Million)
11.3.1.10 Turkey
11.3.1.10.1 Turkey 3-Hydroxypropionic Acid Market Estimates and Forecasts, by Source (2020-2032) (USD Million)
11.3.1.10.2 Turkey 3-Hydroxypropionic Acid Market Estimates and Forecasts, by Form (2020-2032) (USD Million)
11.3.1.10.3 Turkey 3-Hydroxypropionic Acid Market Estimates and Forecasts, by Application (2020-2032) (USD Million)
11.3.1.10.4 Turkey 3-Hydroxypropionic Acid Market Estimates and Forecasts, by End-Use Industry (2020-2032) (USD Million)
11.3.1.11 Rest of Eastern Europe
11.3.1.11.1 Rest of Eastern Europe 3-Hydroxypropionic Acid Market Estimates and Forecasts, by Source (2020-2032) (USD Million)
11.3.1.11.2 Rest of Eastern Europe 3-Hydroxypropionic Acid Market Estimates and Forecasts, by Form (2020-2032) (USD Million)
11.3.1.11.3 Rest of Eastern Europe 3-Hydroxypropionic Acid Market Estimates and Forecasts, by Application (2020-2032) (USD Million)
11.3.1.11.4 Rest of Eastern Europe 3-Hydroxypropionic Acid Market Estimates and Forecasts, by End-Use Industry (2020-2032) (USD Million)
11.3.2 Western Europe
11.3.2.1 Trends Analysis
11.3.2.2 Western Europe 3-Hydroxypropionic Acid Market Estimates and Forecasts, by Country (2020-2032) (USD Million)
11.3.2.3 Western Europe 3-Hydroxypropionic Acid Market Estimates and Forecasts, by Source (2020-2032) (USD Million)
11.3.2.4 Western Europe 3-Hydroxypropionic Acid Market Estimates and Forecasts, by Form (2020-2032) (USD Million)
11.3.2.5 Western Europe 3-Hydroxypropionic Acid Market Estimates and Forecasts, by Application (2020-2032) (USD Million)
11.3.2.6 Western Europe 3-Hydroxypropionic Acid Market Estimates and Forecasts, by End-Use Industry (2020-2032) (USD Million)
11.3.2.7 Germany
11.3.2.7.1 Germany 3-Hydroxypropionic Acid Market Estimates and Forecasts, by Source (2020-2032) (USD Million)
11.3.2.7.2 Germany 3-Hydroxypropionic Acid Market Estimates and Forecasts, by Form (2020-2032) (USD Million)
11.3.2.7.3 Germany 3-Hydroxypropionic Acid Market Estimates and Forecasts, by Application (2020-2032) (USD Million)
11.3.2.7.4 Germany 3-Hydroxypropionic Acid Market Estimates and Forecasts, by End-Use Industry (2020-2032) (USD Million)
11.3.2.8 France
11.3.2.8.1 France 3-Hydroxypropionic Acid Market Estimates and Forecasts, by Source (2020-2032) (USD Million)
11.3.2.8.2 France 3-Hydroxypropionic Acid Market Estimates and Forecasts, by Form (2020-2032) (USD Million)
11.3.2.8.3 France 3-Hydroxypropionic Acid Market Estimates and Forecasts, by Application (2020-2032) (USD Million)
11.3.2.8.4 France 3-Hydroxypropionic Acid Market Estimates and Forecasts, by End-Use Industry (2020-2032) (USD Million)
11.3.2.9 UK
11.3.2.9.1 UK 3-Hydroxypropionic Acid Market Estimates and Forecasts, by Source (2020-2032) (USD Million)
11.3.2.9.2 UK 3-Hydroxypropionic Acid Market Estimates and Forecasts, by Form (2020-2032) (USD Million)
11.3.2.9.3 UK 3-Hydroxypropionic Acid Market Estimates and Forecasts, by Application (2020-2032) (USD Million)
11.3.2.9.4 UK 3-Hydroxypropionic Acid Market Estimates and Forecasts, by End-Use Industry (2020-2032) (USD Million)
11.3.2.10 Italy
11.3.2.10.1 Italy 3-Hydroxypropionic Acid Market Estimates and Forecasts, by Source (2020-2032) (USD Million)
11.3.2.10.2 Italy 3-Hydroxypropionic Acid Market Estimates and Forecasts, by Form (2020-2032) (USD Million)
11.3.2.10.3 Italy 3-Hydroxypropionic Acid Market Estimates and Forecasts, by Application (2020-2032) (USD Million)
11.3.2.10.4 Italy 3-Hydroxypropionic Acid Market Estimates and Forecasts, by End-Use Industry (2020-2032) (USD Million)
11.3.2.11 Spain
11.3.2.11.1 Spain 3-Hydroxypropionic Acid Market Estimates and Forecasts, by Source (2020-2032) (USD Million)
11.3.2.11.2 Spain 3-Hydroxypropionic Acid Market Estimates and Forecasts, by Form (2020-2032) (USD Million)
11.3.2.11.3 Spain 3-Hydroxypropionic Acid Market Estimates and Forecasts, by Application (2020-2032) (USD Million)
11.3.2.11.4 Spain 3-Hydroxypropionic Acid Market Estimates and Forecasts, by End-Use Industry (2020-2032) (USD Million)
11.3.2.12 Netherlands
11.3.2.12.1 Netherlands 3-Hydroxypropionic Acid Market Estimates and Forecasts, by Source (2020-2032) (USD Million)
11.3.2.12.2 Netherlands 3-Hydroxypropionic Acid Market Estimates and Forecasts, by Form (2020-2032) (USD Million)
11.3.2.12.3 Netherlands 3-Hydroxypropionic Acid Market Estimates and Forecasts, by Application (2020-2032) (USD Million)
11.3.2.12.4 Netherlands 3-Hydroxypropionic Acid Market Estimates and Forecasts, by End-Use Industry (2020-2032) (USD Million)
11.3.2.13 Switzerland
11.3.2.13.1 Switzerland 3-Hydroxypropionic Acid Market Estimates and Forecasts, by Source (2020-2032) (USD Million)
11.3.2.13.2 Switzerland 3-Hydroxypropionic Acid Market Estimates and Forecasts, by Form (2020-2032) (USD Million)
11.3.2.13.3 Switzerland 3-Hydroxypropionic Acid Market Estimates and Forecasts, by Application (2020-2032) (USD Million)
11.3.2.13.4 Switzerland 3-Hydroxypropionic Acid Market Estimates and Forecasts, by End-Use Industry (2020-2032) (USD Million)
11.3.2.14 Austria
11.3.2.14.1 Austria 3-Hydroxypropionic Acid Market Estimates and Forecasts, by Source (2020-2032) (USD Million)
11.3.2.14.2 Austria 3-Hydroxypropionic Acid Market Estimates and Forecasts, by Form (2020-2032) (USD Million)
11.3.2.14.3 Austria 3-Hydroxypropionic Acid Market Estimates and Forecasts, by Application (2020-2032) (USD Million)
11.3.2.14.4 Austria 3-Hydroxypropionic Acid Market Estimates and Forecasts, by End-Use Industry (2020-2032) (USD Million)
11.3.2.15 Rest of Western Europe
11.3.2.15.1 Rest of Western Europe 3-Hydroxypropionic Acid Market Estimates and Forecasts, by Source (2020-2032) (USD Million)
11.3.2.15.2 Rest of Western Europe 3-Hydroxypropionic Acid Market Estimates and Forecasts, by Form (2020-2032) (USD Million)
11.3.2.15.3 Rest of Western Europe 3-Hydroxypropionic Acid Market Estimates and Forecasts, by Application (2020-2032) (USD Million)
11.3.2.15.4 Rest of Western Europe 3-Hydroxypropionic Acid Market Estimates and Forecasts, by End-Use Industry (2020-2032) (USD Million)
11.4 Asia Pacific
11.4.1 Trends Analysis
11.4.2 Asia Pacific 3-Hydroxypropionic Acid Market Estimates and Forecasts, by Country (2020-2032) (USD Million)
11.4.3 Asia Pacific 3-Hydroxypropionic Acid Market Estimates and Forecasts, by Source (2020-2032) (USD Million)
11.4.4 Asia Pacific 3-Hydroxypropionic Acid Market Estimates and Forecasts, by Form (2020-2032) (USD Million)
11.4.5 Asia Pacific 3-Hydroxypropionic Acid Market Estimates and Forecasts, by Application (2020-2032) (USD Million)
11.4.6 Asia Pacific 3-Hydroxypropionic Acid Market Estimates and Forecasts, by End-Use Industry (2020-2032) (USD Million)
11.4.7 China
11.4.7.1 China 3-Hydroxypropionic Acid Market Estimates and Forecasts, by Source (2020-2032) (USD Million)
11.4.7.2 China 3-Hydroxypropionic Acid Market Estimates and Forecasts, by Form (2020-2032) (USD Million)
11.4.7.3 China 3-Hydroxypropionic Acid Market Estimates and Forecasts, by Application (2020-2032) (USD Million)
11.4.7.4 China 3-Hydroxypropionic Acid Market Estimates and Forecasts, by End-Use Industry (2020-2032) (USD Million)
11.4.8 India
11.4.8.1 India 3-Hydroxypropionic Acid Market Estimates and Forecasts, by Source (2020-2032) (USD Million)
11.4.8.2 India 3-Hydroxypropionic Acid Market Estimates and Forecasts, by Form (2020-2032) (USD Million)
11.4.8.3 India 3-Hydroxypropionic Acid Market Estimates and Forecasts, by Application (2020-2032) (USD Million)
11.4.8.4 India 3-Hydroxypropionic Acid Market Estimates and Forecasts, by End-Use Industry (2020-2032) (USD Million)
11.4.9 Japan
11.4.9.1 Japan 3-Hydroxypropionic Acid Market Estimates and Forecasts, by Source (2020-2032) (USD Million)
11.4.9.2 Japan 3-Hydroxypropionic Acid Market Estimates and Forecasts, by Form (2020-2032) (USD Million)
11.4.9.3 Japan 3-Hydroxypropionic Acid Market Estimates and Forecasts, by Application (2020-2032) (USD Million)
11.4.9.4 Japan 3-Hydroxypropionic Acid Market Estimates and Forecasts, by End-Use Industry (2020-2032) (USD Million)
11.4.10 South Korea
11.4.10.1 South Korea 3-Hydroxypropionic Acid Market Estimates and Forecasts, by Source (2020-2032) (USD Million)
11.4.10.2 South Korea 3-Hydroxypropionic Acid Market Estimates and Forecasts, by Form (2020-2032) (USD Million)
11.4.10.3 South Korea 3-Hydroxypropionic Acid Market Estimates and Forecasts, by Application (2020-2032) (USD Million)
11.4.10.4 South Korea 3-Hydroxypropionic Acid Market Estimates and Forecasts, by End-Use Industry (2020-2032) (USD Million)
11.4.11 Vietnam
11.4.11.1 Vietnam 3-Hydroxypropionic Acid Market Estimates and Forecasts, by Source (2020-2032) (USD Million)
11.4.11.2 Vietnam 3-Hydroxypropionic Acid Market Estimates and Forecasts, by Form (2020-2032) (USD Million)
11.4.11.3 Vietnam 3-Hydroxypropionic Acid Market Estimates and Forecasts, by Application (2020-2032) (USD Million)
11.4.11.4 Vietnam 3-Hydroxypropionic Acid Market Estimates and Forecasts, by End-Use Industry (2020-2032) (USD Million)
11.4.12 Singapore
11.4.12.1 Singapore 3-Hydroxypropionic Acid Market Estimates and Forecasts, by Source (2020-2032) (USD Million)
11.4.12.2 Singapore 3-Hydroxypropionic Acid Market Estimates and Forecasts, by Form (2020-2032) (USD Million)
11.4.12.3 Singapore 3-Hydroxypropionic Acid Market Estimates and Forecasts, by Application (2020-2032) (USD Million)
11.4.12.4 Singapore 3-Hydroxypropionic Acid Market Estimates and Forecasts, by End-Use Industry (2020-2032) (USD Million)
11.4.13 Australia
11.4.13.1 Australia 3-Hydroxypropionic Acid Market Estimates and Forecasts, by Source (2020-2032) (USD Million)
11.4.13.2 Australia 3-Hydroxypropionic Acid Market Estimates and Forecasts, by Form (2020-2032) (USD Million)
11.4.13.3 Australia 3-Hydroxypropionic Acid Market Estimates and Forecasts, by Application (2020-2032) (USD Million)
11.4.13.4 Australia 3-Hydroxypropionic Acid Market Estimates and Forecasts, by End-Use Industry (2020-2032) (USD Million)
11.4.14 Rest of Asia Pacific
11.4.14.1 Rest of Asia Pacific 3-Hydroxypropionic Acid Market Estimates and Forecasts, by Source (2020-2032) (USD Million)
11.4.14.2 Rest of Asia Pacific 3-Hydroxypropionic Acid Market Estimates and Forecasts, by Form (2020-2032) (USD Million)
11.4.14.3 Rest of Asia Pacific 3-Hydroxypropionic Acid Market Estimates and Forecasts, by Application (2020-2032) (USD Million)
11.4.14.4 Rest of Asia Pacific 3-Hydroxypropionic Acid Market Estimates and Forecasts, by End-Use Industry (2020-2032) (USD Million)
11.5 Middle East and Africa
11.5.1 Middle East
11.5.1.1 Trends Analysis
11.5.1.2 Middle East 3-Hydroxypropionic Acid Market Estimates and Forecasts, by Country (2020-2032) (USD Million)
11.5.1.3 Middle East 3-Hydroxypropionic Acid Market Estimates and Forecasts, by Source (2020-2032) (USD Million)
11.5.1.4 Middle East 3-Hydroxypropionic Acid Market Estimates and Forecasts, by Form (2020-2032) (USD Million)
11.5.1.5 Middle East 3-Hydroxypropionic Acid Market Estimates and Forecasts, by Application (2020-2032) (USD Million)
11.5.1.6 Middle East 3-Hydroxypropionic Acid Market Estimates and Forecasts, by End-Use Industry (2020-2032) (USD Million)
11.5.1.7 UAE
11.5.1.7.1 UAE 3-Hydroxypropionic Acid Market Estimates and Forecasts, by Source (2020-2032) (USD Million)
11.5.1.7.2 UAE 3-Hydroxypropionic Acid Market Estimates and Forecasts, by Form (2020-2032) (USD Million)
11.5.1.7.3 UAE 3-Hydroxypropionic Acid Market Estimates and Forecasts, by Application (2020-2032) (USD Million)
11.5.1.7.4 UAE 3-Hydroxypropionic Acid Market Estimates and Forecasts, by End-Use Industry (2020-2032) (USD Million)
11.5.1.8 Egypt
11.5.1.8.1 Egypt 3-Hydroxypropionic Acid Market Estimates and Forecasts, by Source (2020-2032) (USD Million)
11.5.1.8.2 Egypt 3-Hydroxypropionic Acid Market Estimates and Forecasts, by Form (2020-2032) (USD Million)
11.5.1.8.3 Egypt 3-Hydroxypropionic Acid Market Estimates and Forecasts, by Application (2020-2032) (USD Million)
11.5.1.8.4 Egypt 3-Hydroxypropionic Acid Market Estimates and Forecasts, by End-Use Industry (2020-2032) (USD Million)
11.5.1.9 Saudi Arabia
11.5.1.9.1 Saudi Arabia 3-Hydroxypropionic Acid Market Estimates and Forecasts, by Source (2020-2032) (USD Million)
11.5.1.9.2 Saudi Arabia 3-Hydroxypropionic Acid Market Estimates and Forecasts, by Form (2020-2032) (USD Million)
11.5.1.9.3 Saudi Arabia 3-Hydroxypropionic Acid Market Estimates and Forecasts, by Application (2020-2032) (USD Million)
11.5.1.9.4 Saudi Arabia 3-Hydroxypropionic Acid Market Estimates and Forecasts, by End-Use Industry (2020-2032) (USD Million)
11.5.1.10 Qatar
11.5.1.10.1 Qatar 3-Hydroxypropionic Acid Market Estimates and Forecasts, by Source (2020-2032) (USD Million)
11.5.1.10.2 Qatar 3-Hydroxypropionic Acid Market Estimates and Forecasts, by Form (2020-2032) (USD Million)
11.5.1.10.3 Qatar 3-Hydroxypropionic Acid Market Estimates and Forecasts, by Application (2020-2032) (USD Million)
11.5.1.10.4 Qatar 3-Hydroxypropionic Acid Market Estimates and Forecasts, by End-Use Industry (2020-2032) (USD Million)
11.5.1.11 Rest of Middle East
11.5.1.11.1 Rest of Middle East 3-Hydroxypropionic Acid Market Estimates and Forecasts, by Source (2020-2032) (USD Million)
11.5.1.11.2 Rest of Middle East 3-Hydroxypropionic Acid Market Estimates and Forecasts, by Form (2020-2032) (USD Million)
11.5.1.11.3 Rest of Middle East 3-Hydroxypropionic Acid Market Estimates and Forecasts, by Application (2020-2032) (USD Million)
11.5.1.11.4 Rest of Middle East 3-Hydroxypropionic Acid Market Estimates and Forecasts, by End-Use Industry (2020-2032) (USD Million)
11.5.2 Africa
11.5.2.1 Trends Analysis
11.5.2.2 Africa 3-Hydroxypropionic Acid Market Estimates and Forecasts, by Country (2020-2032) (USD Million)
11.5.2.3 Africa 3-Hydroxypropionic Acid Market Estimates and Forecasts, by Source (2020-2032) (USD Million)
11.5.2.4 Africa 3-Hydroxypropionic Acid Market Estimates and Forecasts, by Form (2020-2032) (USD Million)
11.5.2.5 Africa 3-Hydroxypropionic Acid Market Estimates and Forecasts, by Application (2020-2032) (USD Million)
11.5.2.6 Africa 3-Hydroxypropionic Acid Market Estimates and Forecasts, by End-Use Industry (2020-2032) (USD Million)
11.5.2.7 South Africa
11.5.2.7.1 South Africa 3-Hydroxypropionic Acid Market Estimates and Forecasts, by Source (2020-2032) (USD Million)
11.5.2.7.2 South Africa 3-Hydroxypropionic Acid Market Estimates and Forecasts, by Form (2020-2032) (USD Million)
11.5.2.7.3 South Africa 3-Hydroxypropionic Acid Market Estimates and Forecasts, by Application (2020-2032) (USD Million)
11.5.2.7.4 South Africa 3-Hydroxypropionic Acid Market Estimates and Forecasts, by End-Use Industry (2020-2032) (USD Million)
11.5.2.8 Nigeria
11.5.2.8.1 Nigeria 3-Hydroxypropionic Acid Market Estimates and Forecasts, by Source (2020-2032) (USD Million)
11.5.2.8.2 Nigeria 3-Hydroxypropionic Acid Market Estimates and Forecasts, by Form (2020-2032) (USD Million)
11.5.2.8.3 Nigeria 3-Hydroxypropionic Acid Market Estimates and Forecasts, by Application (2020-2032) (USD Million)
11.5.2.8.4 Nigeria 3-Hydroxypropionic Acid Market Estimates and Forecasts, by End-Use Industry (2020-2032) (USD Million)
11.5.2.9 Rest of Africa
11.5.2.9.1 Rest of Africa 3-Hydroxypropionic Acid Market Estimates and Forecasts, by Source (2020-2032) (USD Million)
11.5.2.9.2 Rest of Africa 3-Hydroxypropionic Acid Market Estimates and Forecasts, by Form (2020-2032) (USD Million)
11.5.2.9.3 Rest of Africa 3-Hydroxypropionic Acid Market Estimates and Forecasts, by Application (2020-2032) (USD Million)
11.5.2.9.4 Rest of Africa 3-Hydroxypropionic Acid Market Estimates and Forecasts, by End-Use Industry (2020-2032) (USD Million)
11.6 Latin America
11.6.1 Trends Analysis
11.6.2 Latin America 3-Hydroxypropionic Acid Market Estimates and Forecasts, by Country (2020-2032) (USD Million)
11.6.3 Latin America 3-Hydroxypropionic Acid Market Estimates and Forecasts, by Source (2020-2032) (USD Million)
11.6.4 Latin America 3-Hydroxypropionic Acid Market Estimates and Forecasts, by Form (2020-2032) (USD Million)
11.6.5 Latin America 3-Hydroxypropionic Acid Market Estimates and Forecasts, by Application (2020-2032) (USD Million)
11.6.6 Latin America 3-Hydroxypropionic Acid Market Estimates and Forecasts, by End-Use Industry (2020-2032) (USD Million)
11.6.7 Brazil
11.6.7.1 Brazil 3-Hydroxypropionic Acid Market Estimates and Forecasts, by Source (2020-2032) (USD Million)
11.6.7.2 Brazil 3-Hydroxypropionic Acid Market Estimates and Forecasts, by Form (2020-2032) (USD Million)
11.6.7.3 Brazil 3-Hydroxypropionic Acid Market Estimates and Forecasts, by Application (2020-2032) (USD Million)
11.6.7.4 Brazil 3-Hydroxypropionic Acid Market Estimates and Forecasts, by End-Use Industry (2020-2032) (USD Million)
11.6.8 Argentina
11.6.8.1 Argentina 3-Hydroxypropionic Acid Market Estimates and Forecasts, by Source (2020-2032) (USD Million)
11.6.8.2 Argentina 3-Hydroxypropionic Acid Market Estimates and Forecasts, by Form (2020-2032) (USD Million)
11.6.8.3 Argentina 3-Hydroxypropionic Acid Market Estimates and Forecasts, by Application (2020-2032) (USD Million)
11.6.8.4 Argentina 3-Hydroxypropionic Acid Market Estimates and Forecasts, by End-Use Industry (2020-2032) (USD Million)
11.6.9 Colombia
11.6.9.1 Colombia 3-Hydroxypropionic Acid Market Estimates and Forecasts, by Source (2020-2032) (USD Million)
11.6.9.2 Colombia 3-Hydroxypropionic Acid Market Estimates and Forecasts, by Form (2020-2032) (USD Million)
11.6.9.3 Colombia 3-Hydroxypropionic Acid Market Estimates and Forecasts, by Application (2020-2032) (USD Million)
11.6.9.4 Colombia 3-Hydroxypropionic Acid Market Estimates and Forecasts, by End-Use Industry (2020-2032) (USD Million)
11.6.10 Rest of Latin America
11.6.10.1 Rest of Latin America 3-Hydroxypropionic Acid Market Estimates and Forecasts, by Source (2020-2032) (USD Million)
11.6.10.2 Rest of Latin America 3-Hydroxypropionic Acid Market Estimates and Forecasts, by Form (2020-2032) (USD Million)
11.6.10.3 Rest of Latin America 3-Hydroxypropionic Acid Market Estimates and Forecasts, by Application (2020-2032) (USD Million)
11.6.10.4 Rest of Latin America 3-Hydroxypropionic Acid Market Estimates and Forecasts, by End-Use Industry (2020-2032) (USD Million)
12. Company Profiles
12.1 Beijing PhaBuilder Biotechnology Co., Ltd.
12.1.1 Company Overview
12.1.2 Financial
12.1.3 Products/ Services Offered
12.1.4 SWOT Analysis
12.2 Cargill, Incorporated
12.2.1 Company Overview
12.2.2 Financial
12.2.3 Products/ Services Offered
12.2.4 SWOT Analysis
12.3 LG Chem
12.3.1 Company Overview
12.3.2 Financial
12.3.3 Products/ Services Offered
12.3.4 SWOT Analysis
12.4 Merck KGaA
12.4.1 Company Overview
12.4.2 Financial
12.4.3 Products/ Services Offered
12.4.4 SWOT Analysis
12.5 Thermo Fisher Scientific Inc.
12.5.1 Company Overview
12.5.2 Financial
12.5.3 Products/ Services Offered
12.5.4 SWOT Analysis
12.6 Tokyo Chemical Industry Co., Ltd. (TCI)
12.6.1 Company Overview
12.6.2 Financial
12.6.3 Products/ Services Offered
12.6.4 SWOT Analysis
12.7 Zhengzhou Alfa Chemical Co., Ltd.
12.7.1 Company Overview
12.7.2 Financial
12.7.3 Products/ Services Offered
12.7.4 SWOT Analysis
12.8 Fluoropharm Co., Ltd.
12.8.1 Company Overview
12.8.2 Financial
12.8.3 Products/ Services Offered
12.8.4 SWOT Analysis
12.9 Spectrum Chemical
12.9.1 Company Overview
12.9.2 Financial
12.9.3 Products/ Services Offered
12.9.4 SWOT Analysis
12.10 Oakwood Products Inc.
12.10.1 Company Overview
12.10.2 Financial
12.10.3 Products/ Services Offered
12.10.4 SWOT Analysis
13. Use Cases and Best Practices
14. Conclusion
An accurate research report requires proper strategizing as well as implementation. There are multiple factors involved in the completion of good and accurate research report and selecting the best methodology to compete the research is the toughest part. Since the research reports we provide play a crucial role in any company’s decision-making process, therefore we at SNS Insider always believe that we should choose the best method which gives us results closer to reality. This allows us to reach at a stage wherein we can provide our clients best and accurate investment to output ratio.
Each report that we prepare takes a timeframe of 350-400 business hours for production. Starting from the selection of titles through a couple of in-depth brain storming session to the final QC process before uploading our titles on our website we dedicate around 350 working hours. The titles are selected based on their current market cap and the foreseen CAGR and growth.
The 5 steps process:
Step 1: Secondary Research:
Secondary Research or Desk Research is as the name suggests is a research process wherein, we collect data through the readily available information. In this process we use various paid and unpaid databases which our team has access to and gather data through the same. This includes examining of listed companies’ annual reports, Journals, SEC filling etc. Apart from this our team has access to various associations across the globe across different industries. Lastly, we have exchange relationships with various university as well as individual libraries.
Step 2: Primary Research
When we talk about primary research, it is a type of study in which the researchers collect relevant data samples directly, rather than relying on previously collected data. This type of research is focused on gaining content specific facts that can be sued to solve specific problems. Since the collected data is fresh and first hand therefore it makes the study more accurate and genuine.
We at SNS Insider have divided Primary Research into 2 parts.
Part 1 wherein we interview the KOLs of major players as well as the upcoming ones across various geographic regions. This allows us to have their view over the market scenario and acts as an important tool to come closer to the accurate market numbers. As many as 45 paid and unpaid primary interviews are taken from both the demand and supply side of the industry to make sure we land at an accurate judgement and analysis of the market.
This step involves the triangulation of data wherein our team analyses the interview transcripts, online survey responses and observation of on filed participants. The below mentioned chart should give a better understanding of the part 1 of the primary interview.
Part 2: In this part of primary research the data collected via secondary research and the part 1 of the primary research is validated with the interviews from individual consultants and subject matter experts.
Consultants are those set of people who have at least 12 years of experience and expertise within the industry whereas Subject Matter Experts are those with at least 15 years of experience behind their back within the same space. The data with the help of two main processes i.e., FGDs (Focused Group Discussions) and IDs (Individual Discussions). This gives us a 3rd party nonbiased primary view of the market scenario making it a more dependable one while collation of the data pointers.
Step 3: Data Bank Validation
Once all the information is collected via primary and secondary sources, we run that information for data validation. At our intelligence centre our research heads track a lot of information related to the market which includes the quarterly reports, the daily stock prices, and other relevant information. Our data bank server gets updated every fortnight and that is how the information which we collected using our primary and secondary information is revalidated in real time.
Step 4: QA/QC Process
After all the data collection and validation our team does a final level of quality check and quality assurance to get rid of any unwanted or undesired mistakes. This might include but not limited to getting rid of the any typos, duplication of numbers or missing of any important information. The people involved in this process include technical content writers, research heads and graphics people. Once this process is completed the title gets uploader on our platform for our clients to read it.
Step 5: Final QC/QA Process:
This is the last process and comes when the client has ordered the study. In this process a final QA/QC is done before the study is emailed to the client. Since we believe in giving our clients a good experience of our research studies, therefore, to make sure that we do not lack at our end in any way humanly possible we do a final round of quality check and then dispatch the study to the client.
Key Segments:
By Source
Petroleum
Bio-based
By Form
Powder
Liquid
By Application
Acrylic Acid
Biodegradable Polymers
Chemical Intermediates
Others
By End-Use Industry
Pharmaceuticals
Agriculture
Chemical
Packaging
Others
Request for Segment Customization as per your Business Requirement: Segment Customization Request
Regional Coverage:
North America
US
Canada
Mexico
Europe
Eastern Europe
Poland
Romania
Hungary
Turkey
Rest of Eastern Europe
Western Europe
Germany
France
UK
Italy
Spain
Netherlands
Switzerland
Austria
Rest of Western Europe
Asia Pacific
China
India
Japan
South Korea
Vietnam
Singapore
Australia
Rest of Asia Pacific
Middle East & Africa
Middle East
UAE
Egypt
Saudi Arabia
Qatar
Rest of Middle East
Africa
Nigeria
South Africa
Rest of Africa
Latin America
Brazil
Argentina
Colombia
Rest of Latin America
Request for Country Level Research Report: Country Level Customization Request
Available Customization
With the given market data, SNS Insider offers customization as per the company’s specific needs. The following customization options are available for the report:
Detailed Volume Analysis
Criss-Cross segment analysis (e.g. Product X Application)
Competitive Product Benchmarking
Geographic Analysis
Additional countries in any of the regions
Customized Data Representation
Detailed analysis and profiling of additional market players
Pharmaceutical Fine Chemicals Market was valued at USD 138.3 Bn in 2023 and is expected to reach USD 255.5 Bn by 2032, growing at a CAGR of 7.1% from 2024-2032.
The Foam Glass Market Size was valued at USD 2.0 billion in 2023 and is expected to reach USD 3.3 billion by 2032 and grow at a CAGR of 5.6% over the forecast period 2024-2032.
Explore the Fatty Acid Ester Market, including its applications in personal care, pharmaceuticals, and food. Learn about the rising demand for bio-based esters, eco-friendly products, and how fatty acid esters are used in cosmetics, lubricants, and more.
The Offshore Lubricants Market Size was valued USD 170.1 Billion in 2023 and will reach USD 236.4 billion by 2032, growing at a CAGR of 3.8% by 2024-2032.
The Point of Use Water Treatment Systems Market Size was valued at USD 29.48 billion in 2023, and is expected to reach USD 63.50 billion by 2032, and grow at a CAGR of 8.90% over the forecast period 2024-2032.
The Vanillic Acid Market size was valued at USD 19.82 billion in 2023 and is expected to grow to USD 24.52 billion by 2032 and grow at a CAGR of 2.39% over the forecast period of 2024-2032.
Hi! Click one of our member below to chat on Phone