
The Spinal Muscular Atrophy Treatment Market size was valued at USD 4.27 billion in 2024 and is expected to reach USD 16.28 billion by 2032, growing at a CAGR of 17.87% over the forecast period of 2025-2032.
The global spinal muscular atrophy treatment market is growing rapidly, with factors such as growing awareness, early genetic diagnosis, and the introduction of advanced therapies such as antisense and gene therapy. Growing adoption from health organizations, along with increasing baby screening projects, is promoting early treatment. Continued growth can be expected with pharmaceutical innovation and increasing patient population, especially in developed areas. Furthermore, strategic partnerships between biotech companies are expanding access to treatments, fostering more market progress.
The U.S. spinal muscular atrophy treatment market size was valued at USD 1.33 billion in 2024 and is expected to reach USD 4.96 billion by 2032, growing at a CAGR of 17.49% over the forecast period of 2025-2032.
The U.S. is the largest North American spinal muscular atrophy treatment market growth due to wide-ranging newborn screening programs that are implemented for most of the births happening in the country. Additionally, the U.S. has experienced early and broad access to important therapies such as Spinraza and Zolgensma due to the streamlined FDA approval. Such leadership is reinforced by robust healthcare infrastructure, patient advocacy groups, and reimbursement that largely support the U.S. as a hub of innovation and adoption for treating SMA.
Drivers
Spinal Muscular Atrophy is one of the commonest rare genetic disorders that affects infants and young children. Ever-rising incidence of SMA worldwide is a significant factor fueling the demand for novel treatment alternatives. In the US, Germany, and Japan, where more newborn screening programs are being established, early diagnosis is also increasing. The early detection of cases of SMA leads to early therapeutic intervention, which in turn improves survival and functional outcomes. All the above developments enhance the overall treatment market.
As per NCBI, as of December 2023 and at the beginning of 2024, 31 countries had newborn screening (NBS) in place for spinal muscular atrophy (SMA), and both numbers had increased to 33. These projects have collectively diagnosed about 1,176 cases of SMA.
Moreover, the availability of disease-modifying therapeutics has greatly enhanced. According to Cure SMA, newborn screening for SMA had become fully implemented in all states by 2024, allowing for near-universal early identification of the disorder in babies.
Ultimately, however, advances in genetic medicine have dramatically shifted the SMA therapeutic landscape. Gene swapping treatments like Zolgensma (onasemnogene abeparvovec) address the source of the problem head-on: It supplies the body with a working version of the SMN1 gene, and it has the potential to be administered just once. Likewise, SMN2 splicing modifiers such as Spinraza (nusinersen) and Evrysdi (risdiplam) can boost SMN protein production. These treatments have achieved dramatic success in clinical trials, reflecting improvements in motor function and increased life span in SMA patients. Thanks to their efficacy and innovation, these treatments are one of the most important growth factors for the market.
June 2025, a next-generation antisense oligonucleotide (ASO) developed by Biogen, salanersen, has promising Phase 1 results, with early attainment of developmental milestones in 7 of 10 participants and a 70% reduction in neurofilament levels. The promising results have paved the way for the drug to move forward into phase 3 trials.
Restraint
The ultra-high price of the treatments is one of the major market constraints in the SMA treatment market. Therapies such as Zolgensma, Spinraza, and Evrysdi can cost hundreds of thousands to millions of dollars a patient. For instance, the gene therapy Zolgensma is priced at more than USD 2 million for a single treatment, making it one of the most expensive drugs in the world. The high costs of these meds can cost families, healthcare systems, and insurance companies a great deal of money. For the majority of people living in low- and middle-income countries, the cost simply makes these treatments completely unattainable, resulting in a gross inequity of access and outcomes. Even in industrialized areas, insurers may refuse or delay coverage, creating impediments to access regardless of clinical need. This cost barrier is inhibiting broader access to treatment and the expansion of the overall market.
By Disease Type
Type 1 segment held the largest share of the spinal muscular atrophy treatment market in 2024 with 46.2% market share due to this form of disease has an early onset and is severe. Type 1 SMA is evident in infancy and is usually the most frequent and severe, and may need a prompt diagnosis and vigorous therapy. The presence of approved treatments such as Spinraza and Zolgensma, and emerging awareness and inclusion by newborn screening programs, has had a substantial impact on treatment rates and market demand for this condition.
The Type 0 segment is anticipated to record rapid growth throughout the forecast period as a result of higher survival rates after early detection and management. The progress in gene therapy and prenatal diagnosis, together with increased clinical research activities, has contributed to a more accessible treatment offer for this neglected population. Growing preference for prenatal screening and maternal-fetal care, particularly in developed health care systems, is driving the segment’s rapid growth.
By Treatment Modality
The SMN2 splicing modifiers segment dominated the spinal muscular atrophy treatment market share in 2024 due to the rising preference for oral therapies such as Evrysdi (risdiplam) with an easy administration process and applicable for a large pool of the patient population across all types of SMA. As compared to gene therapy, SMN2 splicing modifiers are also less invasive, more broadly available, and offer attractive reimbursement dynamics, so it is a preferred option in emerging healthcare markets. Furthermore, the artery closure devices segment is projected to expand at a fast pace, owing to the ongoing research and increasing number of drug approvals in this sector.
The gene replacement therapy segment is anticipated to register a faster growth over the forecast years due to the launch of Zolgensma, a one-time gene replacement therapy that targets the genetic root cause of SMA and its huge success. The therapy, with a long-lasting effect that prevents the need for chronic dosing and that offers promise in patients with Type 1 SMA, is now broadly accepted by patients, regulatory authorities, and clinicians. Gene replacement therapy has also gained prominence in the market with the evolving trend of long-acting, efficacious, and less-interfering interventions among patients, as well as physicians and caregivers.
By Route of Administration
The intrathecal segment dominated the spinal muscular atrophy treatment market in 2024 with a 52.36% market share, as the preferred use of Spinraza (nusinersen) is through the intrathecal route by an intrathecal injection in the cerebrospinal fluid. This approach facilitates the delivery of drugs to the CNS, the site of motor neuron degeneration. While it is the most invasive, it is still the standard of care for the majority of SMA patients — particularly those with Type 1 and Type 2 — and has been around for the longest time and adopted by the clinical community since its previous FDA approval.
The oral administration segment is expected to be the fastest-growing during the forecast period due to the adoption of Evrysdi (risdiplam). This orally available SMN2 splicing modifier is more patient-friendly for all ages and obviates the infusions/hospital-based treatments. It's at-home dosing convenience, particularly for paediatric and adult patients, has greatly enhanced treatment accessibility and compliance - both in developed and emerging markets.
By Age Group
The pediatrics (6 months–12 years) segment held the dominant share in the spinal muscular atrophy treatment market analysis in 2024, with a 63.19%, due to a higher number of diagnosed patients belonging to this age group who are currently receiving treatments. These patients are also likely to gain early diagnosis from newborn screening programs and have access to long-term treatment options, which are long-term maintenance therapy, such as Spinraza or Evrysdi, that would necessitate a lifelong duration of treatment. Further, the existing safety and efficacy evidence of medication treatments in this age range has resulted in increased use and payor preferences to support and perpetuate its dominance.
The neonates (0–6 months) segment is anticipated to register the highest CAGR over the forecast period due to the rise in adoption of newborn screening and early entry of gene replacement therapies such as Zolgensma. Preliminary clinical trial data have demonstrated that treating SMA presymptomatically or at early symptom onset is associated with improved survival and better motor function outcomes, leading to a shift in clinical practice for earlier treatment. With more communities of interest and health systems advocating for early diagnosis and management, this age cohort is likely to lead to advances in therapy of SMA.
By Distribution Channel
The hospital pharmacies segment dominated the spinal muscular atrophy treatment market share with 48.4% in 2024, since SMA therapies are complex and costly and require special handling, administration, and monitoring that is availed in a hospital. Treatments such as Zolgensma that need to be infused once (as a gene therapy), or intrathecal injections such as Spinraza should be given in-patient or in a specialized outpatient setting for safety and compliance. Moreover, hospitals often control overall treatment plans for pediatric SMA patients, integrating diagnosis, treatment, and monitoring in a single healthcare setting.
The online & retail pharmacies segment is expected to register the fastest CAGR during the forecast period on account of the rising uptake of oral SMA drugs, such as Evrysdi, which can be administered at home by the patients. The ease of home delivery, integration into telemedicine, and better patient compliance drive this trend. With an increasing number of patients looking for long-term, minimally invasive treatment solutions, and as digital pharmacy infrastructures develop across global healthcare networks, this channel is forecast to see a surge in demand and accessibility.
North America’s spinal muscular atrophy treatment market holds the highest market share in 2024, with 41.1% market share, due to the region having well-established medical facilities, sophisticated diagnostic tools, and high awareness about genetic diseases. In the US and Canada, universal newborn screening programmes allow for prompt diagnosis followed by timely intervention. This is further accelerated by the presence of large pharmaceutical companies and early regulatory approvals, such as that for Spinraza and Zolgensma through the FDA, and Evrysdi through the EMA, and early access to novel SMA treatments. Favorable reimbursement policies and the presence of strong patient advocacy organisations also play a role in strengthening the region’s position as a leader for SMA treatment adoption and development.
Asia Pacific is projected to be the fastest-growing region in the spinal muscular atrophy treatment market with around 18.46% CAGR over the forecast period, owing to increasing access to healthcare, growing awareness about rare diseases, and increased initiatives of the government to aid orphan drug development. Governments, including those in China, India, and Japan, are allocating resources to establish neonatal screening and genetic testing infrastructure, leading to an increase in clinical cases of SMA. Also driving adoption of innovative therapies are enhanced cooperation between local and multinational biopharma companies and a rising patient count.
The spinal muscular atrophy treatment market trends in Europe are witnessing growth on account of robust healthcare facilities, national newborn screening programs, and a favorable reimbursement landscape for rare disease medications. This momentum is being led by countries such as Germany, France, and the UK, which have already pledged action through early diagnosis programs and access to innovative treatments such as Spinraza and Zolgensma. Furthermore, collaborative initiatives involving the European Union (EU), such as joint research projects and funding programs, are helping to ensure a higher availability of treatments and continuing innovation in SMA care across the continent.
The spinal muscular atrophy treatment market in Latin America and the Middle East & Africa (MEA) is also projected to expand at a moderate rate. Latin American countries have been striving to increase the availability of SMA therapies and enhance the diagnosis awareness, but economic limitations and lack of infrastructure are hindering market growth. In the MEA, while there are countries such as the UAE and Saudi Arabia where diagnostics are advancing and rare disease treatments are being reimbursed, there is limited widespread adoption due to inadequate healthcare infrastructure, for instance, low/newborn screening coverage. The two areas are on a trajectory of gradual improvement, with increasing patient identification and conducive policies helping to drive incremental advances, though there are still affordability and access challenges.
Spinal muscular atrophy treatment market companies are Biogen Inc., Novartis AG, Roche Holding AG, PTC Therapeutics Inc., Ionis Pharmaceuticals Inc., REGENXBIO Inc., Scholar Rock Holding Corporation, Astellas Pharma Inc., AveXis Inc., Cure SMA, Audentes Therapeutics, Biohaven Ltd., Catalyst Pharmaceuticals Inc., Marinus Pharmaceuticals Inc., Sarepta Therapeutics Inc., Pfizer Inc., Ultragenyx Pharmaceutical Inc., Voyager Therapeutics Inc., NantKwest, Cytokinetics Inc., and other players.
June 2025 – Biogen Inc. reported topline data from its Phase 1 clinical trial of salanersen (BIIB115/ION306), an antisense oligonucleotide (ASO) designed to treat spinal muscular atrophy (SMA). Structured with greater potency, Salanersen utilizes the same mechanism of action as Spinraza (nusinersen) and is poised for once-a-year dosing with high efficacy.
| Report Attributes | Details |
|---|---|
| Market Size in 2024 | USD 4.27 Billion |
| Market Size by 2032 | USD 16.28 Billion |
| CAGR | CAGR of 17.87% From 2025 to 2032 |
| Base Year | 2024 |
| Forecast Period | 2025-2032 |
| Historical Data | 2021-2023 |
| Report Scope & Coverage | Market Size, Segments Analysis, Competitive Landscape, Regional Analysis, DROC & SWOT Analysis, Forecast Outlook |
| Key Segments | • By Disease Type (Type 0, Type 1, Type 2, Type 3, Type 4) • By Treatment Modality (Gene Replacement Therapy, SMN2 Splicing Modifiers, Antisense-Oligonucleotide Therapy, Muscle-Directed / Myostatin Inhibitors, Supportive & Assistive Therapies) • By Route of Administration (Oral, Intrathecal, Intravenous) • By Age Group (Neonates [0–6 mo], Pediatrics [6 mo–12 y], Adolescents [12–18 y], Adults [>18 y]) • By Distribution Channel (Hospital Pharmacies, Specialty Clinics, Online & Retail Pharmacies) |
| Regional Analysis/Coverage | North America (US, Canada, Mexico), Europe (Germany, France, UK, Italy, Spain, Poland, Turkey, Rest of Europe), Asia Pacific (China, India, Japan, South Korea, Singapore, Australia, Rest of Asia Pacific), Middle East & Africa (UAE, Saudi Arabia, Qatar, South Africa, Rest of Middle East & Africa), Latin America (Brazil, Argentina, Rest of Latin America) |
| Company Profiles | Spinal muscular atrophy treatment market companies are Biogen Inc., Novartis AG, Roche Holding AG, PTC Therapeutics Inc., Ionis Pharmaceuticals Inc., REGENXBIO Inc., Scholar Rock Holding Corporation, Astellas Pharma Inc., AveXis Inc., Cure SMA, Audentes Therapeutics, Biohaven Ltd., Catalyst Pharmaceuticals Inc., Marinus Pharmaceuticals Inc., Sarepta Therapeutics Inc., Pfizer Inc., Ultragenyx Pharmaceutical Inc., Voyager Therapeutics Inc., NantKwest, Cytokinetics Inc., and other players. |
Ans: The Spinal Muscular Atrophy Treatment Market is expected to grow at a CAGR of 17.87% from 2025 to 2032.
Ans: The Spinal Muscular Atrophy Treatment Market was USD 4.27 billion in 2024 and is expected to reach USD 16.28 billion by 2032.
Ans: The increasing incidence Rate of Spinal Muscular Atrophy Is Boosting the Growth of the Market.
Ans: The “SMN2 Splicing Modifiers” segment dominated the Spinal Muscular Atrophy Treatment Market.
Ans: North America dominated the Spinal Muscular Atrophy Treatment Market in 2024.
Table Of Contents
1. Introduction
1.1 Market Definition & Scope
1.2 Research Assumptions & Abbreviations
1.3 Research Methodology
2. Executive Summary
2.1 Market Snapshot
2.2 Market Absolute $ Opportunity Assessment & Y-o-Y Analysis, 2021–2032
2.3 Market Size & Forecast, By Segmentation, 2021–2032
2.3.1 Market Size By Disease Type
2.3.2 Market Size By Treatment Modality
2.3.2 Market Size By Route of Administration
2.3.2 Market Size By Age Group
2.3.2 Market Size By Distribution Channel
2.4 Market Share & Bps Analysis By Region, 2024
2.5 Industry Growth Scenarios – Conservative, Likely & Optimistic
2.6 Industry CxO’s Perspective
3. Market Overview
3.1 Market Dynamics
3.1.1 Drivers
3.1.2 Restraints
3.1.3 Opportunities
3.1.4 Key Market Trends
3.2 Industry PESTLE Analysis
3.3 Key Industry Forces (Porter’s) Impacting Market Growth
3.4 Industry Supply Chain Analysis
3.4.1 Raw Material Suppliers
3.4.2 Manufacturers
3.4.3 Distributors/Suppliers
3.4.4 Customers/End-Users
3.5 Industry Life Cycle Assessment
3.6 Parent Market Overview
3.7 Market Risk Assessment
4. Statistical Insights & Trends Reporting
4.1 Incidence and Prevalence (2024)
4.1.1 Global incidence of SMA
4.1.2 Regional variations in prevalence
4.1.3 Impact of newborn screening on early diagnosis
4.2 Treatment Uptake Trends, by Region (2024)
4.2.1 North America – High adoption of all major SMA therapies
4.2.2 Europe – Rise in oral splicing modifier usage
4.2.3 Asia Pacific – Expanding access and adoption trends
4.3 Patient Pool & Therapy Coverage, by Region (2020–2032)
4.3.1 Growth in patient coverage across regions
4.3.2 Expansion of insurance and access programs
4.3.3 Shift from hospital-based to home-based care
4.4 Healthcare Spending, by Region and Payer Type (2024)
4.4.1 Government healthcare spending on rare diseases
4.4.2 Role of commercial insurance in therapy coverage
4.4.3 Out-of-pocket expenditure in emerging markets
4.4.4 Impact of pharma-led patient access programs
5. Spinal Muscular Atrophy Treatment Market Segmental Analysis & Forecast, By Disease Type, 2021 – 2032, Value (USD Billion)
5.1 Introduction
5.2 Type 0
5.2.1 Key Trends
5.2.2 Market Size & Forecast, 2021 – 2032
5.3 Type 1
5.3.1 Key Trends
5.3.2 Market Size & Forecast, 2021 – 2032
5.4 Type 2
5.4.1 Key Trends
5.4.2 Market Size & Forecast, 2021 – 2032
5.5 Type 3
5.5.1 Key Trends
5.5.2 Market Size & Forecast, 2021 – 2032
5.6 Type 4
5.6.1 Key Trends
5.6.2 Market Size & Forecast, 2021 – 2032
6. Spinal Muscular Atrophy Treatment Market Segmental Analysis & Forecast, By Treatment Modality, 2021 – 2032, Value (USD Billion)
6.1 Introduction
6.2 Gene Replacement Therapy
6.2.1 Key Trends
6.2.2 Market Size & Forecast, 2021 – 2032
6.3 SMN2 Splicing Modifiers
6.3.1 Key Trends
6.3.2 Market Size & Forecast, 2021 – 2032
6.4 Antisense-Oligonucleotide Therapy
6.4.1 Key Trends
6.4.2 Market Size & Forecast, 2021 – 2032
6.5 Muscle-Directed / Myostatin Inhibitors
6.5.1 Key Trends
6.5.2 Market Size & Forecast, 2021 – 2032
6.6 Supportive & Assistive Therapies
6.6.1 Key Trends
6.6.2 Market Size & Forecast, 2021 – 2032
7. Spinal Muscular Atrophy Treatment Market Segmental Analysis & Forecast, By Route of Administration, 2021 – 2032, Value (USD Billion)
7.1 Introduction
7.2 Oral
7.2.1 Key Trends
7.2.2 Market Size & Forecast, 2021 – 2032
7.3 Intrathecal
7.3.1 Key Trends
7.3.2 Market Size & Forecast, 2021 – 2032
7.4 Intravenous
7.4.1 Key Trends
7.4.2 Market Size & Forecast, 2021 – 2032
8. Spinal Muscular Atrophy Treatment Market Segmental Analysis & Forecast, By Age Group, 2021 – 2032, Value (USD Billion)
8.1 Introduction
8.2 Neonates (0–6 mo)
8.2.1 Key Trends
8.2.2 Market Size & Forecast, 2021 – 2032
8.3 Pediatrics (6 mo–12 y)
8.3.1 Key Trends
8.3.2 Market Size & Forecast, 2021 – 2032
8.4 Adolescents (12–18 y)
8.4.1 Key Trends
8.4.2 Market Size & Forecast, 2021 – 2032
8.5 Adults (>18 y)
8.5.1 Key Trends
8.5.2 Market Size & Forecast, 2021 – 2032
9. Spinal Muscular Atrophy Treatment Market Segmental Analysis & Forecast, By Distribution Channel, 2021 – 2032, Value (USD Billion)
9.1 Introduction
9.2 Hospital Pharmacies
9.2.1 Key Trends
9.2.2 Market Size & Forecast, 2021 – 2032
9.3 Specialty Clinics
9.3.1 Key Trends
9.3.2 Market Size & Forecast, 2021 – 2032
9.4 Online & Retail Pharmacies
9.4.1 Key Trends
9.4.2 Market Size & Forecast, 2021 – 2032
10. Spinal Muscular Atrophy Treatment Market Segmental Analysis & Forecast By Region, 2021 – 2032, Value (USD Billion)
10.1 Introduction
10.2 North America
10.2.1 Key Trends
10.2.2 Spinal Muscular Atrophy Treatment Market Size & Forecast, By Disease Type, 2021 – 2032
10.2.3 Spinal Muscular Atrophy Treatment Market Size & Forecast, By Treatment Modality, 2021 – 2032
10.2.4 Spinal Muscular Atrophy Treatment Market Size & Forecast, By Route of Administration, 2021 – 2032
10.2.5 Spinal Muscular Atrophy Treatment Market Size & Forecast, By Age Group, 2021 – 2032
10.2.6 Spinal Muscular Atrophy Treatment Market Size & Forecast, By Distribution Channel, 2021 – 2032
10.2.7 Spinal Muscular Atrophy Treatment Market Size & Forecast, By Country, 2021 – 2032
10.2.7.1 USA
10.2.7.1.1 Spinal Muscular Atrophy Treatment Market Size & Forecast, By Disease Type, 2021 – 2032
10.2.7.1.2 Spinal Muscular Atrophy Treatment Market Size & Forecast, By Treatment Modality, 2021 – 2032
10.2.7.1.3 Spinal Muscular Atrophy Treatment Market Size & Forecast, By Route of Administration, 2021 – 2032
10.2.7.1.4 Spinal Muscular Atrophy Treatment Market Size & Forecast, By Age Group, 2021 – 2032
10.2.7.1.5 Spinal Muscular Atrophy Treatment Market Size & Forecast, By Distribution Channel, 2021 – 2032
10.2.7.2 Canada
10.2.7.2.1 Spinal Muscular Atrophy Treatment Market Size & Forecast, By Disease Type, 2021 – 2032
10.2.7.2.2 Spinal Muscular Atrophy Treatment Market Size & Forecast, By Treatment Modality, 2021 – 2032
10.2.7.2.3 Spinal Muscular Atrophy Treatment Market Size & Forecast, By Route of Administration, 2021 – 2032
10.2.7.2.4 Spinal Muscular Atrophy Treatment Market Size & Forecast, By Age Group, 2021 – 2032
10.2.7.2.5 Spinal Muscular Atrophy Treatment Market Size & Forecast, By Distribution Channel, 2021 – 2032
10.3 Europe
10.3.1 Key Trends
10.3.2 Spinal Muscular Atrophy Treatment Market Size & Forecast, By Disease Type, 2021 – 2032
10.3.3 Spinal Muscular Atrophy Treatment Market Size & Forecast, By Treatment Modality, 2021 – 2032
10.3.4 Spinal Muscular Atrophy Treatment Market Size & Forecast, By Route of Administration, 2021 – 2032
10.3.5 Spinal Muscular Atrophy Treatment Market Size & Forecast, By Age Group, 2021 – 2032
10.3.6 Spinal Muscular Atrophy Treatment Market Size & Forecast, By Distribution Channel, 2021 – 2032
10.3.7 Spinal Muscular Atrophy Treatment Market Size & Forecast, By Country, 2021 – 2032
10.3.7.1 Germany
10.3.7.1.1 Spinal Muscular Atrophy Treatment Market Size & Forecast, By Disease Type, 2021 – 2032
10.3.7.1.2 Spinal Muscular Atrophy Treatment Market Size & Forecast, By Treatment Modality, 2021 – 2032
10.3.7.1.3 Spinal Muscular Atrophy Treatment Market Size & Forecast, By Route of Administration, 2021 – 2032
10.3.7.1.4 Spinal Muscular Atrophy Treatment Market Size & Forecast, By Age Group, 2021 – 2032
10.3.7.1.5 Spinal Muscular Atrophy Treatment Market Size & Forecast, By Distribution Channel, 2021 – 2032
10.3.7.2 UK
10.3.7.2.1 Spinal Muscular Atrophy Treatment Market Size & Forecast, By Disease Type, 2021 – 2032
10.3.7.2.2 Spinal Muscular Atrophy Treatment Market Size & Forecast, By Treatment Modality, 2021 – 2032
10.3.7.2.3 Spinal Muscular Atrophy Treatment Market Size & Forecast, By Route of Administration, 2021 – 2032
10.3.7.2.4 Spinal Muscular Atrophy Treatment Market Size & Forecast, By Age Group, 2021 – 2032
10.3.7.2.5 Spinal Muscular Atrophy Treatment Market Size & Forecast, By Distribution Channel, 2021 – 2032
10.3.7.3 France
10.3.7.3.1 Spinal Muscular Atrophy Treatment Market Size & Forecast, By Disease Type, 2021 – 2032
10.3.7.3.2 Spinal Muscular Atrophy Treatment Market Size & Forecast, By Treatment Modality, 2021 – 2032
10.3.7.3.3 Spinal Muscular Atrophy Treatment Market Size & Forecast, By Route of Administration, 2021 – 2032
10.3.7.3.4 Spinal Muscular Atrophy Treatment Market Size & Forecast, By Age Group, 2021 – 2032
10.3.7.3.5 Spinal Muscular Atrophy Treatment Market Size & Forecast, By Distribution Channel, 2021 – 2032
10.3.7.4 Italy
10.3.7.4.1 Spinal Muscular Atrophy Treatment Market Size & Forecast, By Disease Type, 2021 – 2032
10.3.7.4.2 Spinal Muscular Atrophy Treatment Market Size & Forecast, By Treatment Modality, 2021 – 2032
10.3.7.4.3 Spinal Muscular Atrophy Treatment Market Size & Forecast, By Route of Administration, 2021 – 2032
10.3.7.4.4 Spinal Muscular Atrophy Treatment Market Size & Forecast, By Age Group, 2021 – 2032
10.3.7.4.5 Spinal Muscular Atrophy Treatment Market Size & Forecast, By Distribution Channel, 2021 – 2032
10.3.7.5 Spain
10.3.7.5.1 Spinal Muscular Atrophy Treatment Market Size & Forecast, By Disease Type, 2021 – 2032
10.3.7.5.2 Spinal Muscular Atrophy Treatment Market Size & Forecast, By Treatment Modality, 2021 – 2032
10.3.7.5.3 Spinal Muscular Atrophy Treatment Market Size & Forecast, By Route of Administration, 2021 – 2032
10.3.7.5.4 Spinal Muscular Atrophy Treatment Market Size & Forecast, By Age Group, 2021 – 2032
10.3.7.5.5 Spinal Muscular Atrophy Treatment Market Size & Forecast, By Distribution Channel, 2021 – 2032
10.3.7.6 Russia
10.3.7.6.1 Spinal Muscular Atrophy Treatment Market Size & Forecast, By Disease Type, 2021 – 2032
10.3.7.6.2 Spinal Muscular Atrophy Treatment Market Size & Forecast, By Treatment Modality, 2021 – 2032
10.3.7.6.3 Spinal Muscular Atrophy Treatment Market Size & Forecast, By Route of Administration, 2021 – 2032
10.3.7.6.4 Spinal Muscular Atrophy Treatment Market Size & Forecast, By Age Group, 2021 – 2032
10.3.7.6.5 Spinal Muscular Atrophy Treatment Market Size & Forecast, By Distribution Channel, 2021 – 2032
10.3.7.7 Poland
10.3.7.7.1 Spinal Muscular Atrophy Treatment Market Size & Forecast, By Disease Type, 2021 – 2032
10.3.7.7.2 Spinal Muscular Atrophy Treatment Market Size & Forecast, By Treatment Modality, 2021 – 2032
10.3.7.7.3 Spinal Muscular Atrophy Treatment Market Size & Forecast, By Route of Administration, 2021 – 2032
10.3.7.7.4 Spinal Muscular Atrophy Treatment Market Size & Forecast, By Age Group, 2021 – 2032
10.3.7.7.5 Spinal Muscular Atrophy Treatment Market Size & Forecast, By Distribution Channel, 2021 – 2032
10.3.7.8 Rest of Europe
10.3.7.8.1 Spinal Muscular Atrophy Treatment Market Size & Forecast, By Disease Type, 2021 – 2032
10.3.7.8.2 Spinal Muscular Atrophy Treatment Market Size & Forecast, By Treatment Modality, 2021 – 2032
10.3.7.8.3 Spinal Muscular Atrophy Treatment Market Size & Forecast, By Route of Administration, 2021 – 2032
10.3.7.8.4 Spinal Muscular Atrophy Treatment Market Size & Forecast, By Age Group, 2021 – 2032
10.3.7.8.5 Spinal Muscular Atrophy Treatment Market Size & Forecast, By Distribution Channel, 2021 – 2032
10.4 Asia-Pacific
10.4.1 Key Trends
10.4.2 Spinal Muscular Atrophy Treatment Market Size & Forecast, By Disease Type, 2021 – 2032
10.4.3 Spinal Muscular Atrophy Treatment Market Size & Forecast, By Treatment Modality, 2021 – 2032
10.4.4 Spinal Muscular Atrophy Treatment Market Size & Forecast, By Route of Administration, 2021 – 2032
10.4.5 Spinal Muscular Atrophy Treatment Market Size & Forecast, By Age Group, 2021 – 2032
10.4.6 Spinal Muscular Atrophy Treatment Market Size & Forecast, By Distribution Channel, 2021 – 2032
10.4.7 Spinal Muscular Atrophy Treatment Market Size & Forecast, By Country, 2021 – 2032
10.4.7.1 China
10.4.7.1.1 Spinal Muscular Atrophy Treatment Market Size & Forecast, By Disease Type, 2021 – 2032
10.4.7.1.2 Spinal Muscular Atrophy Treatment Market Size & Forecast, By Treatment Modality, 2021 – 2032
10.4.7.1.3 Spinal Muscular Atrophy Treatment Market Size & Forecast, By Route of Administration, 2021 – 2032
10.4.7.1.4 Spinal Muscular Atrophy Treatment Market Size & Forecast, By Age Group, 2021 – 2032
10.4.7.1.5 Spinal Muscular Atrophy Treatment Market Size & Forecast, By Distribution Channel, 2021 – 2032
10.4.7.2 India
10.4.7.2.1 Spinal Muscular Atrophy Treatment Market Size & Forecast, By Disease Type, 2021 – 2032
10.4.7.2.2 Spinal Muscular Atrophy Treatment Market Size & Forecast, By Treatment Modality, 2021 – 2032
10.4.7.2.3 Spinal Muscular Atrophy Treatment Market Size & Forecast, By Route of Administration, 2021 – 2032
10.4.7.2.4 Spinal Muscular Atrophy Treatment Market Size & Forecast, By Age Group, 2021 – 2032
10.4.7.2.5 Spinal Muscular Atrophy Treatment Market Size & Forecast, By Distribution Channel, 2021 – 2032
10.4.7.3 Japan
10.4.7.3.1 Spinal Muscular Atrophy Treatment Market Size & Forecast, By Disease Type, 2021 – 2032
10.4.7.3.2 Spinal Muscular Atrophy Treatment Market Size & Forecast, By Treatment Modality, 2021 – 2032
10.4.7.3.3 Spinal Muscular Atrophy Treatment Market Size & Forecast, By Route of Administration, 2021 – 2032
10.4.7.3.4 Spinal Muscular Atrophy Treatment Market Size & Forecast, By Age Group, 2021 – 2032
10.4.7.3.5 Spinal Muscular Atrophy Treatment Market Size & Forecast, By Distribution Channel, 2021 – 2032
10.4.7.4 South Korea
10.4.7.4.1 Spinal Muscular Atrophy Treatment Market Size & Forecast, By Disease Type, 2021 – 2032
10.4.7.4.2 Spinal Muscular Atrophy Treatment Market Size & Forecast, By Treatment Modality, 2021 – 2032
10.4.7.4.3 Spinal Muscular Atrophy Treatment Market Size & Forecast, By Route of Administration, 2021 – 2032
10.4.7.4.4 Spinal Muscular Atrophy Treatment Market Size & Forecast, By Age Group, 2021 – 2032
10.4.7.4.5 Spinal Muscular Atrophy Treatment Market Size & Forecast, By Distribution Channel, 2021 – 2032
10.4.7.5 Australia
10.4.7.5.1 Spinal Muscular Atrophy Treatment Market Size & Forecast, By Disease Type, 2021 – 2032
10.4.7.5.2 Spinal Muscular Atrophy Treatment Market Size & Forecast, By Treatment Modality, 2021 – 2032
10.4.7.5.3 Spinal Muscular Atrophy Treatment Market Size & Forecast, By Route of Administration, 2021 – 2032
10.4.7.5.4 Spinal Muscular Atrophy Treatment Market Size & Forecast, By Age Group, 2021 – 2032
10.4.7.5.5 Spinal Muscular Atrophy Treatment Market Size & Forecast, By Distribution Channel, 2021 – 2032
10.4.7.6 ASEAN Countries
10.4.7.6.1 Spinal Muscular Atrophy Treatment Market Size & Forecast, By Disease Type, 2021 – 2032
10.4.7.6.2 Spinal Muscular Atrophy Treatment Market Size & Forecast, By Treatment Modality, 2021 – 2032
10.4.7.6.3 Spinal Muscular Atrophy Treatment Market Size & Forecast, By Route of Administration, 2021 – 2032
10.4.7.6.4 Spinal Muscular Atrophy Treatment Market Size & Forecast, By Age Group, 2021 – 2032
10.4.7.6.5 Spinal Muscular Atrophy Treatment Market Size & Forecast, By Distribution Channel, 2021 – 2032
10.4.7.7 Rest of Asia-Pacific
10.4.7.7.1 Spinal Muscular Atrophy Treatment Market Size & Forecast, By Disease Type, 2021 – 2032
10.4.7.7.2 Spinal Muscular Atrophy Treatment Market Size & Forecast, By Treatment Modality, 2021 – 2032
10.4.7.7.3 Spinal Muscular Atrophy Treatment Market Size & Forecast, By Route of Administration, 2021 – 2032
10.4.7.7.4 Spinal Muscular Atrophy Treatment Market Size & Forecast, By Age Group, 2021 – 2032
10.4.7.7.5 Spinal Muscular Atrophy Treatment Market Size & Forecast, By Distribution Channel, 2021 – 2032
10.5 Latin America
10.5.1 Key Trends
10.5.2 Spinal Muscular Atrophy Treatment Market Size & Forecast, By Disease Type, 2021 – 2032
10.5.3 Spinal Muscular Atrophy Treatment Market Size & Forecast, By Treatment Modality, 2021 – 2032
10.5.4 Spinal Muscular Atrophy Treatment Market Size & Forecast, By Route of Administration, 2021 – 2032
10.5.5 Spinal Muscular Atrophy Treatment Market Size & Forecast, By Age Group, 2021 – 2032
10.5.6 Spinal Muscular Atrophy Treatment Market Size & Forecast, By Distribution Channel, 2021 – 2032
10.5.7 Spinal Muscular Atrophy Treatment Market Size & Forecast, By Country, 2021 – 2032
10.5.7.1 Brazil
10.5.7.1.1 Spinal Muscular Atrophy Treatment Market Size & Forecast, By Disease Type, 2021 – 2032
10.5.7.1.2 Spinal Muscular Atrophy Treatment Market Size & Forecast, By Treatment Modality, 2021 – 2032
10.5.7.1.3 Spinal Muscular Atrophy Treatment Market Size & Forecast, By Route of Administration, 2021 – 2032
10.5.7.1.4 Spinal Muscular Atrophy Treatment Market Size & Forecast, By Age Group, 2021 – 2032
10.5.7.1.5 Spinal Muscular Atrophy Treatment Market Size & Forecast, By Distribution Channel, 2021 – 2032
10.5.7.2 Argentina
10.5.7.2.1 Spinal Muscular Atrophy Treatment Market Size & Forecast, By Disease Type, 2021 – 2032
10.5.7.2.2 Spinal Muscular Atrophy Treatment Market Size & Forecast, By Treatment Modality, 2021 – 2032
10.5.7.2.3 Spinal Muscular Atrophy Treatment Market Size & Forecast, By Route of Administration, 2021 – 2032
10.5.7.2.4 Spinal Muscular Atrophy Treatment Market Size & Forecast, By Age Group, 2021 – 2032
10.5.7.2.5 Spinal Muscular Atrophy Treatment Market Size & Forecast, By Distribution Channel, 2021 – 2032
10.5.7.3 Mexico
10.5.7.3.1 Spinal Muscular Atrophy Treatment Market Size & Forecast, By Disease Type, 2021 – 2032
10.5.7.3.2 Spinal Muscular Atrophy Treatment Market Size & Forecast, By Treatment Modality, 2021 – 2032
10.5.7.3.3 Spinal Muscular Atrophy Treatment Market Size & Forecast, By Route of Administration, 2021 – 2032
10.5.7.3.4 Spinal Muscular Atrophy Treatment Market Size & Forecast, By Age Group, 2021 – 2032
10.5.7.3.5 Spinal Muscular Atrophy Treatment Market Size & Forecast, By Distribution Channel, 2021 – 2032
10.5.7.4 Colombia
10.5.7.4.1 Spinal Muscular Atrophy Treatment Market Size & Forecast, By Disease Type, 2021 – 2032
10.5.7.4.2 Spinal Muscular Atrophy Treatment Market Size & Forecast, By Treatment Modality, 2021 – 2032
10.5.7.4.3 Spinal Muscular Atrophy Treatment Market Size & Forecast, By Route of Administration, 2021 – 2032
10.5.7.4.4 Spinal Muscular Atrophy Treatment Market Size & Forecast, By Age Group, 2021 – 2032
10.5.7.4.5 Spinal Muscular Atrophy Treatment Market Size & Forecast, By Distribution Channel, 2021 – 2032
10.5.7.5 Rest of Latin America
10.5.7.5.1 Spinal Muscular Atrophy Treatment Market Size & Forecast, By Disease Type, 2021 – 2032
10.5.7.5.2 Spinal Muscular Atrophy Treatment Market Size & Forecast, By Treatment Modality, 2021 – 2032
10.5.7.5.3 Spinal Muscular Atrophy Treatment Market Size & Forecast, By Route of Administration, 2021 – 2032
10.5.7.5.4 Spinal Muscular Atrophy Treatment Market Size & Forecast, By Age Group, 2021 – 2032
10.5.7.5.5 Spinal Muscular Atrophy Treatment Market Size & Forecast, By Distribution Channel, 2021 – 2032
10.6 Middle East & Africa
10.6.1 Key Trends
10.6.2 Spinal Muscular Atrophy Treatment Market Size & Forecast, By Disease Type, 2021 – 2032
10.6.3 Spinal Muscular Atrophy Treatment Market Size & Forecast, By Treatment Modality, 2021 – 2032
10.6.4 Spinal Muscular Atrophy Treatment Market Size & Forecast, By Route of Administration, 2021 – 2032
10.6.5 Spinal Muscular Atrophy Treatment Market Size & Forecast, By Age Group, 2021 – 2032
10.6.6 Spinal Muscular Atrophy Treatment Market Size & Forecast, By Distribution Channel, 2021 – 2032
10.6.7 Spinal Muscular Atrophy Treatment Market Size & Forecast, By Country, 2021 – 2032
10.6.7.1 UAE
10.6.7.1.1 Spinal Muscular Atrophy Treatment Market Size & Forecast, By Disease Type, 2021 – 2032
10.6.7.1.2 Spinal Muscular Atrophy Treatment Market Size & Forecast, By Treatment Modality, 2021 – 2032
10.6.7.1.3 Spinal Muscular Atrophy Treatment Market Size & Forecast, By Route of Administration, 2021 – 2032
10.6.7.1.4 Spinal Muscular Atrophy Treatment Market Size & Forecast, By Age Group, 2021 – 2032
10.6.7.1.5 Spinal Muscular Atrophy Treatment Market Size & Forecast, By Distribution Channel, 2021 – 2032
10.6.7.2 Saudi Arabia
10.6.7.2.1 Spinal Muscular Atrophy Treatment Market Size & Forecast, By Disease Type, 2021 – 2032
10.6.7.2.2 Spinal Muscular Atrophy Treatment Market Size & Forecast, By Treatment Modality, 2021 – 2032
10.6.7.2.3 Spinal Muscular Atrophy Treatment Market Size & Forecast, By Route of Administration, 2021 – 2032
10.6.7.2.4 Spinal Muscular Atrophy Treatment Market Size & Forecast, By Age Group, 2021 – 2032
10.6.7.2.5 Spinal Muscular Atrophy Treatment Market Size & Forecast, By Distribution Channel, 2021 – 2032
10.6.7.3 Qatar
10.6.7.3.1 Spinal Muscular Atrophy Treatment Market Size & Forecast, By Disease Type, 2021 – 2032
10.6.7.3.2 Spinal Muscular Atrophy Treatment Market Size & Forecast, By Treatment Modality, 2021 – 2032
10.6.7.3.3 Spinal Muscular Atrophy Treatment Market Size & Forecast, By Route of Administration, 2021 – 2032
10.6.7.3.4 Spinal Muscular Atrophy Treatment Market Size & Forecast, By Age Group, 2021 – 2032
10.6.7.3.5 Spinal Muscular Atrophy Treatment Market Size & Forecast, By Distribution Channel, 2021 – 2032
10.6.7.4 Egypt
10.6.7.4.1 Spinal Muscular Atrophy Treatment Market Size & Forecast, By Disease Type, 2021 – 2032
10.6.7.4.2 Spinal Muscular Atrophy Treatment Market Size & Forecast, By Treatment Modality, 2021 – 2032
10.6.7.4.3 Spinal Muscular Atrophy Treatment Market Size & Forecast, By Route of Administration, 2021 – 2032
10.6.7.4.4 Spinal Muscular Atrophy Treatment Market Size & Forecast, By Age Group, 2021 – 2032
10.6.7.4.5 Spinal Muscular Atrophy Treatment Market Size & Forecast, By Distribution Channel, 2021 – 2032
10.6.7.5 South Africa
10.6.7.5.1 Spinal Muscular Atrophy Treatment Market Size & Forecast, By Disease Type, 2021 – 2032
10.6.7.5.2 Spinal Muscular Atrophy Treatment Market Size & Forecast, By Treatment Modality, 2021 – 2032
10.6.7.5.3 Spinal Muscular Atrophy Treatment Market Size & Forecast, By Route of Administration, 2021 – 2032
10.6.7.5.4 Spinal Muscular Atrophy Treatment Market Size & Forecast, By Age Group, 2021 – 2032
10.6.7.5.5 Spinal Muscular Atrophy Treatment Market Size & Forecast, By Distribution Channel, 2021 – 2032
10.6.7.6 Rest of Middle East & Africa
10.6.7.6.1 Spinal Muscular Atrophy Treatment Market Size & Forecast, By Disease Type, 2021 – 2032
10.6.7.6.2 Spinal Muscular Atrophy Treatment Market Size & Forecast, By Treatment Modality, 2021 – 2032
10.6.7.6.3 Spinal Muscular Atrophy Treatment Market Size & Forecast, By Route of Administration, 2021 – 2032
10.6.7.6.4 Spinal Muscular Atrophy Treatment Market Size & Forecast, By Age Group, 2021 – 2032
10.6.7.6.5 Spinal Muscular Atrophy Treatment Market Size & Forecast, By Distribution Channel, 2021 – 2032
11. Competitive Landscape
11.1 Key Players' Positioning
11.2 Competitive Developments
11.2.1 Key Strategies Adopted (%), By Key Players, 2024
11.2.2 Year-Wise Strategies & Development, 2021 – 2025
11.2.3 Number Of Strategies Adopted By Key Players, 2024
11.3 Market Share Analysis, 2024
11.4 Product/Service & Treatment Modality Benchmarking
11.4.1 Product/Service Specifications & Features By Key Players
11.4.2 Product/Service Heatmap By Key Players
11.4.3 Treatment Modality Heatmap By Key Players
11.5 Industry Start-Up & Innovation Landscape
11.6 Key Company Profiles
11.6 Key Company Profiles
11.6.1 Biogen Inc.
11.6.1.1 Company Overview & Snapshot
11.6.1.2 Product/Service Portfolio
11.6.1.3 Key Company Financials
11.6.1.4 SWOT Analysis
11.6.2 Novartis AG
11.6.2.1 Company Overview & Snapshot
11.6.2.2 Product/Service Portfolio
11.6.2.3 Key Company Financials
11.6.2.4 SWOT Analysis
11.6.3 Roche Holding AG
11.6.3.1 Company Overview & Snapshot
11.6.3.2 Product/Service Portfolio
11.6.3.3 Key Company Financials
11.6.3.4 SWOT Analysis
11.6.4 PTC Therapeutics Inc.
11.6.4.1 Company Overview & Snapshot
11.6.4.2 Product/Service Portfolio
11.6.4.3 Key Company Financials
11.6.4.4 SWOT Analysis
11.6.5 Ionis Pharmaceuticals Inc.
11.6.5.1 Company Overview & Snapshot
11.6.5.2 Product/Service Portfolio
11.6.5.3 Key Company Financials
11.6.5.4 SWOT Analysis
11.6.6 REGENXBIO Inc.
11.6.6.1 Company Overview & Snapshot
11.6.6.2 Product/Service Portfolio
11.6.6.3 Key Company Financials
11.6.6.4 SWOT Analysis
11.6.7 Scholar Rock Holding Corporation
11.6.7.1 Company Overview & Snapshot
11.6.7.2 Product/Service Portfolio
11.6.7.3 Key Company Financials
11.6.7.4 SWOT Analysis
11.6.8 Astellas Pharma Inc.
11.6.8.1 Company Overview & Snapshot
11.6.8.2 Product/Service Portfolio
11.6.8.3 Key Company Financials
11.6.8.4 SWOT Analysis
11.6.9 AveXis Inc.
11.6.9.1 Company Overview & Snapshot
11.6.9.2 Product/Service Portfolio
11.6.9.3 Key Company Financials
11.6.9.4 SWOT Analysis
11.6.10 Cure SMA
11.6.10.1 Company Overview & Snapshot
11.6.10.2 Product/Service Portfolio
11.6.10.3 Key Company Financials
11.6.10.4 SWOT Analysis
11.6.11 Audentes Therapeutics
11.6.11.1 Company Overview & Snapshot
11.6.11.2 Product/Service Portfolio
11.6.11.3 Key Company Financials
11.6.11.4 SWOT Analysis
11.6.12 Biohaven Ltd.
11.6.12.1 Company Overview & Snapshot
11.6.12.2 Product/Service Portfolio
11.6.12.3 Key Company Financials
11.6.12.4 SWOT Analysis
11.6.13 Catalyst Pharmaceuticals Inc.
11.6.13.1 Company Overview & Snapshot
11.6.13.2 Product/Service Portfolio
11.6.13.3 Key Company Financials
11.6.13.4 SWOT Analysis
11.6.14 Marinus Pharmaceuticals Inc.
11.6.14.1 Company Overview & Snapshot
11.6.14.2 Product/Service Portfolio
11.6.14.3 Key Company Financials
11.6.14.4 SWOT Analysis
11.6.15 Sarepta Therapeutics Inc.
11.6.15.1 Company Overview & Snapshot
11.6.15.2 Product/Service Portfolio
11.6.15.3 Key Company Financials
11.6.15.4 SWOT Analysis
11.6.16 Pfizer Inc.
11.6.16.1 Company Overview & Snapshot
11.6.16.2 Product/Service Portfolio
11.6.16.3 Key Company Financials
11.6.16.4 SWOT Analysis
11.6.17 Ultragenyx Pharmaceutical Inc.
11.6.17.1 Company Overview & Snapshot
11.6.17.2 Product/Service Portfolio
11.6.17.3 Key Company Financials
11.6.17.4 SWOT Analysis
11.6.18 Voyager Therapeutics Inc.
11.6.18.1 Company Overview & Snapshot
11.6.18.2 Product/Service Portfolio
11.6.18.3 Key Company Financials
11.6.18.4 SWOT Analysis
11.6.19 NantKwest
11.6.19.1 Company Overview & Snapshot
11.6.19.2 Product/Service Portfolio
11.6.19.3 Key Company Financials
11.6.19.4 SWOT Analysis
11.6.20 Cytokinetics Inc.
11.6.20.1 Company Overview & Snapshot
11.6.20.2 Product/Service Portfolio
11.6.20.3 Key Company Financials
11.6.20.4 SWOT Analysis
12. Analyst Recommendations
12.1 SNS Insider Opportunity Map
12.2 Industry Low-Hanging Fruit Assessment
12.3 Market Entry & Growth Strategy
12.4 Analyst Viewpoint & Suggestions On Market Growth
13. Assumptions
14. Disclaimer
15. Appendix
15.1 List Of Tables
15.2 List Of Figures
An accurate research report requires proper strategizing as well as implementation. There are multiple factors involved in the completion of good and accurate research report and selecting the best methodology to compete the research is the toughest part. Since the research reports we provide play a crucial role in any company’s decision-making process, therefore we at SNS Insider always believe that we should choose the best method which gives us results closer to reality. This allows us to reach at a stage wherein we can provide our clients best and accurate investment to output ratio.
Each report that we prepare takes a timeframe of 350-400 business hours for production. Starting from the selection of titles through a couple of in-depth brain storming session to the final QC process before uploading our titles on our website we dedicate around 350 working hours. The titles are selected based on their current market cap and the foreseen CAGR and growth.
The 5 steps process:
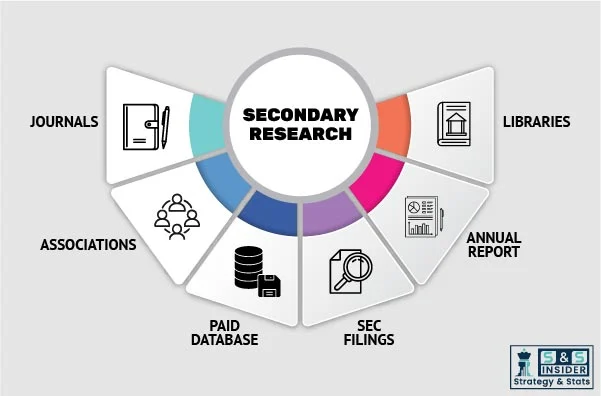
Step 1: Secondary Research:
Secondary Research or Desk Research is as the name suggests is a research process wherein, we collect data through the readily available information. In this process we use various paid and unpaid databases which our team has access to and gather data through the same. This includes examining of listed companies’ annual reports, Journals, SEC filling etc. Apart from this our team has access to various associations across the globe across different industries. Lastly, we have exchange relationships with various university as well as individual libraries.
Step 2: Primary Research
When we talk about primary research, it is a type of study in which the researchers collect relevant data samples directly, rather than relying on previously collected data. This type of research is focused on gaining content specific facts that can be sued to solve specific problems. Since the collected data is fresh and first hand therefore it makes the study more accurate and genuine.
We at SNS Insider have divided Primary Research into 2 parts.
Part 1 wherein we interview the KOLs of major players as well as the upcoming ones across various geographic regions. This allows us to have their view over the market scenario and acts as an important tool to come closer to the accurate market numbers. As many as 45 paid and unpaid primary interviews are taken from both the demand and supply side of the industry to make sure we land at an accurate judgement and analysis of the market.
This step involves the triangulation of data wherein our team analyses the interview transcripts, online survey responses and observation of on filed participants. The below mentioned chart should give a better understanding of the part 1 of the primary interview.

Part 2: In this part of primary research the data collected via secondary research and the part 1 of the primary research is validated with the interviews from individual consultants and subject matter experts.
Consultants are those set of people who have at least 12 years of experience and expertise within the industry whereas Subject Matter Experts are those with at least 15 years of experience behind their back within the same space. The data with the help of two main processes i.e., FGDs (Focused Group Discussions) and IDs (Individual Discussions). This gives us a 3rd party nonbiased primary view of the market scenario making it a more dependable one while collation of the data pointers.
Step 3: Data Bank Validation
Once all the information is collected via primary and secondary sources, we run that information for data validation. At our intelligence centre our research heads track a lot of information related to the market which includes the quarterly reports, the daily stock prices, and other relevant information. Our data bank server gets updated every fortnight and that is how the information which we collected using our primary and secondary information is revalidated in real time.

Step 4: QA/QC Process
After all the data collection and validation our team does a final level of quality check and quality assurance to get rid of any unwanted or undesired mistakes. This might include but not limited to getting rid of the any typos, duplication of numbers or missing of any important information. The people involved in this process include technical content writers, research heads and graphics people. Once this process is completed the title gets uploader on our platform for our clients to read it.
Step 5: Final QC/QA Process:
This is the last process and comes when the client has ordered the study. In this process a final QA/QC is done before the study is emailed to the client. Since we believe in giving our clients a good experience of our research studies, therefore, to make sure that we do not lack at our end in any way humanly possible we do a final round of quality check and then dispatch the study to the client.
By Disease Type
By Treatment Modality
By Route of Administration
By Age Group
By Distribution Channel
Request for Segment Customization as per your Business Requirement: https://www.snsinsider.com/sample-request/3384
Regional Coverage:
North America
Europe
Asia Pacific
Middle East & Africa
Latin America
Request for Country Level Research Report: https://www.snsinsider.com/sample-request/3384
Available Customization
With the given market data, SNS Insider offers customization as per the company’s specific needs. The following customization options are available for the report: